

It’s time for a weekend precious metals update, and I have even more good news to share as precious metals and miners continue their vibrant rally from the dark days of despair in late July. Over the past week, spot gold surged $226 per ounce, or 5.17%, to close Friday at $4,602.99, while silver soared $4.28 per ounce, or 6.62%, to close at $68.97. Platinum surged 7.66%, palladium gained 2.81%, while gold and silver mining stocks exploded 14% and 11%, respectively.
There are a number of factors behind this rally, including the technical breakout I pointed out virtually at the bottom on July 21, as precious metals began rebounding from their correction that started in January. That correction was simply excessive and irrational, especially considering that precious metals are still only in the early stages of a long-term bull market with many more years left to run, as I explained in this report.
Other major catalysts include the decline in the U.S. dollar since late July and, as of this week, the U.S. Department of the Treasury’s Wednesday announcement that it would ramp up its Treasury bond purchases in an effort to keep yields down following their recent spike.
What further fueled the precious metals and miners rally toward the end of the week was the Treasury market’s reaction to the initial announcement of increased bond buying. Although Treasury yields initially sank on the news on Wednesday, they rallied sharply by the end of the week and nearly erased the entire decline, much to the chagrin of Treasury Secretary Scott Bessent. In response, Bessent upped the ante by saying that government debt buybacks could be even larger than the originally announced $4 billion per operation.
The reason precious metals and commodities across the board surged following these bond-buying announcements is that the program is being perceived as “QE Lite,” or a form of quantitative easing or QE. Although important details are still pending, many commentators, including Peter Schiff, believe these bond purchases will ultimately be funded by the Fed’s digital printing press (so to speak), resulting in further dollar debasement, which would not surprise me at all.
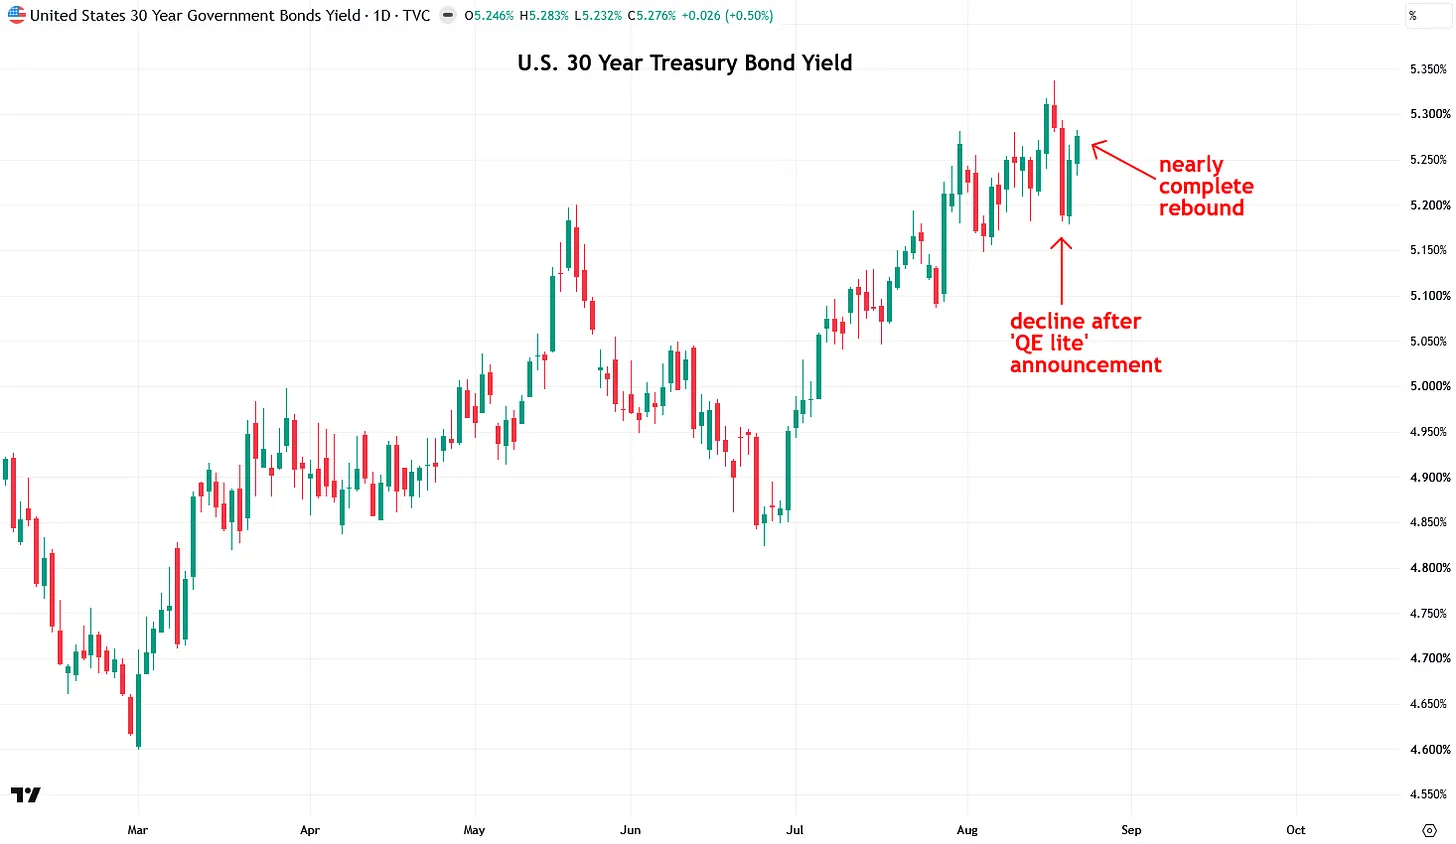
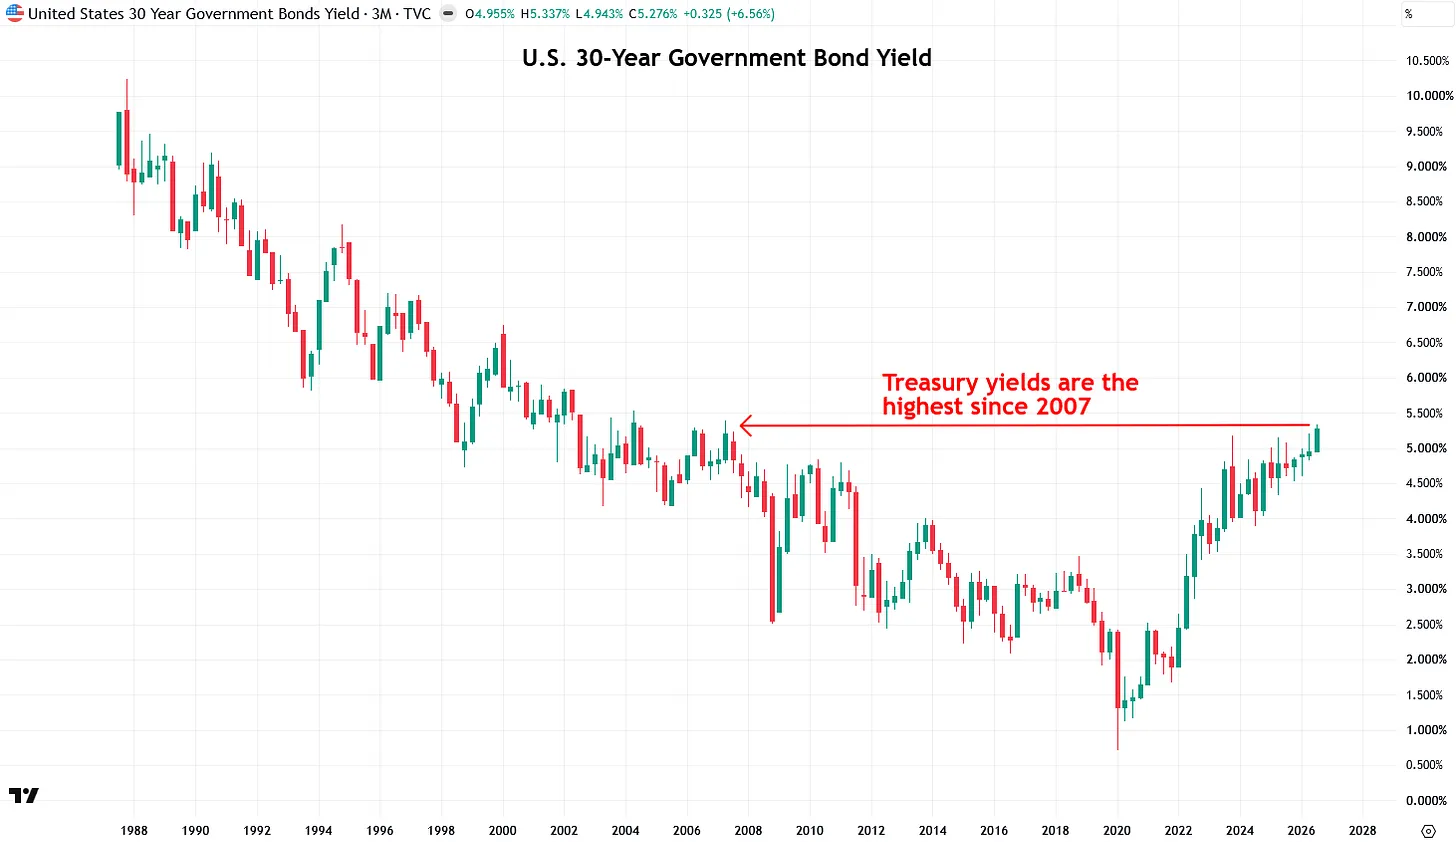
As I explained following the initial bond-buying announcement on Wednesday, the purpose of the program is to cap or slow the recent rise in U.S. Treasury yields, which have climbed to their highest levels in two decades amid higher inflation resulting from the Iran war and the ensuing surge in energy prices.
The recent increase in Treasury yields poses a major threat to the economy and financial markets, as well as to the U.S. federal government, whose national debt officially hit $40 trillion this week. Annual interest payments on that debt have also reached an all-time high of $1.25 trillion, doubling in just five years, and the burden will only grow worse if Treasury yields remain at these levels or climb even higher.
Unfortunately, I only foresee bond yields continuing to surge across the board, including government and corporate yields in the United States and around the world, due to unsustainable debt burdens and the high rates of inflation I expect over the next decade, which the rise in precious metals and commodities is already heralding.
I also foresee governments ultimately resorting to even more aggressive bond-buying programs, such as yield curve control (YCC), using outright debt monetization or money creation. This will further exacerbate fiat currency debasement and inflation, and ironically lead to even higher interest rates over the long run, all of which will prove explosively bullish for hard assets, including precious metals.
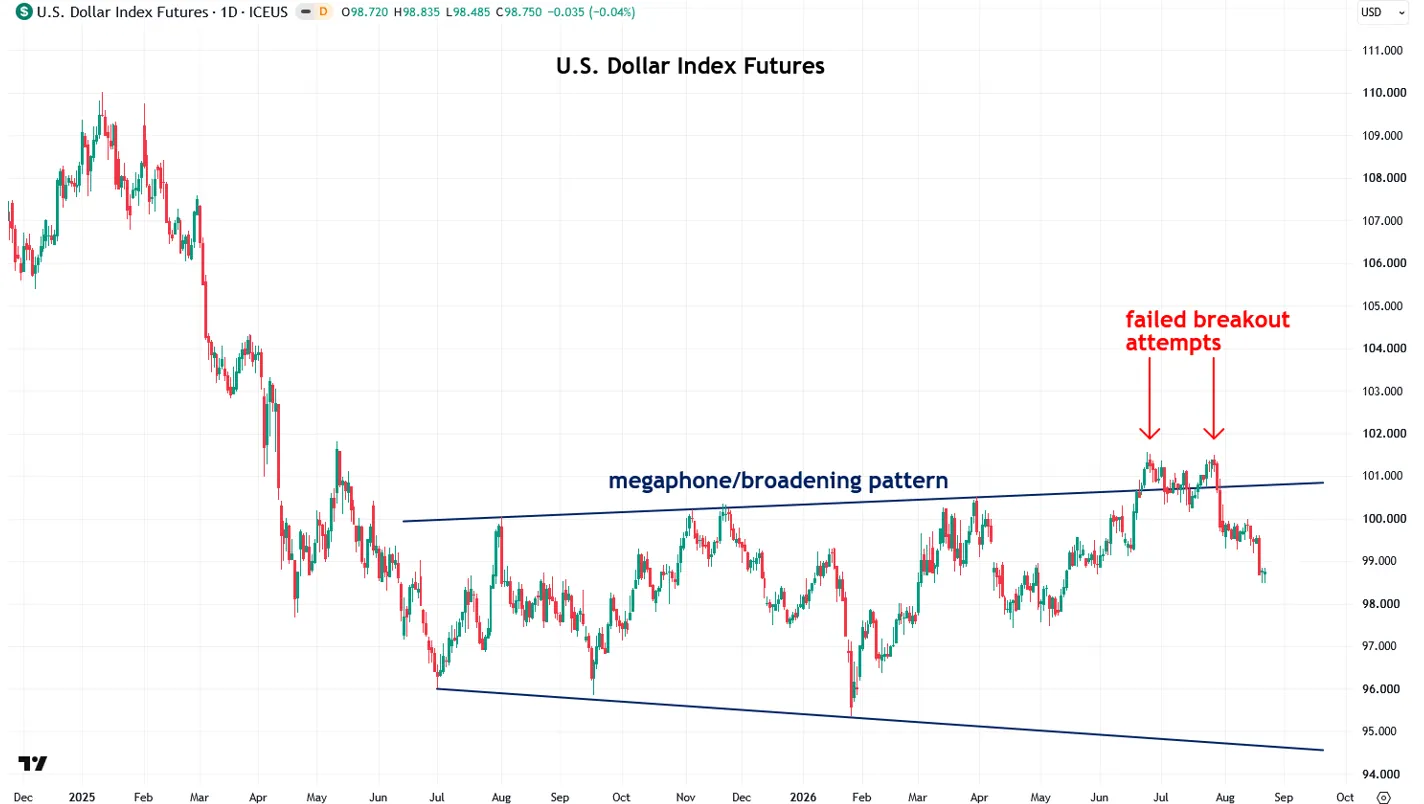
The Treasury’s surprise bond-buying announcements have further pressured the U.S. Dollar Index, extending the downtrend that began in late July amid a halt in U.S. kinetic action against Iran, a series of weak U.S. jobs reports, and the resulting decline in Fed rate hike expectations.
The decline in the U.S. Dollar Index over the past month has been a major bullish catalyst for precious metals and commodities, helping to fuel their powerful rally from the dark days of July, just as I expected in my July 29 analysis.
After failing twice to break out of the broadening pattern that has formed over the past year, I am now watching to see whether the Dollar Index targets the lower end of that pattern at roughly 94 to 95 in the coming months. If it does, that would provide an even stronger boost for precious metals and should send them surging even higher.
Major potential catalysts for the dollar and precious metals in the coming week include the July U.S. Personal Consumption Expenditures (PCE) report on Wednesday morning and Fed Chair Kevin Warsh’s first speech at the annual Jackson Hole conference on Friday. Investors will be closely watching Warsh for greater clarity on how he believes the U.S. central bank should respond to stubbornly high inflation.
The PCE is the Fed’s preferred inflation gauge, with the annual headline reading expected to come in at 3.6% and core PCE at 3.3%. Any significant deviation from those expectations should cause a big move across the financial markets, with a cooler-than-expected reading being bullish for risk assets and precious metals (and bearish for the dollar) and a hotter-than-expected reading bearish for risk assets and precious metals (and bullish for the dollar).
Over the longer run, the Fed’s inflation target is 2%, and we are clearly running well above that level, with the U.S.-Iran war and resulting surge in energy costs and inflation pushing it in the opposite direction from where the Fed wants it to go.
Now let’s take a look at where precious metals stand, starting with gold, which leads the overall complex.
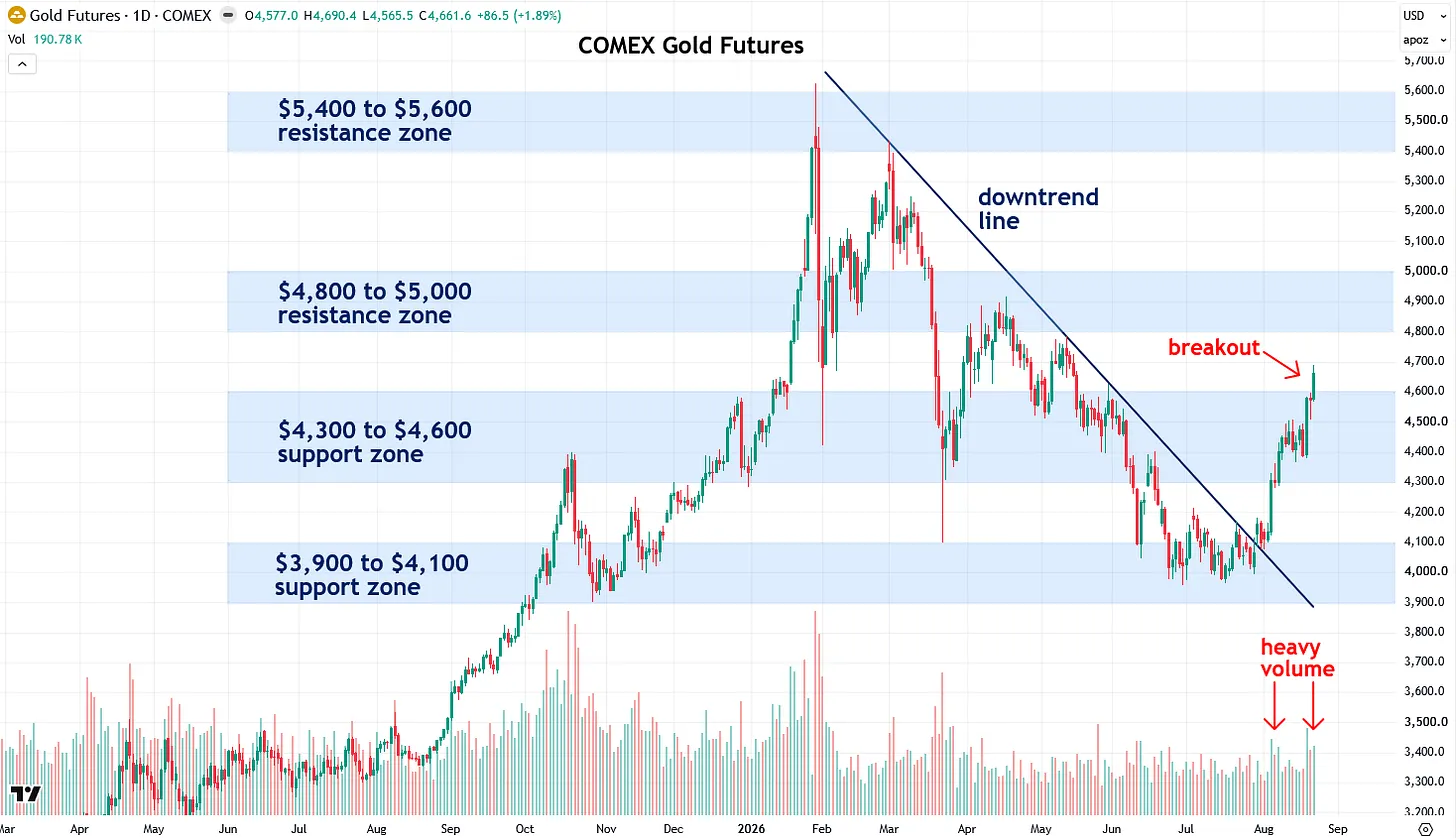
Gold’s nearly $700-per-ounce, or 16%, surge over the past month began precisely off the $3,900 to $4,100 support zone that I had been highlighting throughout my updates in recent months. This key support zone was formed by the major lows of October and November 2025, as well as during the sharp but brief selloff in March 2026.
To learn more about support and resistance zones, I recommend reading my two-part tutorial (Part 1 and Part 2).
What is particularly remarkable is that during the dark days of June and July, I received emails from naysayers claiming that precious metals are somehow unlike other assets and that support and resistance zones are therefore virtually useless for analyzing them. Yet you have just witnessed the efficacy of this methodology play out in real time, right before your eyes.
Also, I must note that just because precious metals may break below a support zone, as occurred in June, or above a resistance zone doesn’t mean that the zone or the overall methodology is not valid. Breakouts and breakdowns are an integral part of the methodology, hence why I focus so much on monitoring whether the asset respects the zone or breaks through it, putting the next support or resistance zone into play.
Some further excellent news is that on Friday, gold finally surpassed the next hurdle I had been monitoring: the $4,300 to $4,600 resistance zone, which formed over a nine-month period from the key highs and lows between October and June. As a result of this breakout, that former resistance zone has now become a support zone once again.
Gold’s recent breakout above the downtrend line that formed from January to July, along with its breakout above the $4,300 to $4,600 zone, now greatly increases the odds that the correction that began earlier this year is officially behind us and that a strong recovery rally should continue through the end of the year and beyond.
The strong volume on key bullish days over the past month adds significant confirmation to this rally, as it shows that institutions, or the “smart money,” are behind the move, as I explained in this tutorial.
Gold’s next key hurdles to surpass are the $4,800 to $5,000 resistance zone, formed by the key highs and lows from February through May, followed by the final and most important resistance zone at $5,400 to $5,600, formed by the peaks in January and February before the correction began.
When an asset recovers from a correction, as gold is currently in the process of doing, each overhead resistance zone represents an important hurdle that must be surpassed. These zones represent areas where above-average amounts of supply are likely to come onto the market, as investors who bought near those prior peaks may sell once the price returns to their entry point, allowing them to break even.
For this reason, I tend to be more cautious and less gung-ho about buying aggressively after a correction (when trading as opposed to stacking bullion), with the odds of a successful and smoother rally becoming much higher once an asset breaks out into blue-sky territory with no major resistance overhead. This flies in the face of the conventional “buy low and sell high” wisdom, instead favoring the approach of “buy high and sell higher.”
With that in mind, I am looking forward to the day when gold clears its final and most important resistance zone at $5,400 to $5,600—and it will happen! Once that occurs, gold will be back in blue-sky territory with maximum odds of rallying much higher, and I expect the price action to become even smoother than during the current recovery process, when each successive resistance zone must first be challenged and overcome.
As a reminder, I firmly believe that precious metals and miners are in a long-term bull market that began only in April 2024 and has at least another eight years to run based on historical cycles. I believe the January-to-August correction was merely a healthy pause within that bull market rather than the beginning of a new bear market. Read my recent report, where I explained this thesis in detail.
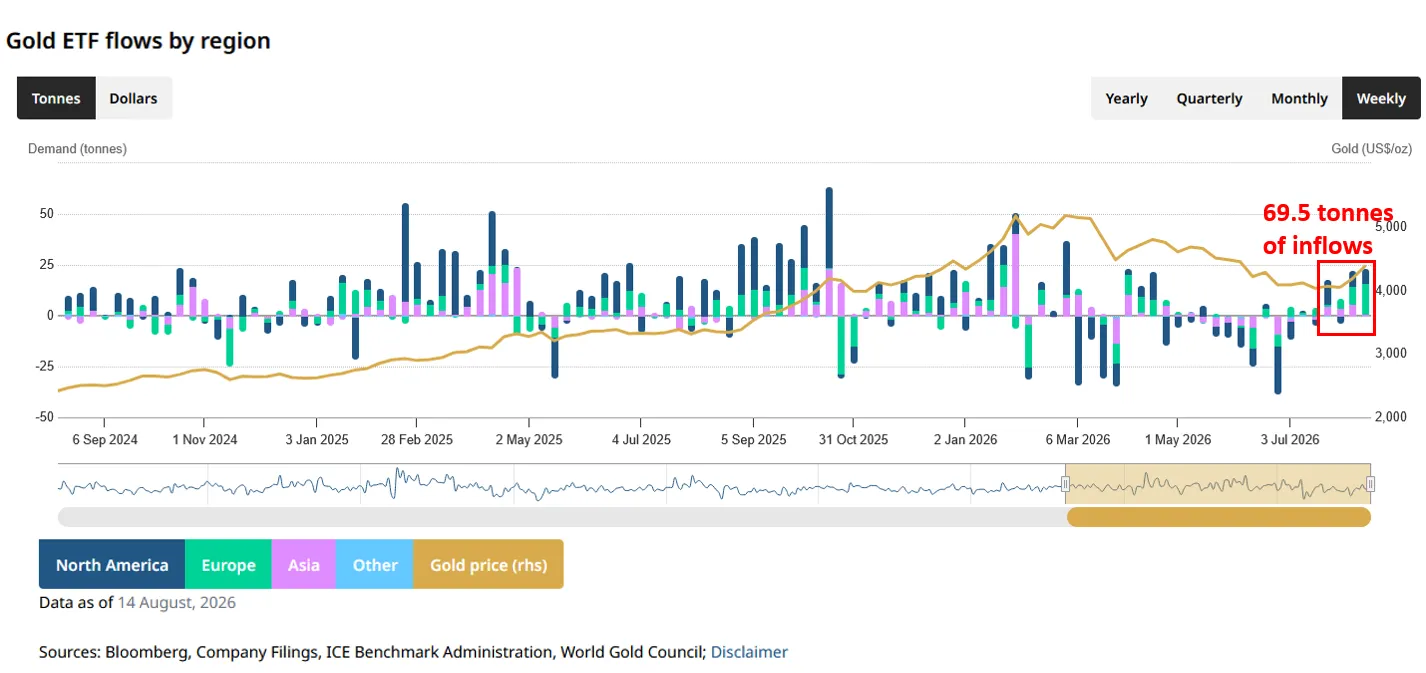
Further fueling gold’s rally and confirming its legitimacy is the strong and steady increase in global gold exchange-traded fund (ETF) inflows in recent weeks, totaling 69.5 metric tonnes of gold worth $9.6 billion and marking the most consistent inflows since the correction began:
Silver also continues its roughly $15-per-ounce, or 27%, rally, which launched precisely off the $45 to $55 support zone I have been highlighting since June 24. This support zone was established by the highs and lows in October and November 2025. Once again, this confirms the efficacy of support and resistance zones, contrary to what the naysayers were claiming during the cynical days of early summer.
Silver’s breakout above the downtrend line that began in late January, combined with heavy volume on key up days, provides further bullish confirmation that the correction is almost certainly behind us and that the recovery rally should continue through the second half of 2026 and beyond.
I am still waiting for silver to close decisively above the $60 to $70 resistance zone, formed by the key lows between December and June, as that would provide another strong bullish signal.
Assuming silver surpasses the $60 to $70 resistance zone, which may happen this coming week, the next major hurdle will be the $90 to $100 resistance zone, formed by the peaks from February through May, followed by the final and most important resistance zone at $110 to $120, formed at the late-January peak.
Once the January peak is surpassed, silver will enter blue-sky territory with no major resistance overhead, at which point a vibrant and much smoother rally should ensue. Until then, the goal is to surpass each successive hurdle while remaining aware of potential hiccups along the way at key resistance zones, where additional supply is likely to come onto the market as investors who bought near prior peaks sell upon breaking even.
As a reminder, my position is that silver is still in the very early stages of a long-term bull market with many more years left to run, and that the correction from January to early August was not at all the end of that bull market, but simply a pause after two very strong bullish years. I explained this thesis in detail in my recent silver report.

Comments
Log in or sign up to join the conversation.