


Ever since precious metals began correcting in January 2026, following two explosive bullish years in 2024 and 2025, there has been a growing chorus of pessimists claiming that gold and silver had been in a bubble that has now burst and that they face at least a decade of sharply declining prices, repeating what followed their historic peaks in 1980 and 2011.
Even several prominent analysts who were previously bullish on precious metals have now changed their tune and joined the bearish camp. That camp is largely populated by those who lack a strong understanding of or conviction in the highly bullish case for precious metals, along with many Bitcoin and cryptocurrency enthusiasts.
The latter view practically every dip in gold and silver as a sign that they are about to become obsolete as mere rocks. They expect their preferred cryptocurrency to steal precious metals’ thunder and replace them as humanity’s premier store of value after 5,000 years of precious metals dominance, a thesis I disagree with for the reasons I explained in this report.
The Bubble Bubble Report is a reader-supported publication. To receive new posts and support my work, consider becoming a free or paid subscriber.
I, however, have consistently argued the opposite: precious metals were not, and are not, in a bubble that is now bursting. This is simply normal correction within a powerful secular bull market that began only in the spring of 2024 and still has many years to run, ultimately taking prices far beyond even the levels reached in January 2026.
For example, as I demonstrated in a recent report, while precious metals became somewhat frothy in late 2025 and early 2026, a true bubble mania accompanied by widespread investor participation never actually occurred. Such manias have historically marked the end of generational precious metals bull markets, and because we have yet to experience one in this cycle, I believe that phase still lies ahead.
In today’s report, I will present even more evidence that precious metals have never become overvalued during the current cycle. The evidence simply does not support the assertion that gold and silver were in a bubble earlier this year. On the contrary, they remain undervalued and have much further to run before there is any reason to become concerned about a bubble.
My argument is based on comparing gold and silver with the U.S. stock market, as measured by the bellwether S&P 500 Index. This comparison is highly relevant because precious metals and stocks have historically acted as counterbalances to one another, with capital flowing between the two asset classes in recurring cycles lasting roughly a decade that have helped drive their respective secular bull markets.
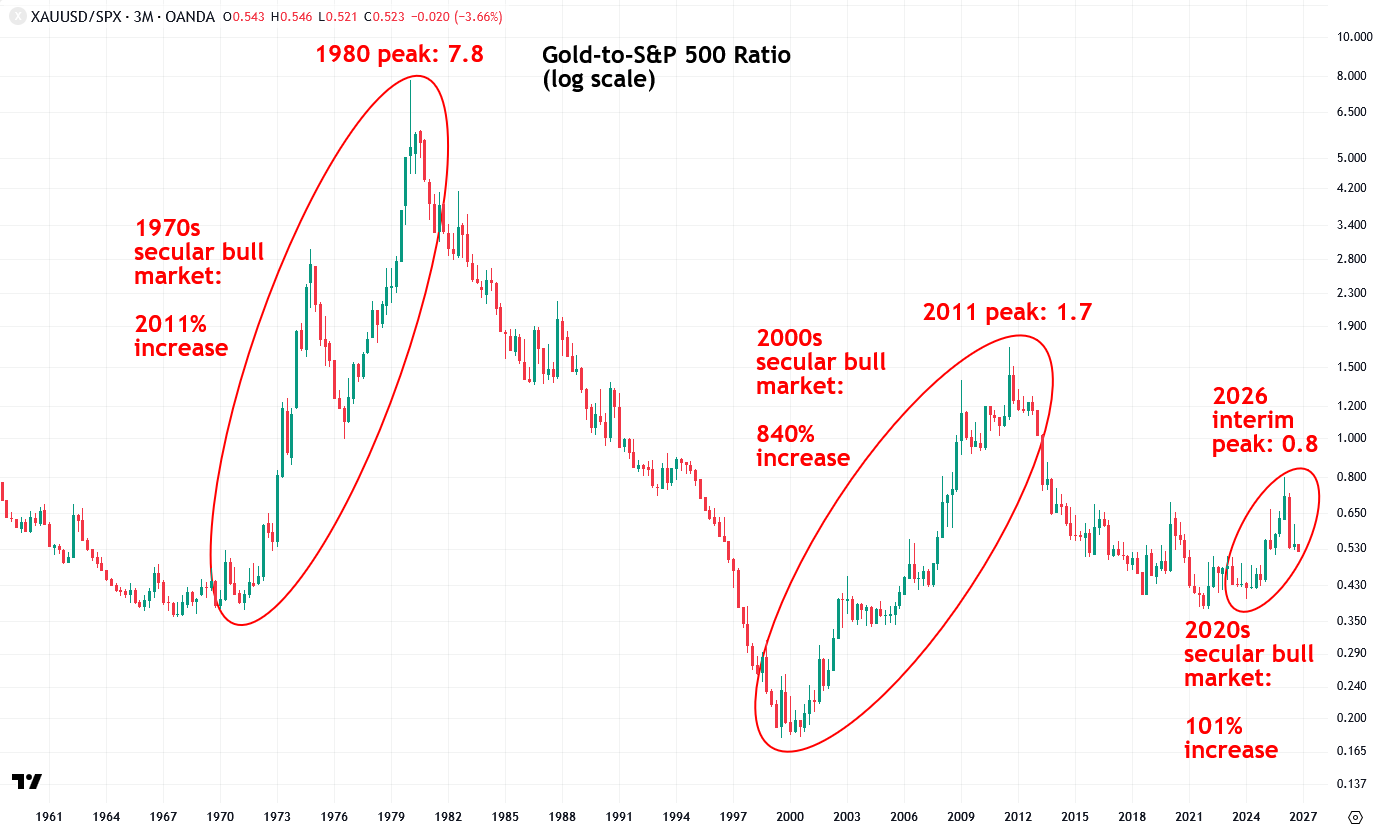
Let’s start with the gold-to-S&P 500 ratio. When the ratio rises, gold is outperforming stocks, and when it falls, stocks are outperforming gold. Sustained rises in the ratio have historically accompanied gold’s major secular bull markets, including those of the 1970s and 2000s, as well as the current secular bull market that began in early 2024, as I explained in this report.
Another useful application of the gold-to-S&P 500 ratio is as a valuation metric for gold. Historically high readings indicate that gold is overvalued, both relative to stocks and in absolute terms, and that its secular bull market is nearing its end, making it an opportune time to consider selling gold and buying stocks. Conversely, historically low readings indicate that gold is undervalued, both relative to stocks and in absolute terms, making it an attractive time to favor gold over stocks.
Now let’s review gold’s secular bull markets of the 1970s and 2000s and compare them with the current one. As I will show, gold has not risen nearly as much as it did during those previous bull markets, never became overvalued relative to stocks, and is actually still near the lower end of its historical valuation range.
During the 1970s secular bull market, gold surged 2,011% against the S&P 500, with the ratio peaking at 7.8 in 1980. During the 2000s bull market, gold soared 840% against the S&P 500, with the ratio peaking at 1.7 in 2011. In contrast, gold has risen just 101% against the S&P 500 during the current secular bull market, reaching an interim peak of merely 0.8 in January.
If it isn’t already evident, this shows that gold’s bull market has barely gotten underway. Gold has yet to approach the historical valuation levels that preceded previous generational bear markets, indicating that the current secular bull market is still in its early stages, with many more years of healthy gains ahead.
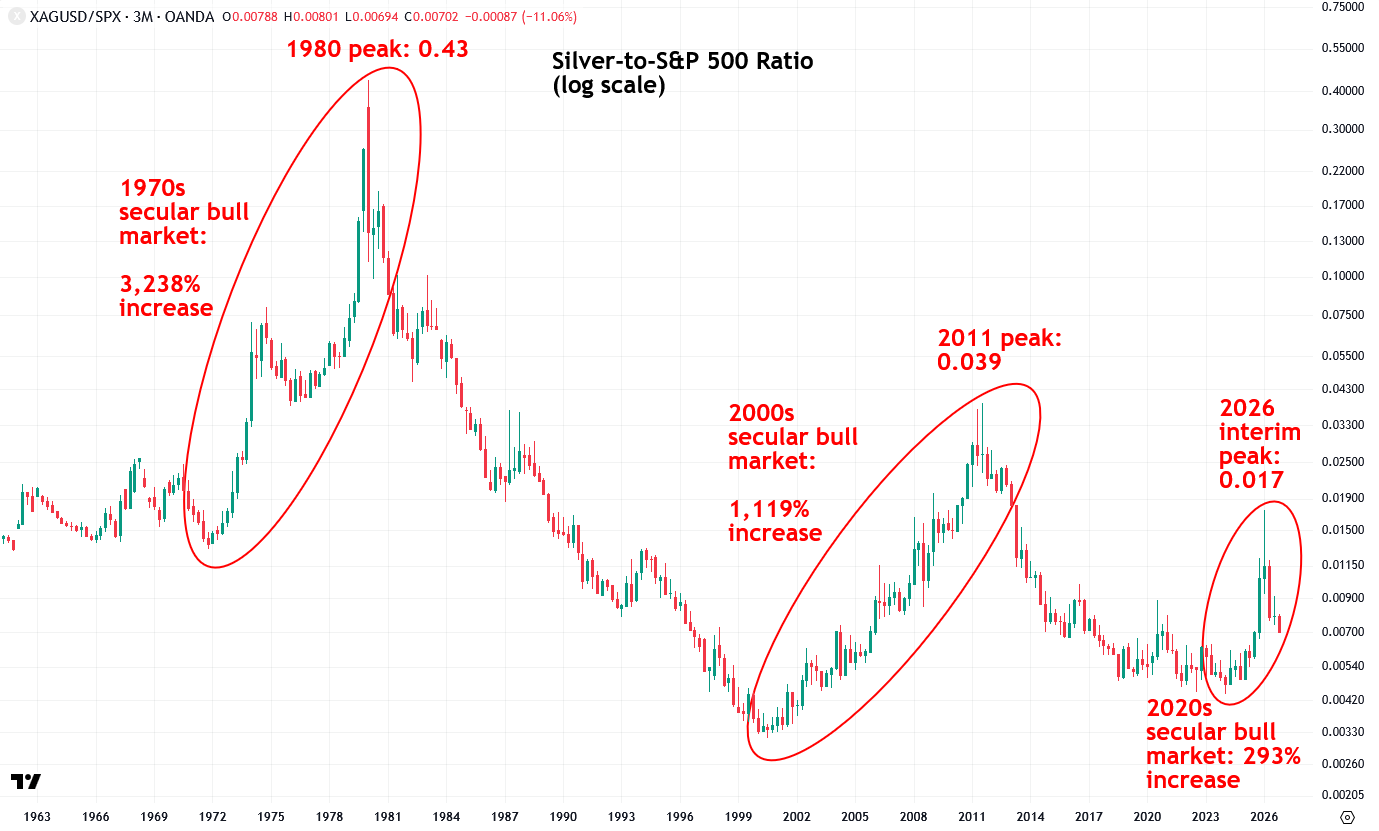
The silver-to-S&P 500 ratio tells much the same story as the gold-to-S&P 500 ratio. While silver’s gains in 2024 and 2025 seemed impressive, they still fall far short of those seen during the secular bull markets of the 1970s and 2000s, both in absolute percentage gains and relative to stocks.
During the 1970s secular bull market, silver surged 3,238% against the S&P 500, with the ratio peaking at 0.43 in 1980. During the 2000s bull market, silver soared 1,119% against the S&P 500, with the ratio peaking at 0.039 in 2011. By comparison, silver has risen just 293% against the S&P 500 during the current secular bull market, reaching an interim peak of only 0.017 in January.
The Bubble Bubble Report is a reader-supported publication. To receive new posts and support my work, consider becoming a free or paid subscriber.
Those claiming that silver’s bull run from 2024 through early 2026 was excessive, left it overvalued, and represented a bubble that has now burst, setting the stage for a decade or more of declining prices, are relying more on their own biases and gut feelings than the facts.
If that was a bubble, it was certainly one of the most anemic and disappointing bubbles in history!
Of course, I don’t believe silver has experienced a bubble yet in this cycle, and the fact that the silver-to-S&P 500 ratio remains near the lower end of its historical range further confirms that view.
Again, it is important to remember that this ratio serves as a valuation metric for silver: historically high readings indicate that silver is overvalued while low readings indicate that it is undervalued, as is the case today.
While the previous charts compared gold and silver with the S&P 500, let’s now turn to the S&P 500 itself to see just how far it has risen since the current bull market began in the dark days of March 2009.
Since then, the index has surged an incredible 1,052%, or more than elevenfold, outpacing both gold and silver over that period and contributing to the historically low valuations of precious metals relative to stocks.
At face value, such impressive stock market performance may seem like a positive sign that the U.S. economy is thriving and Americans are growing wealthier. My major concern, however, is that these gains have hardly been organic.
Instead, they have been fueled by the Federal Reserve’s unprecedented monetary policies since the 2008 Global Financial Crisis and the 2020 pandemic, including zero interest rate policy, or ZIRP (see chart), and quantitative easing, or QE (see chart), which essentially involved creating trillions of dollars of new money out of thin air.

Comments
Log in or sign up to join the conversation.