


Key Market Outlook(s) and Pick(s)
On Tuesday, I joined Brian Sozzi on Yahoo! Finance to discuss markets, the economy, outlook, rotation, oil, bonds, tech, Apple (AAPL), Robinhood (HOOD), and a lot more. Thanks to Brian and Kayla Hawkins for having me on:
Video Length: 00:09:05
Advance Auto Parts (AAP) Update
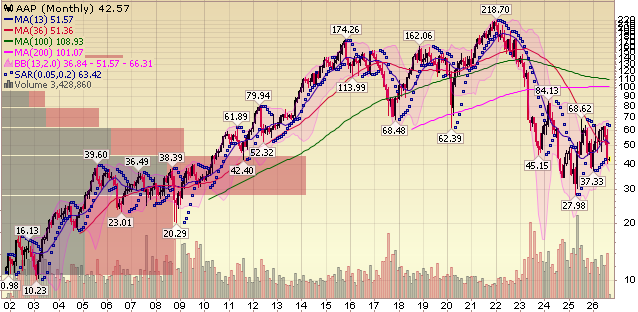
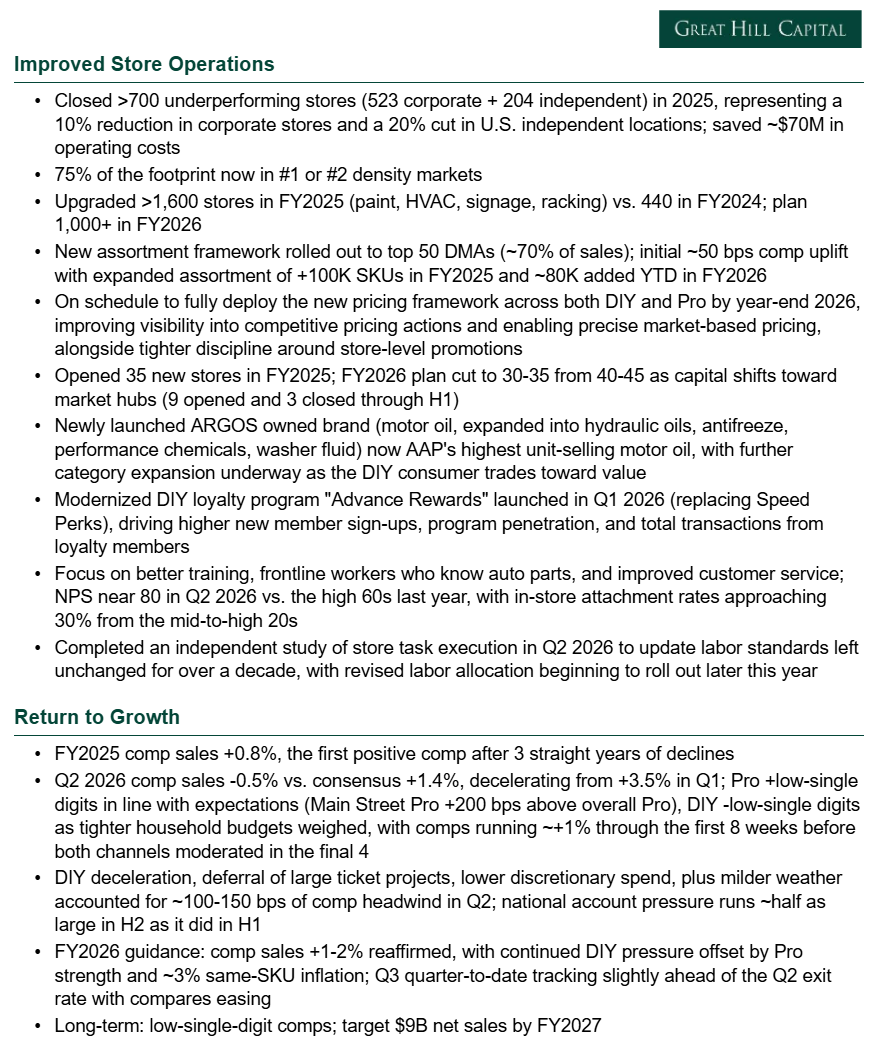
For newer readers, here’s a quick overview of the key drivers behind our thesis on Advance Auto Parts, the long-neglected auto parts retailer undergoing a back-to-basics turnaround with substantial margin recovery still ahead:
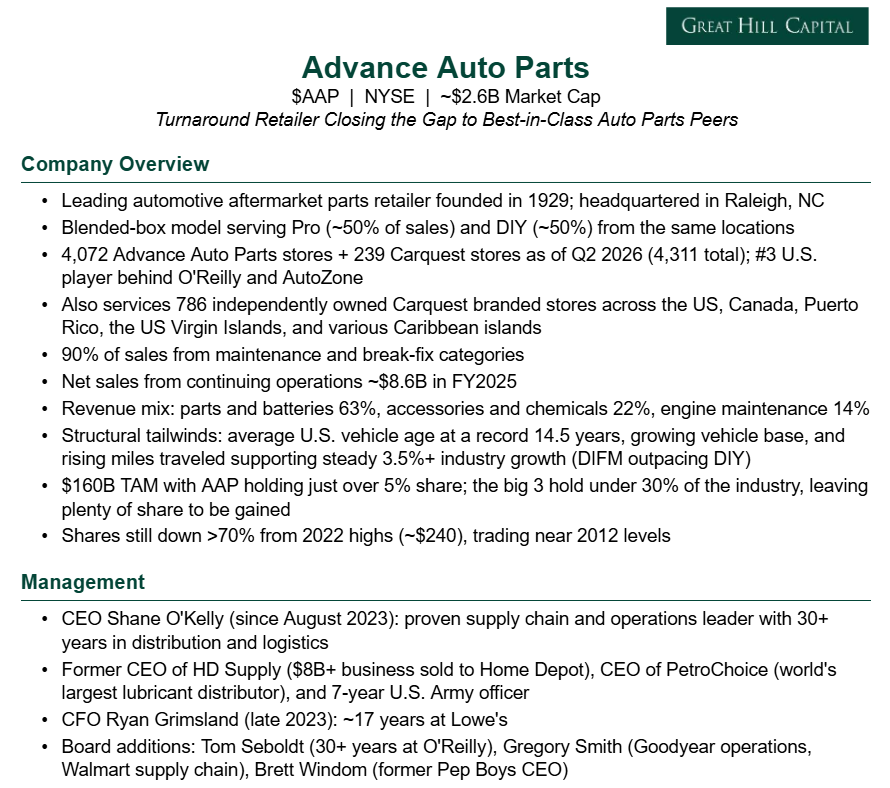
Advance hit a pothole. The road ahead is unchanged.
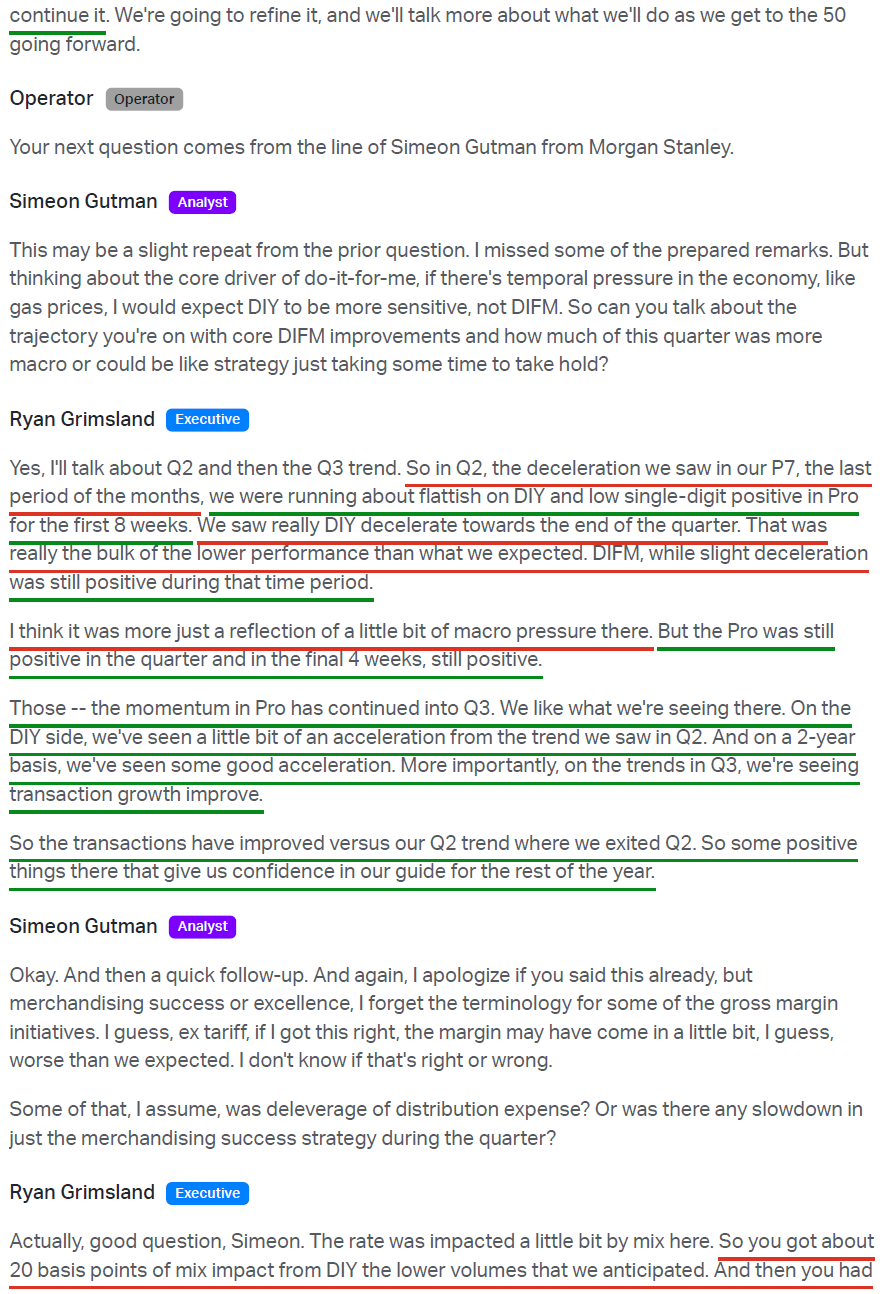
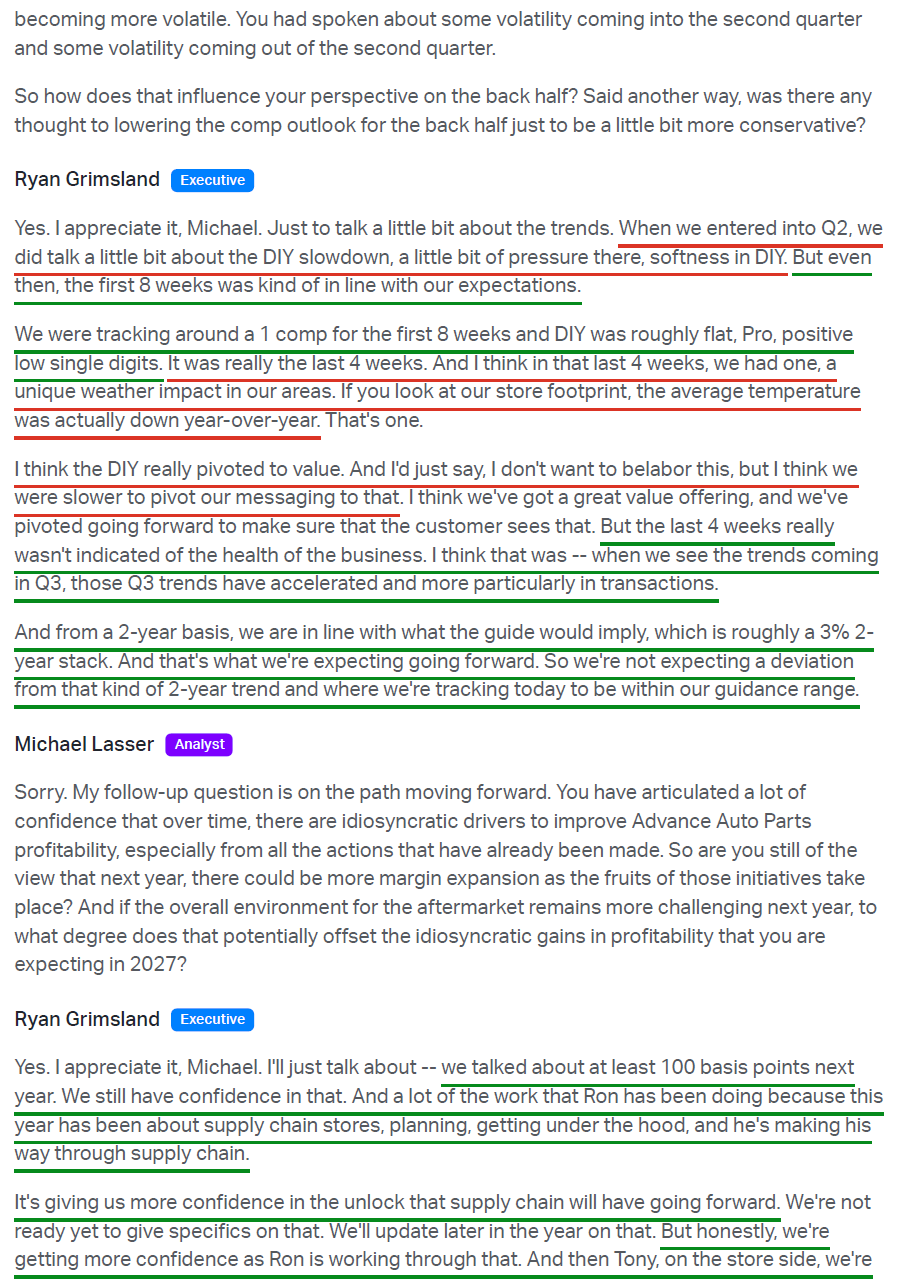
The company posted its first negative comp in over a year, with same-store sales falling 0.5% against consensus expectations for a 1.4% increase, breaking a four-quarter streak of positive growth and marking a step back from last quarter’s +3.5%. DIY was the primary culprit, with sales flat through the first eight weeks before declining low single digits in the final four as customers deferred larger-ticket repairs, creating a ~100 to 150 bps comp headwind.
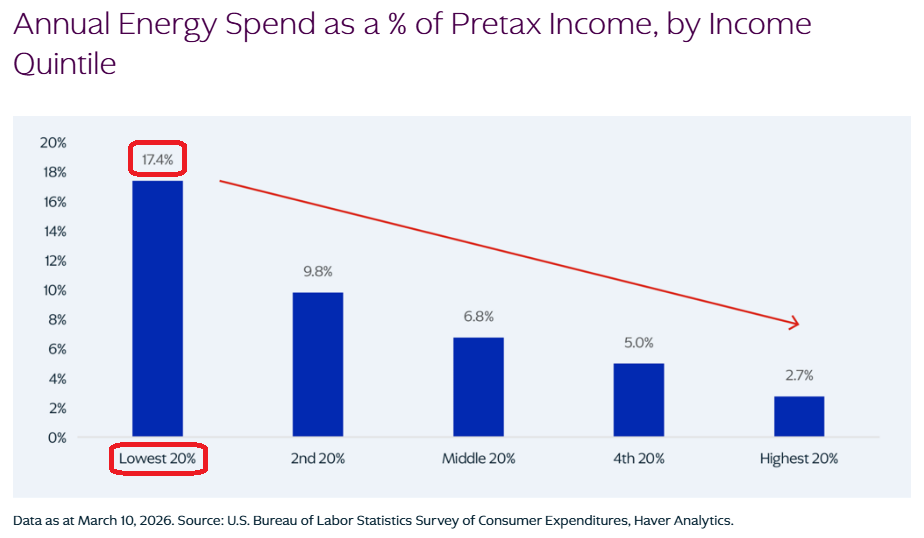
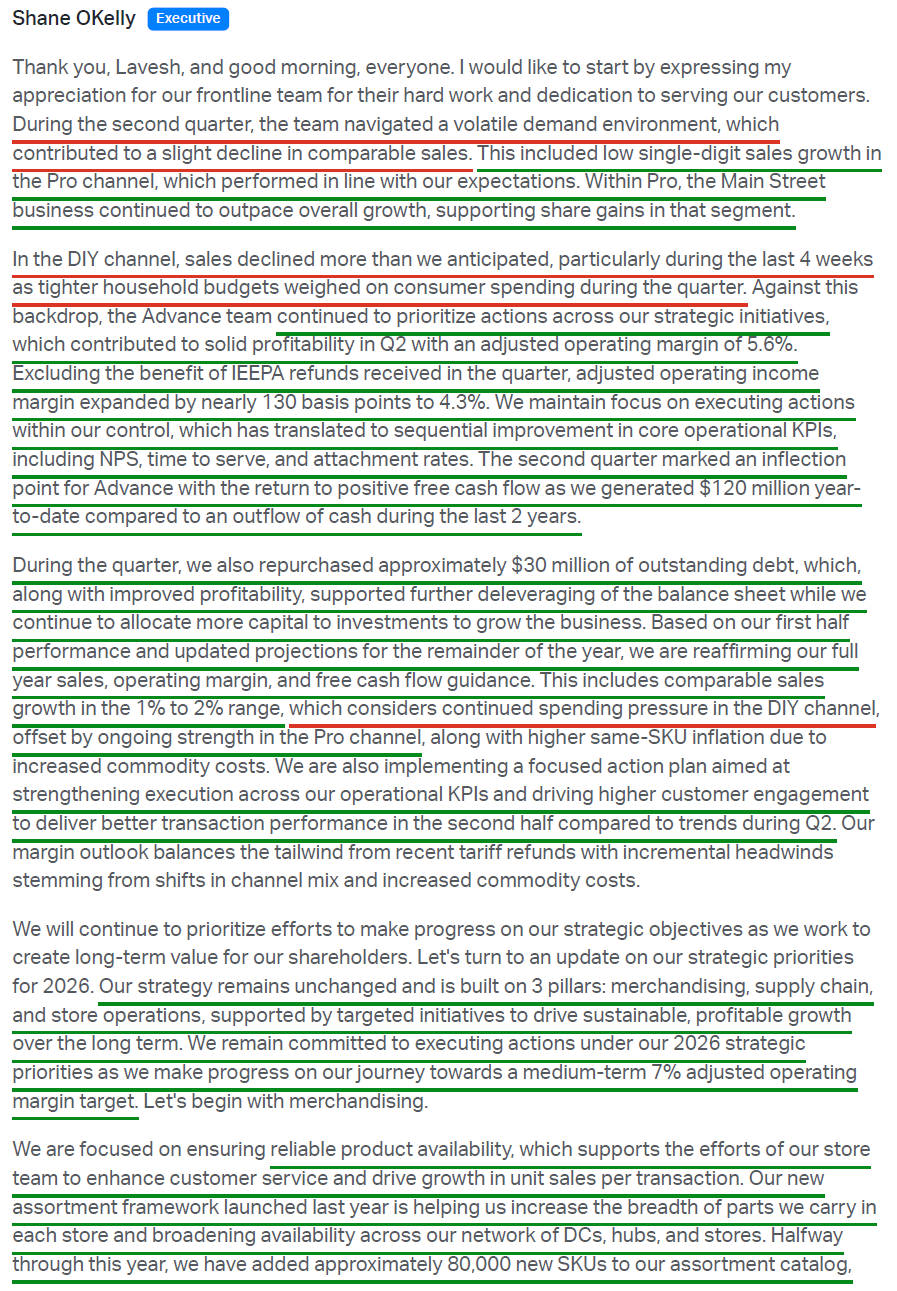
That weakness shouldn’t come as much of a surprise. It’s no secret that Advance caters to the lower- and middle-income consumer, and with DIY accounting for ~half of the business, pressure on that customer shows up immediately in the comp. Shane O’Kelly did not sugarcoat it on the call, describing a cohort that has been “a very stressed consumer” whose budgets “have continued to get tighter” as fuel prices have risen. This is hardly the first time we have heard this message this earnings season, whether from industry peer O’Reilly (ORLY) or across the broader consumer space, from retail to restaurants. A lot of that comes down to pain at the pump: for the bottom 20% of earners, energy eats up 17.4% of total income, the bulk of which is gasoline, versus just 2.7% at the top.
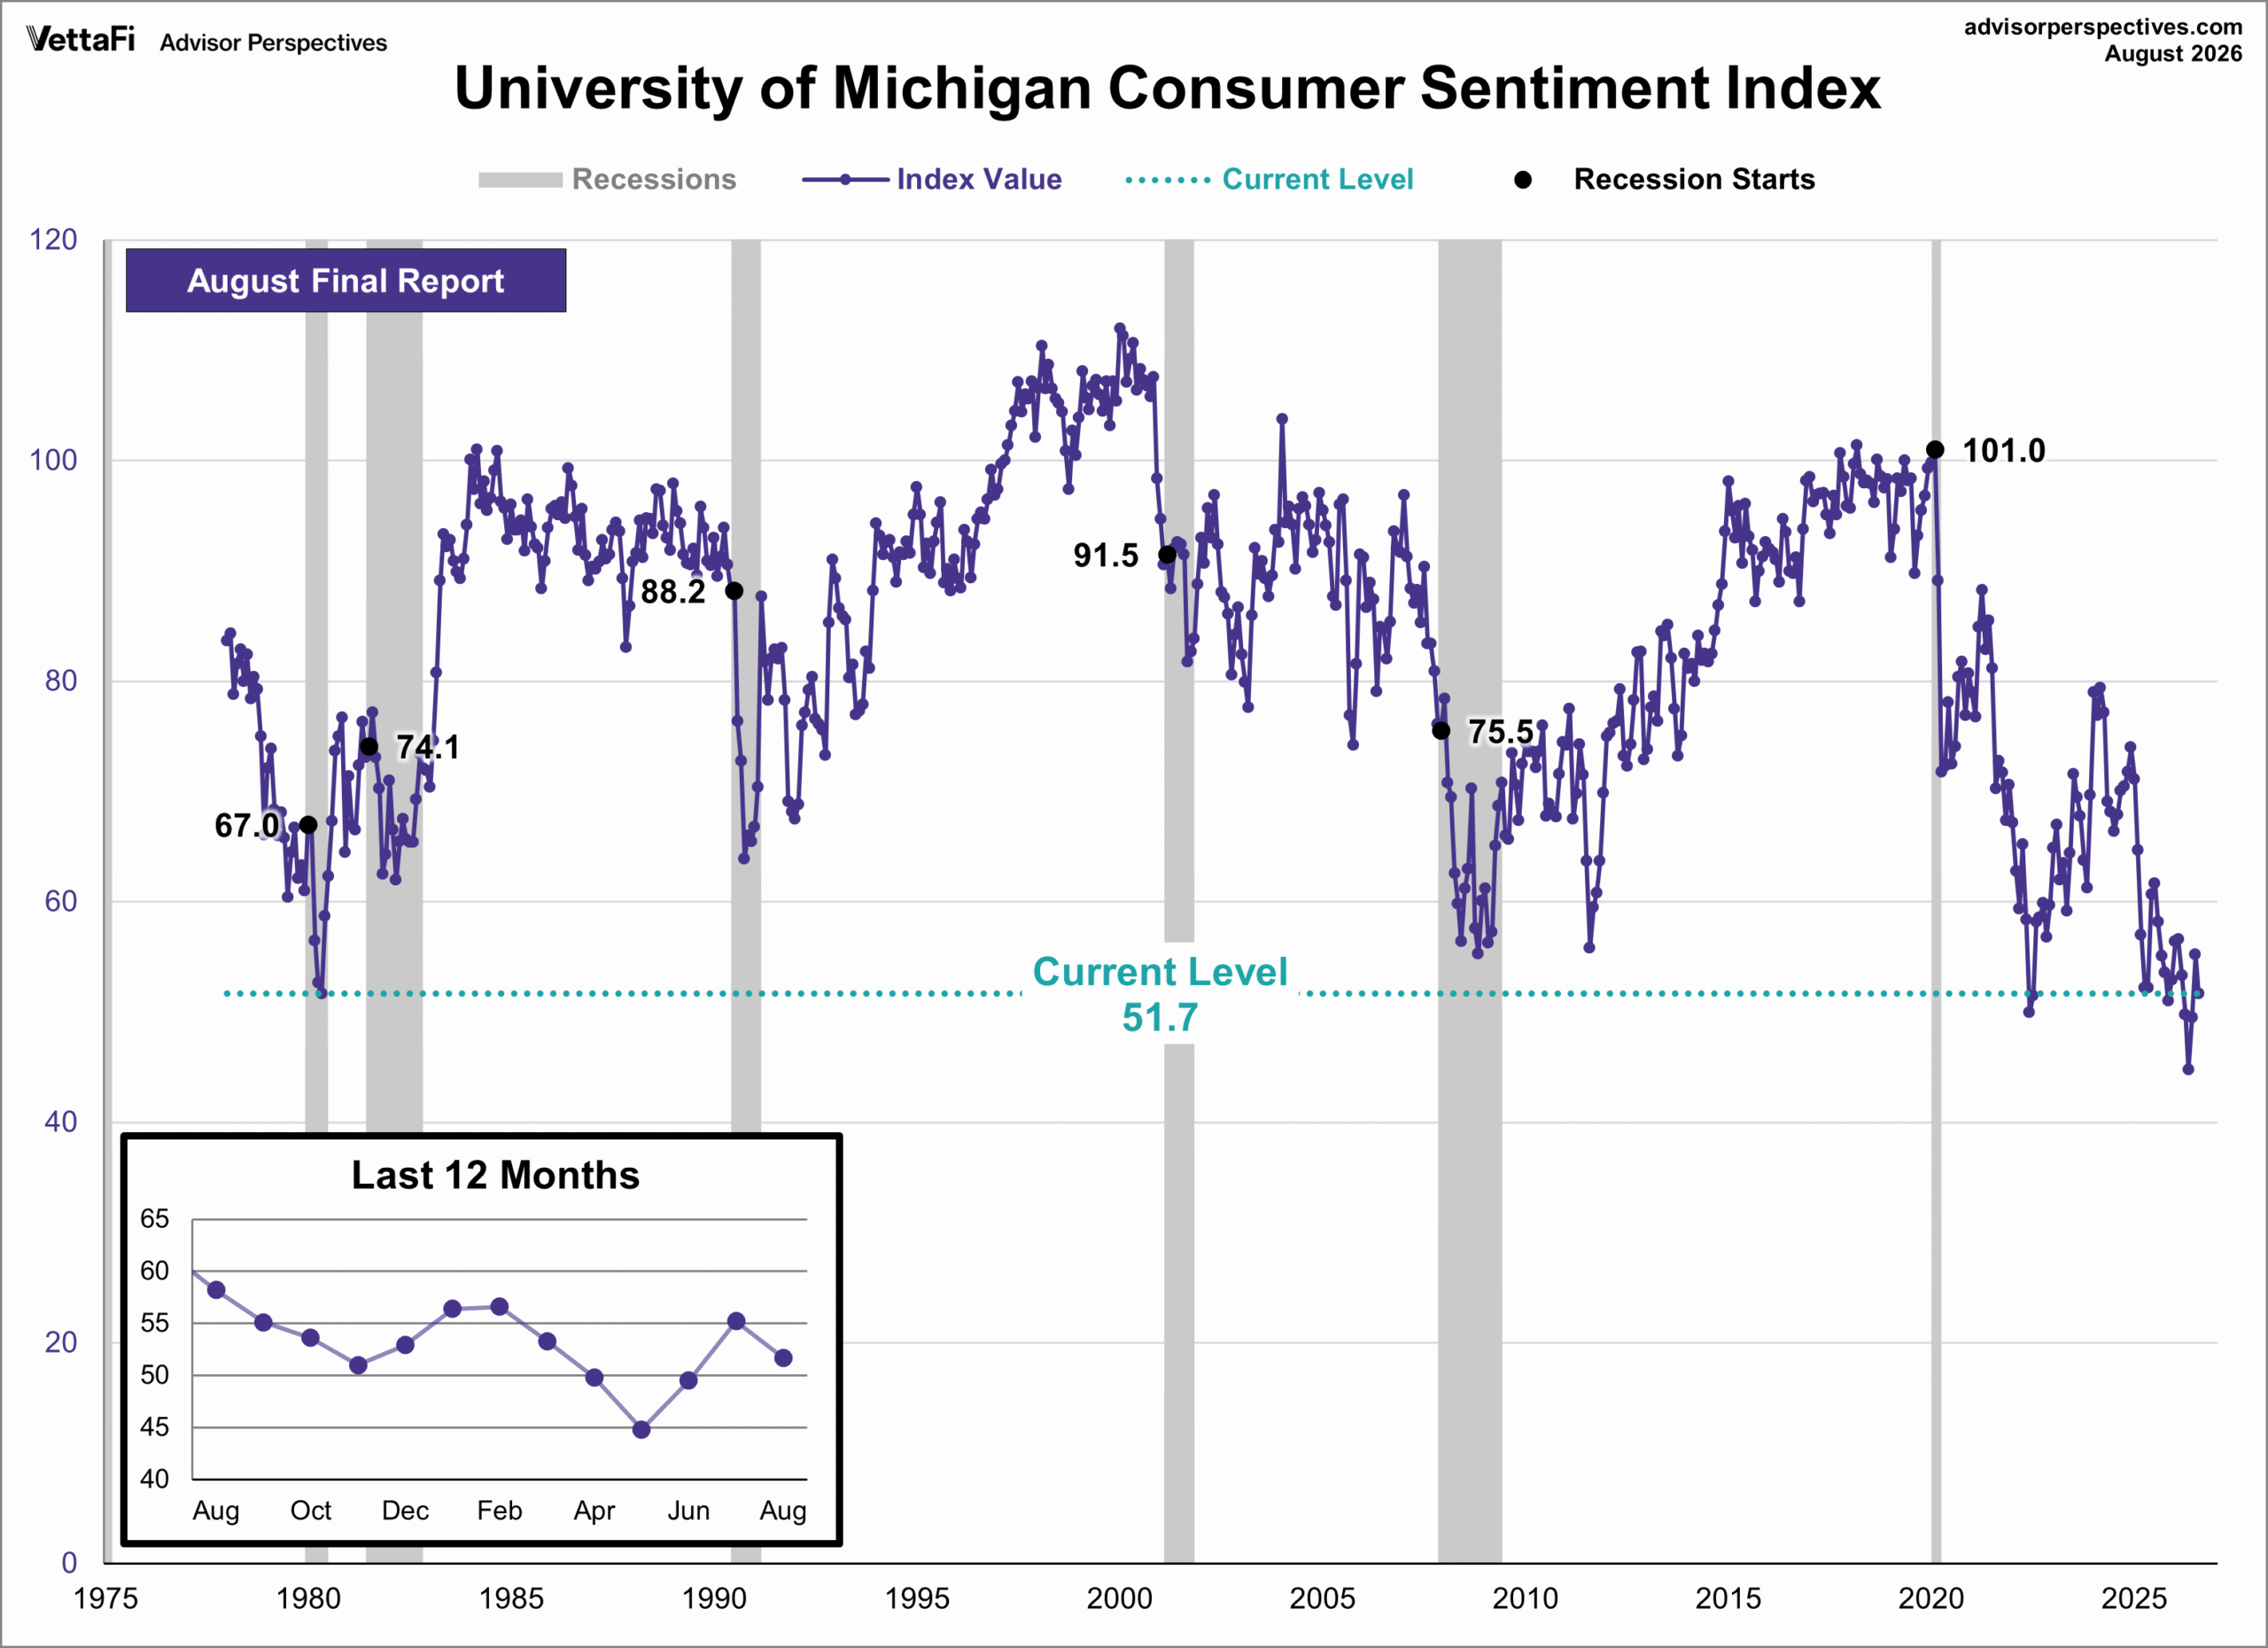
Combine that with consumer sentiment already sitting at washed-out extremes, with the UMich index finishing August at 51.7 and below the 1st percentile of its entire history (times to be BUYERS, not SELLERS), and the pressure on DIY is hardly surprising.
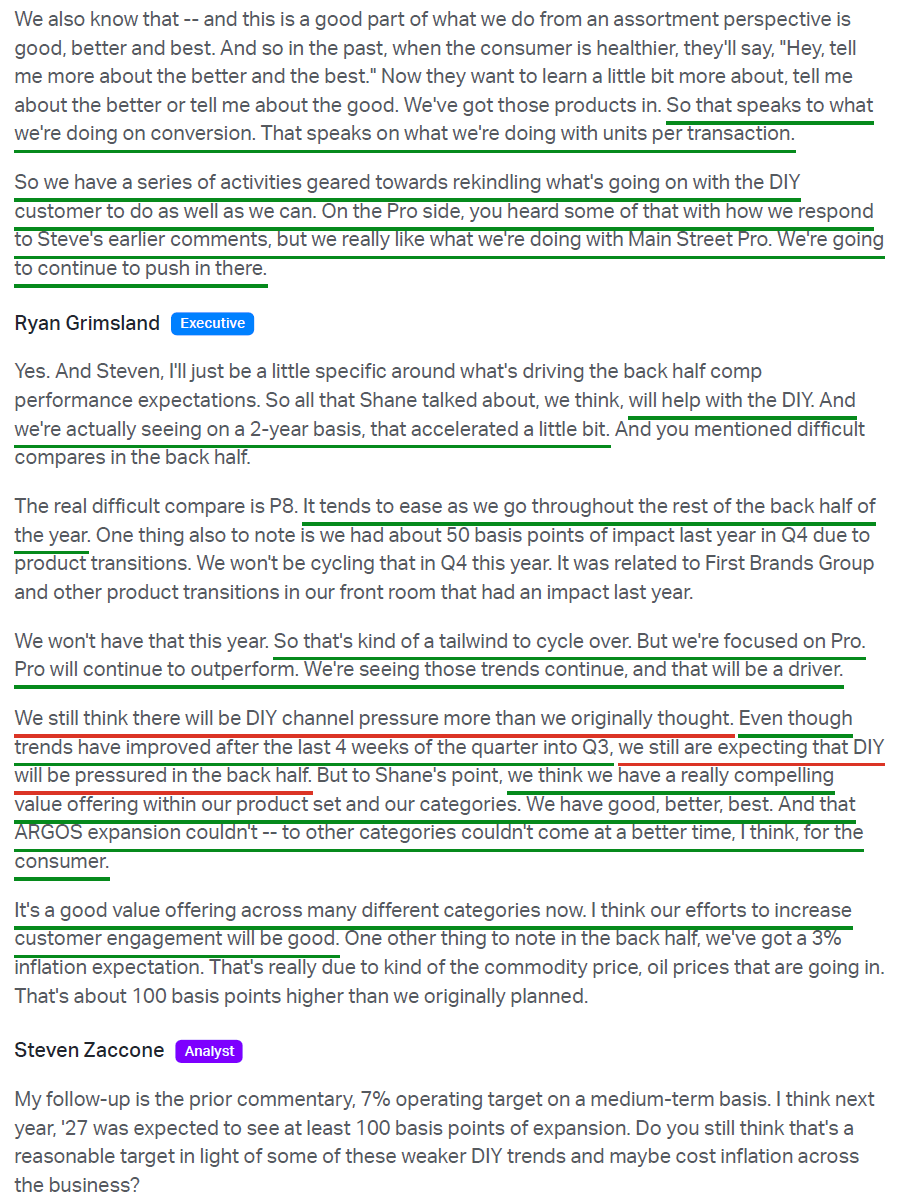
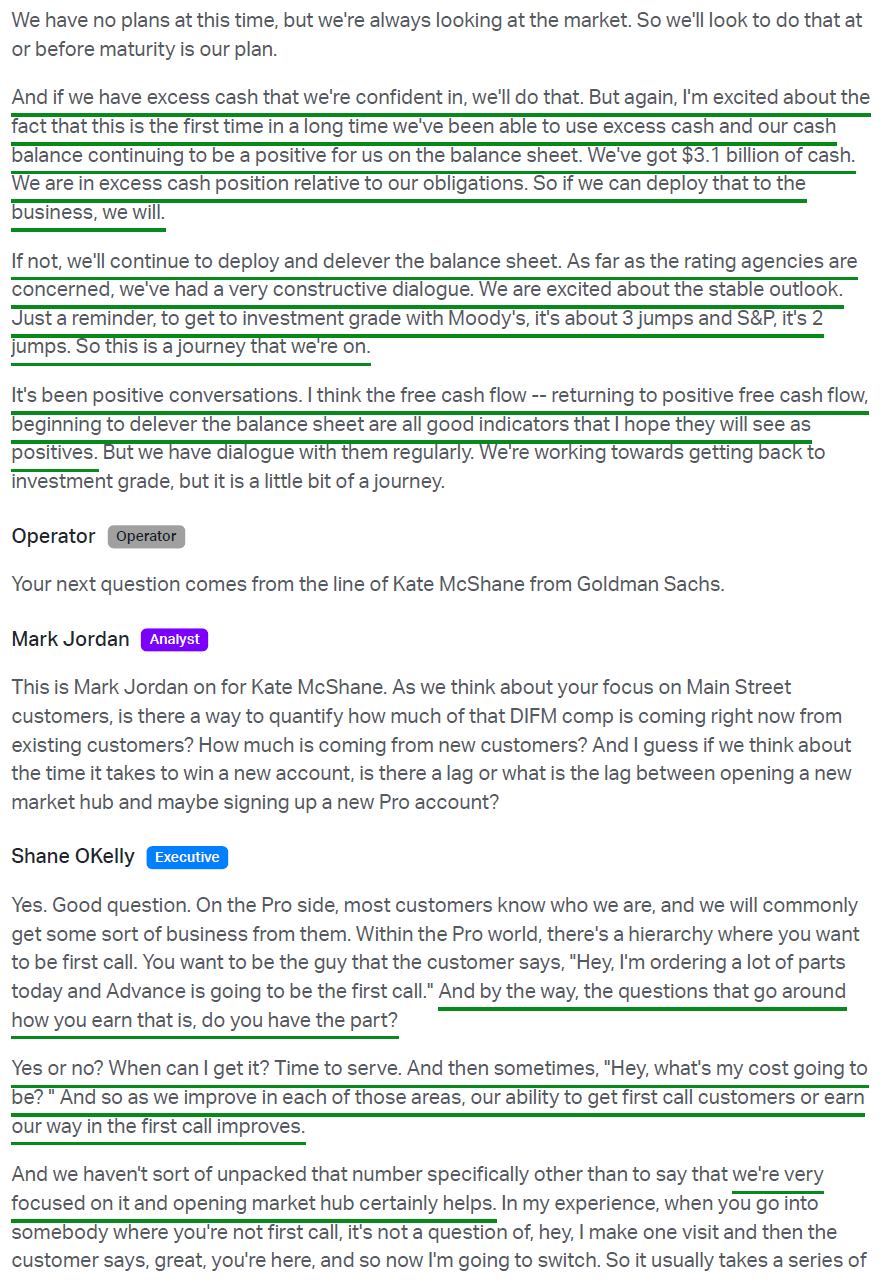
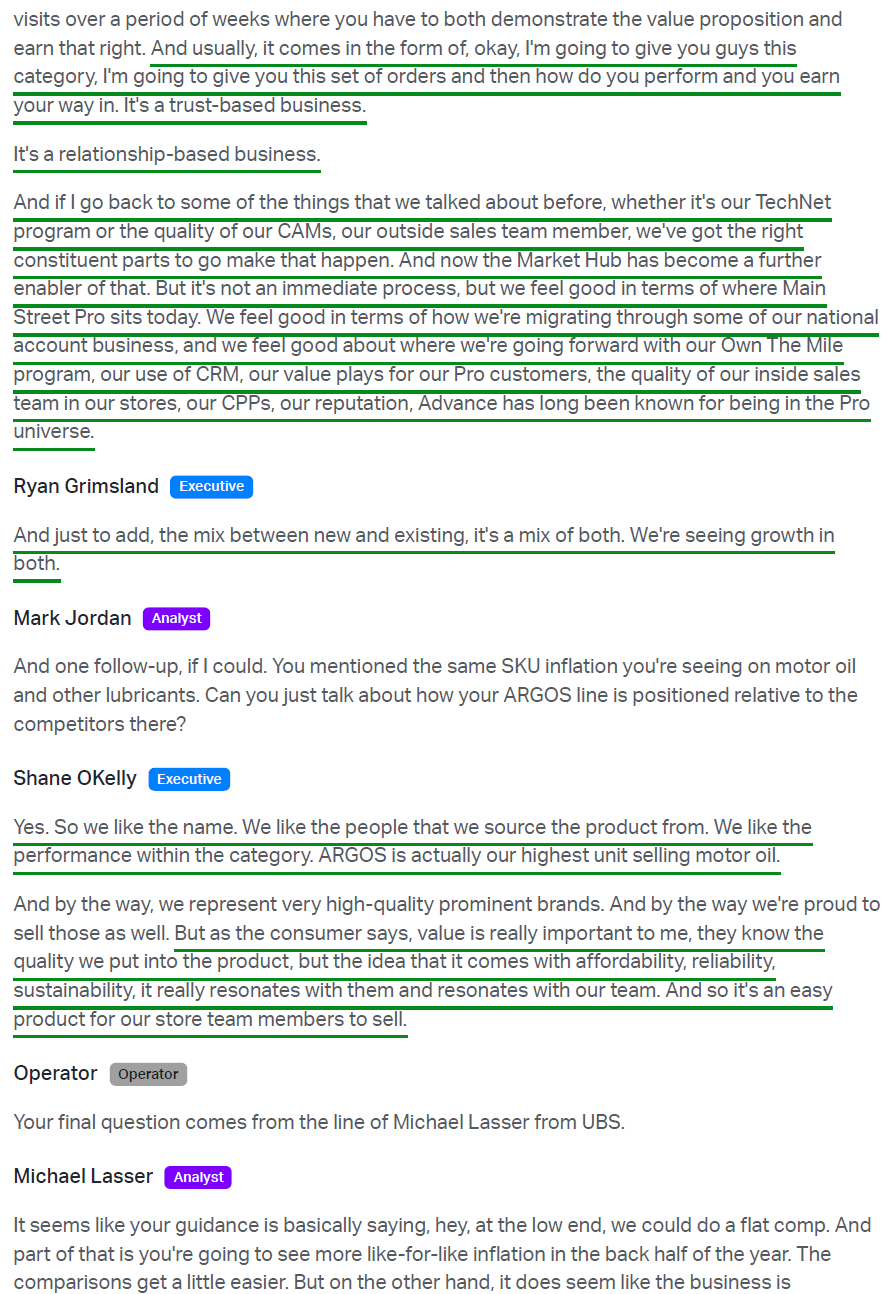
Management has responded by leaning into value, using the Advance Rewards loyalty program, the ARGOS owned brand (already the company’s highest unit-selling motor oil), and a good-better-best assortment built for a customer trading down. Encouragingly, DIY trends have improved on a two-year basis through the first weeks of Q3.
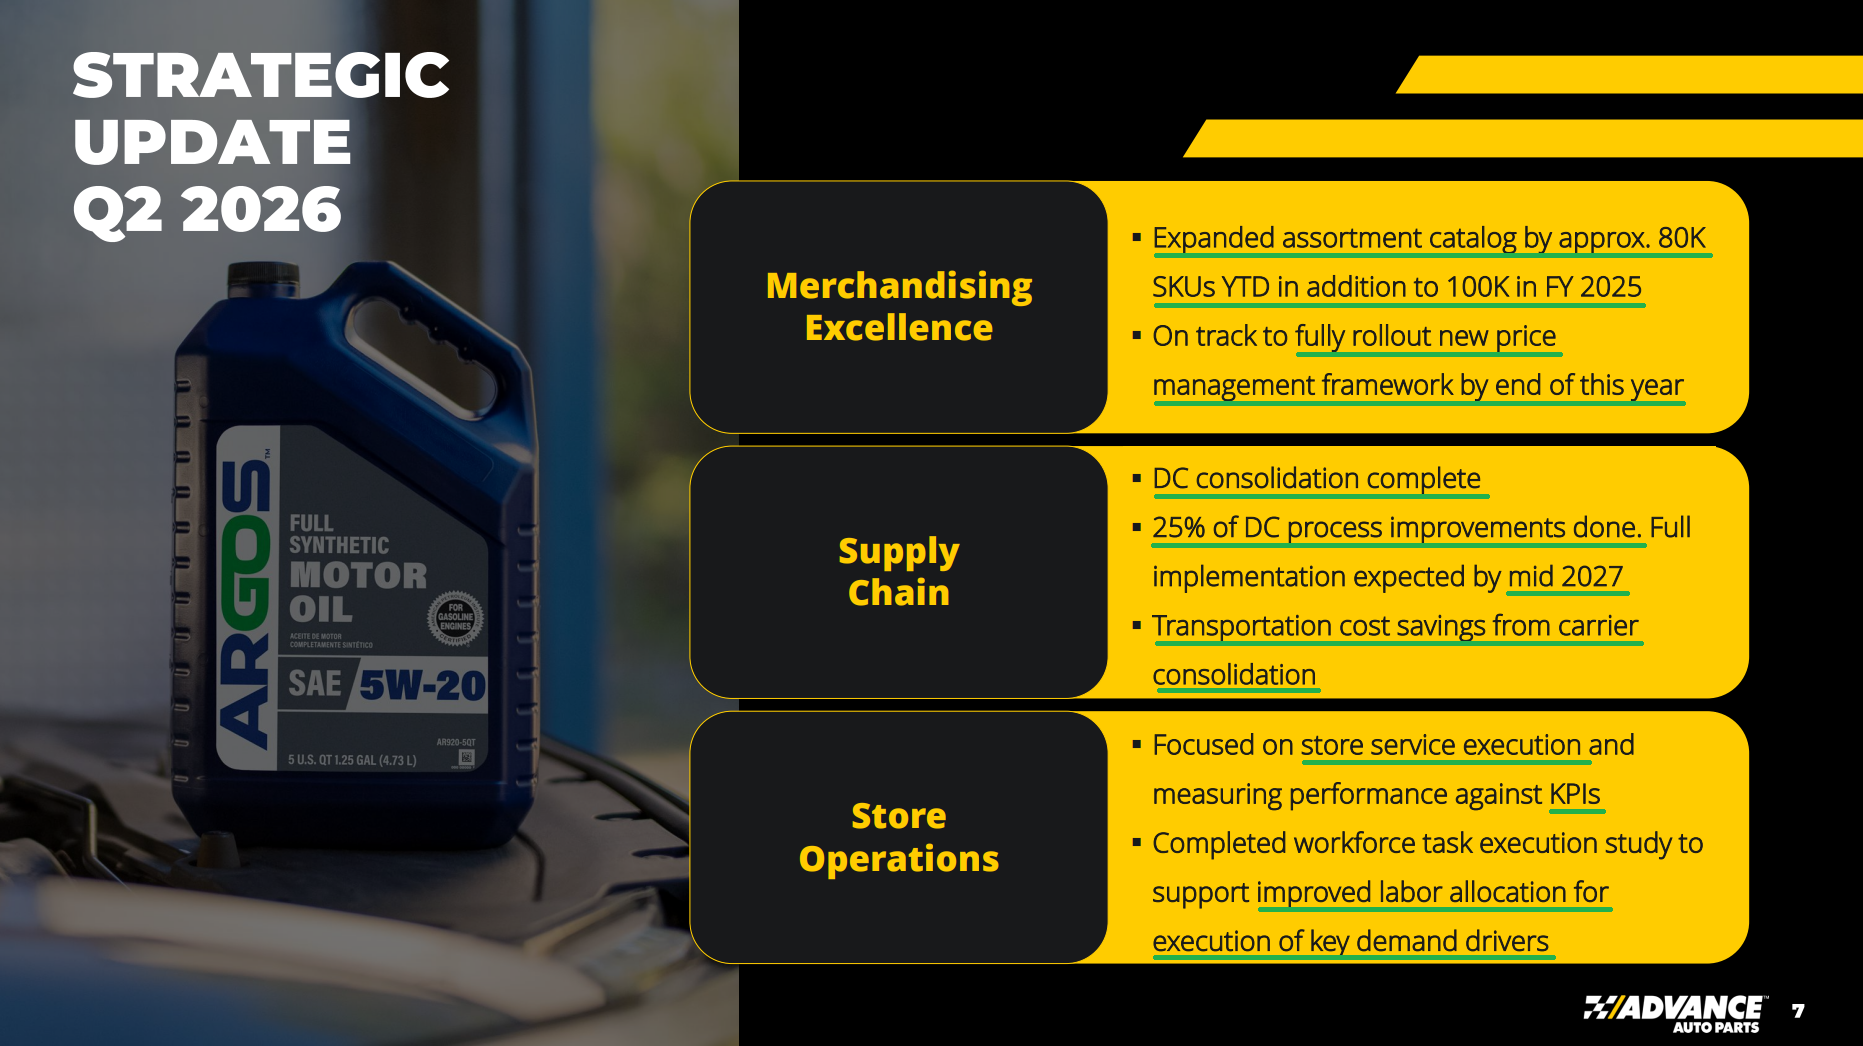
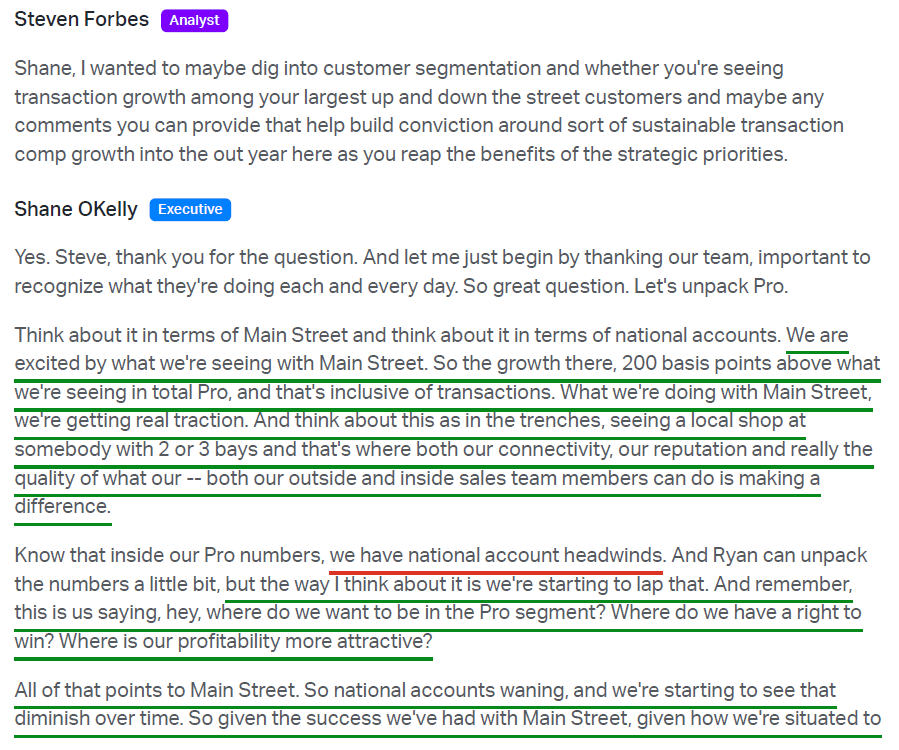
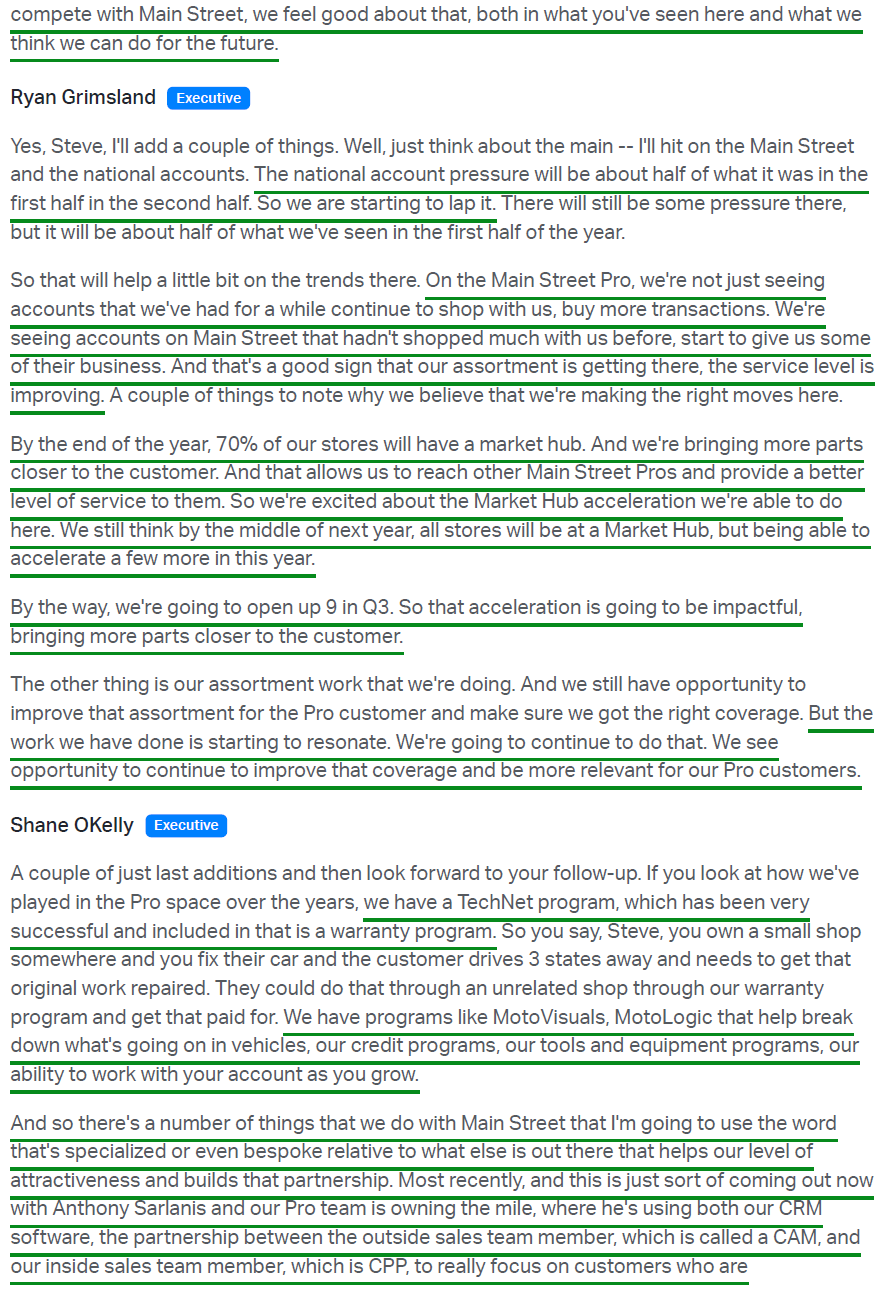
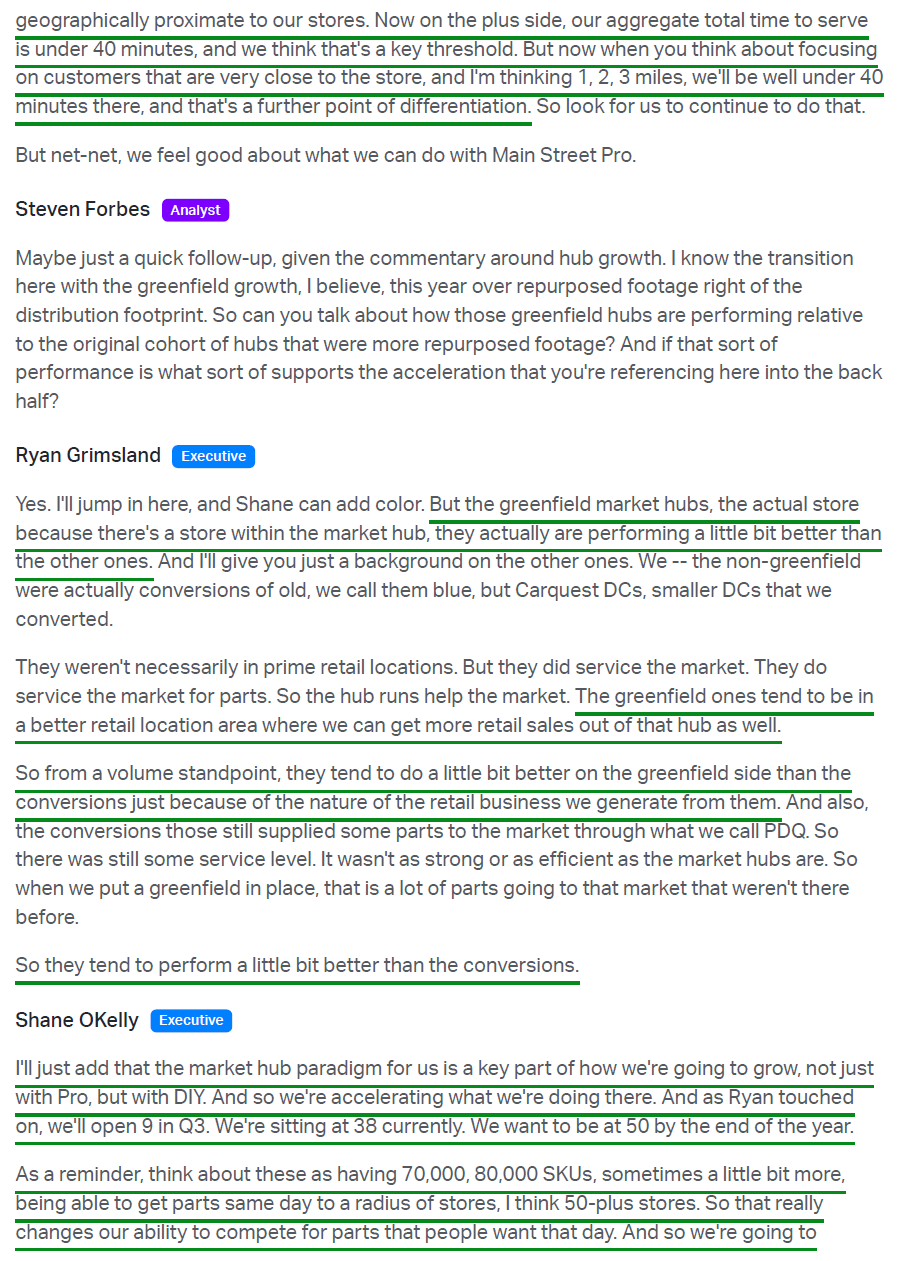
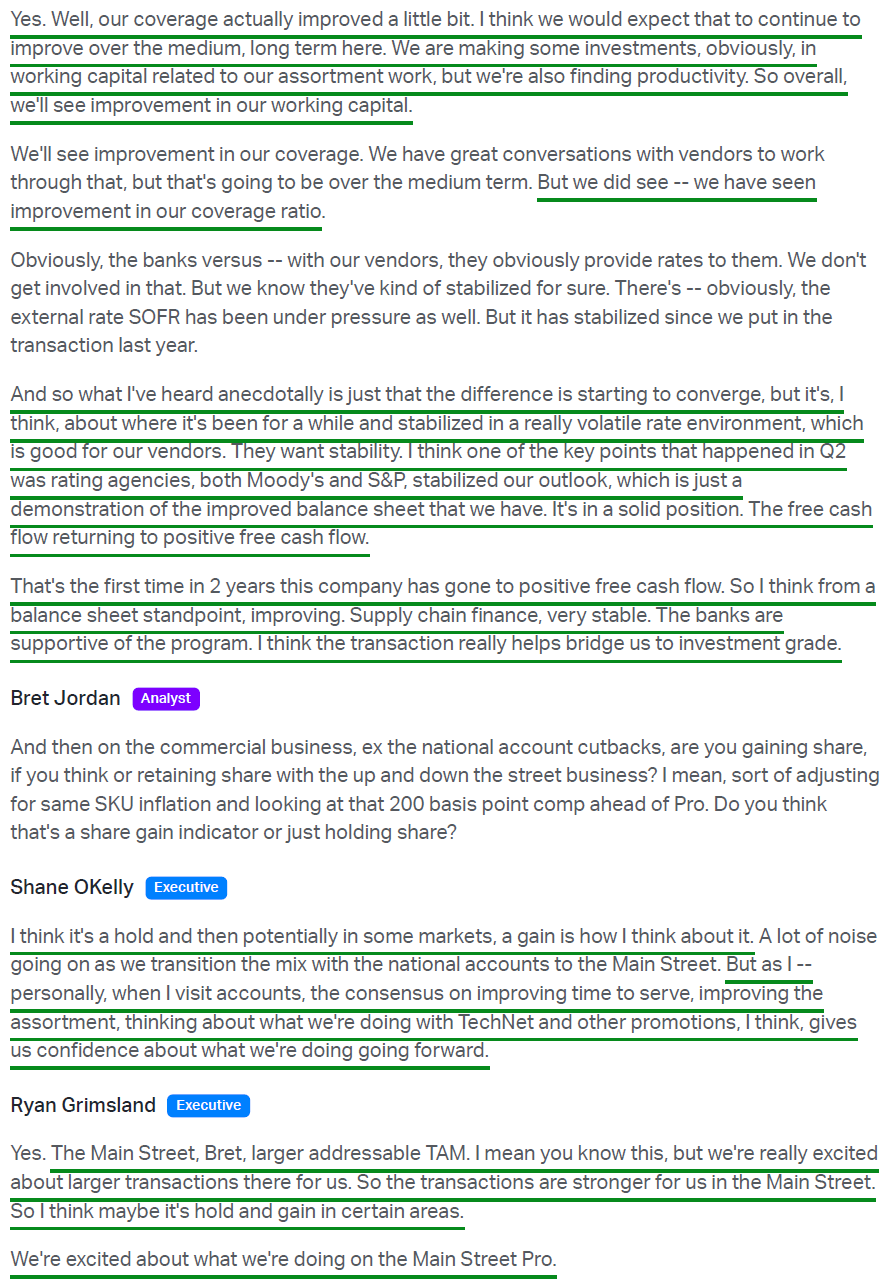
Pro, the other half of the business, told a very different story, delivering low-single-digit growth and staying positive throughout the quarter. Main Street Pro, the local shop with two or three bays, is management’s #1 focus and represents both the larger TAM and the better margin profile. It outpaced overall Pro by more than 200 bps, with growth coming from existing accounts ordering more frequently and from shops that had never meaningfully bought from Advance beginning to hand over business. That is what happens when you add 100,000 SKUs to the catalog in 2025, another 80,000 in the first half of this year, and support it with delivery times that held under 40 minutes every week of the quarter.
Keep in mind, the reported Pro number continues to understate the underlying strength, as management is deliberately walking away from lower-margin national accounts to concentrate resources on Main Street. That self-inflicted headwind runs ~half as large in the back half as it did in the first as comps are lapped.
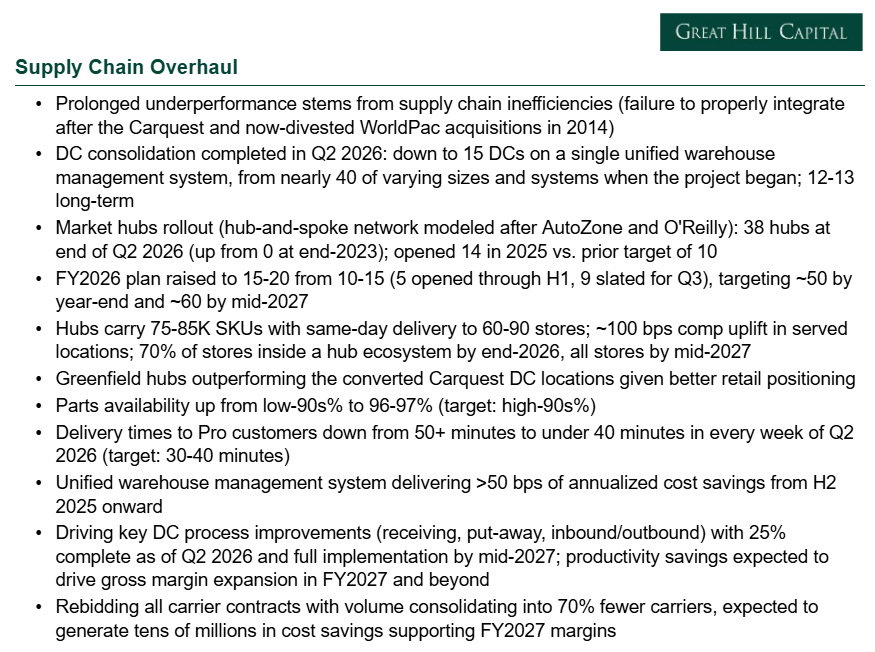
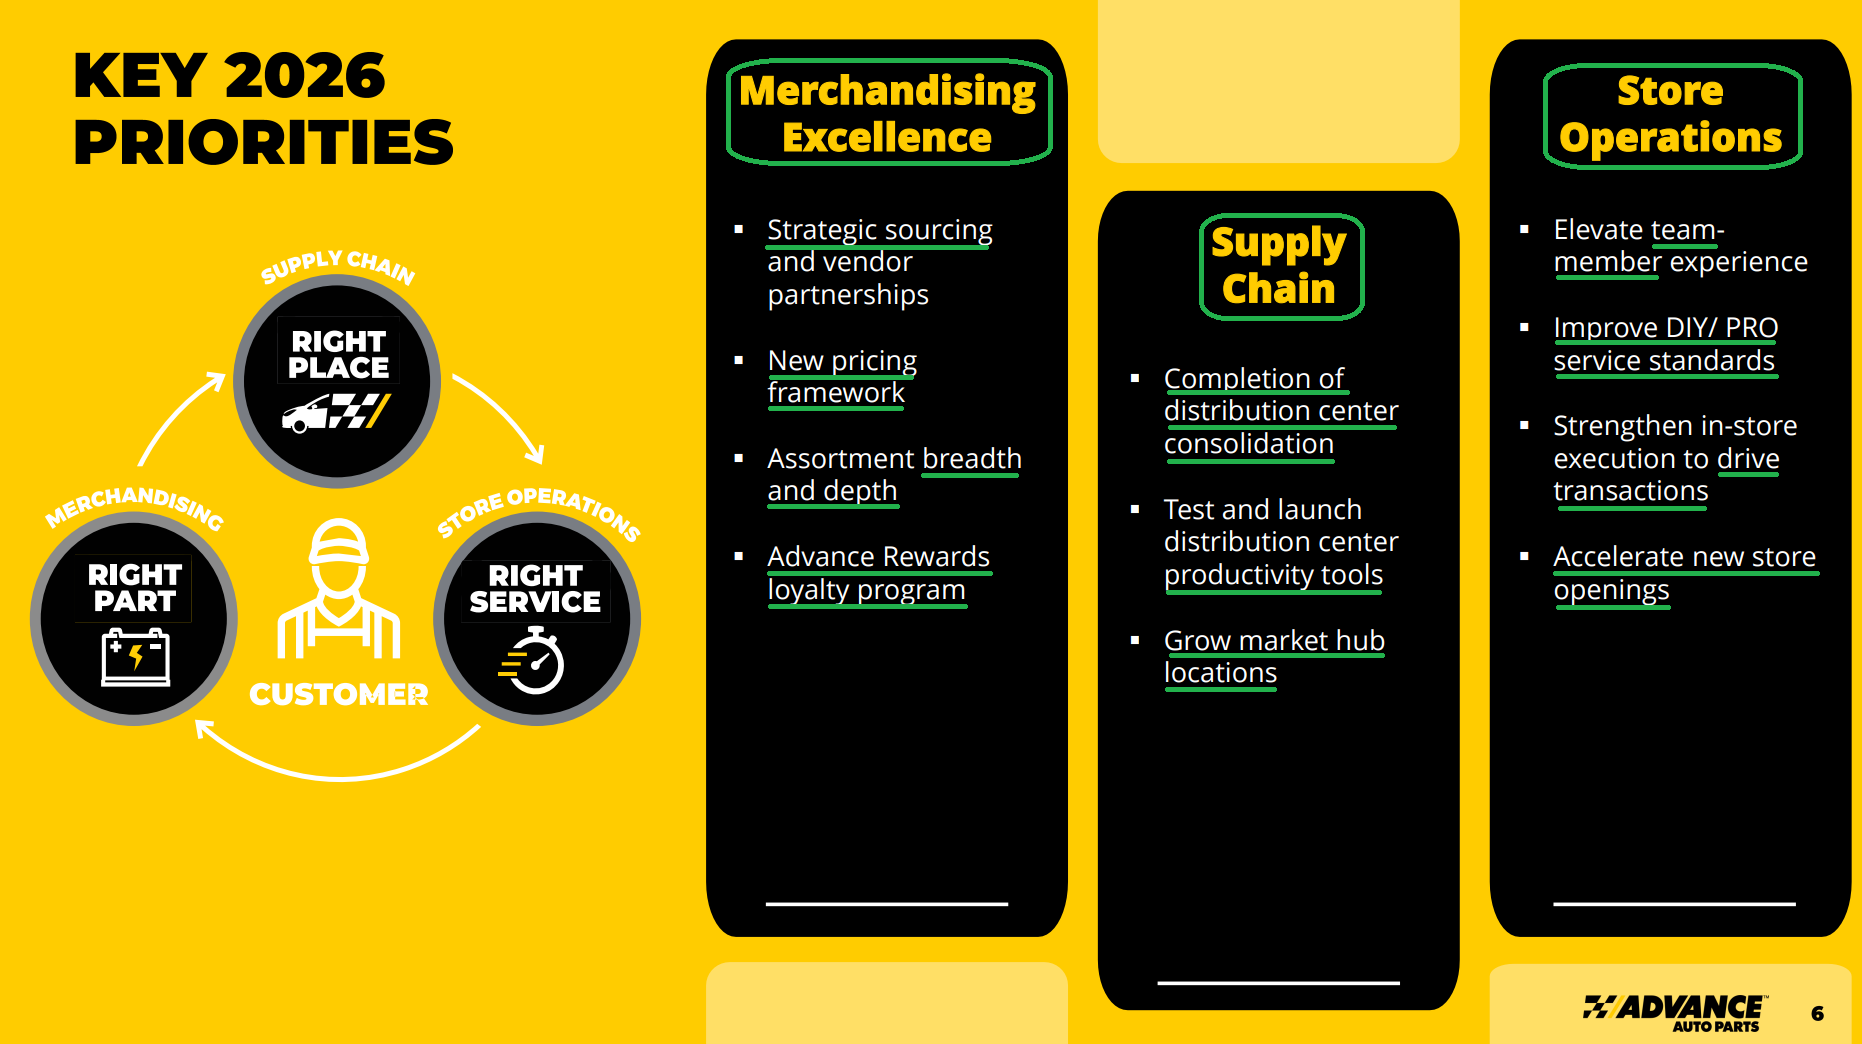
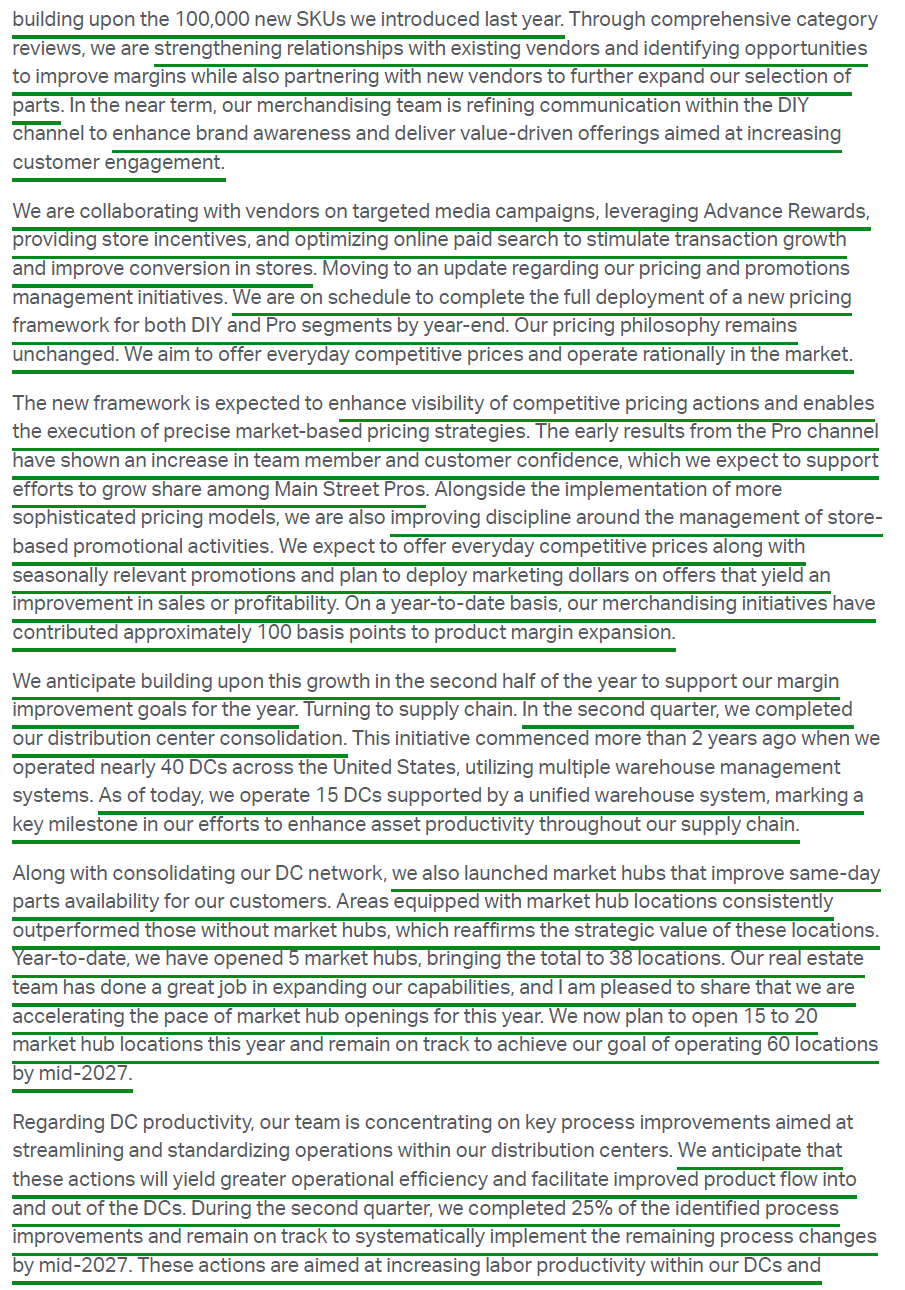
But the bigger story, at least in our view, had nothing to do with the consumer at all. The core initiative O’Kelly was brought in to fix was a supply chain that had failed at the most basic job in this business: having the right part in the right place at the right time. This quarter, he finished what he was hired to do. The distribution center consolidation is complete, taking a bloated network of nearly 40 facilities running multiple warehouse management systems down to 15 operating on a single unified platform. It was a two-year cleanup that required a lot of heavy lifting, and it is now in the rearview mirror.
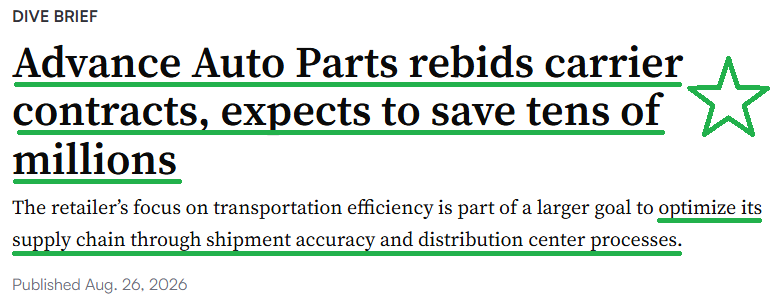
Attention now shifts to productivity inside those facilities, where 25% of identified process improvements are complete, with the balance arriving by mid-2027. Management is also rebidding every carrier contract and expects to consolidate volume with 70% fewer carriers, worth tens of millions of dollars in savings that should flow straight to 2027 margins.
Alongside the DC consolidation, the hub network is accelerating faster than initially planned as Advance replicates the successful hub-and-spoke model that best-in-class peers O’Reilly and AutoZone (AZO) have used for years. The company opened five market hubs in the first half, raised its full-year target to 15 to 20, and plans to open nine more in Q3 alone. Each hub carries 75,000 to 85,000 SKUs and provides same-day delivery to 60 to 90 surrounding stores, with hub markets consistently delivering ~100 bps of comp lift versus those without one. Management expects coverage to reach 70% of the store base by year end and 100% by the middle of next year.
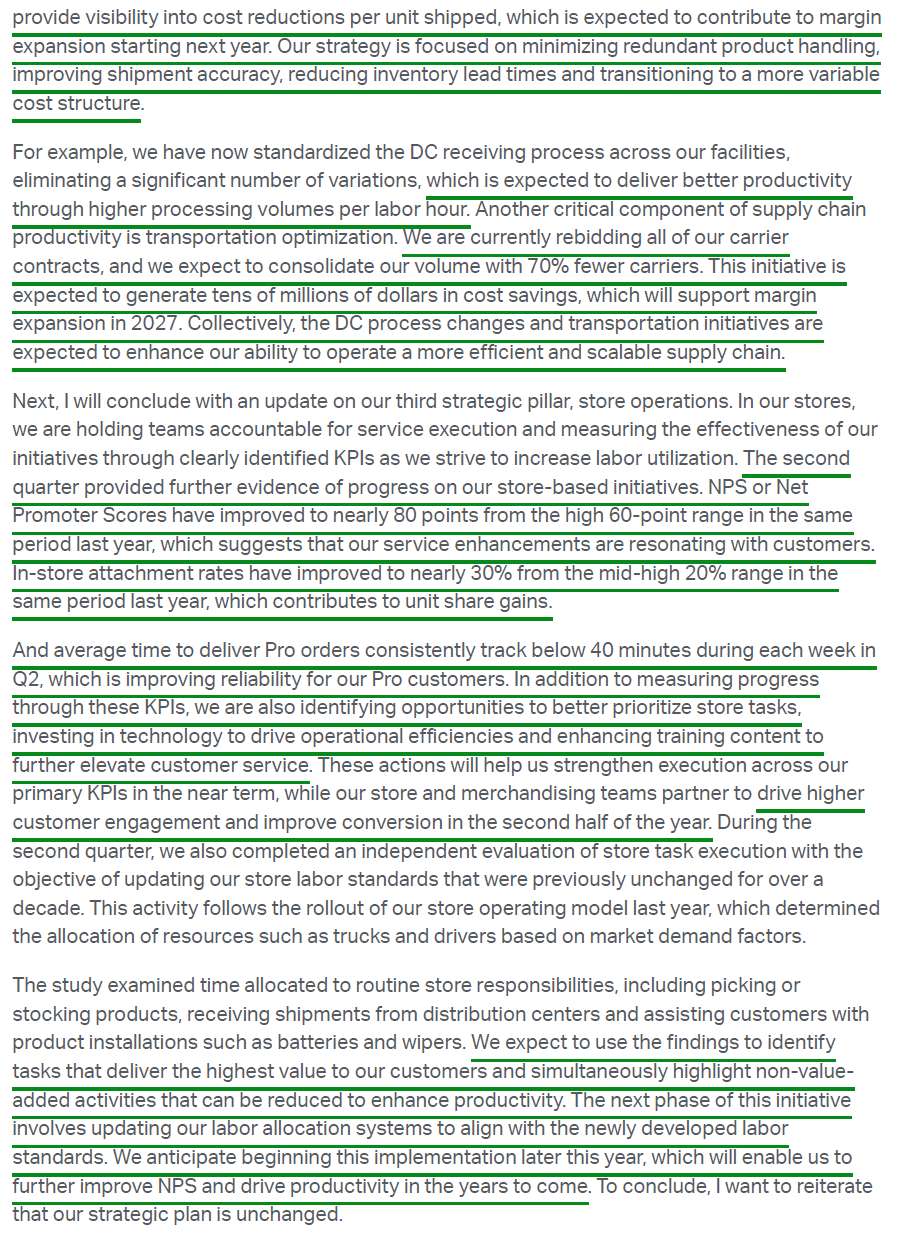
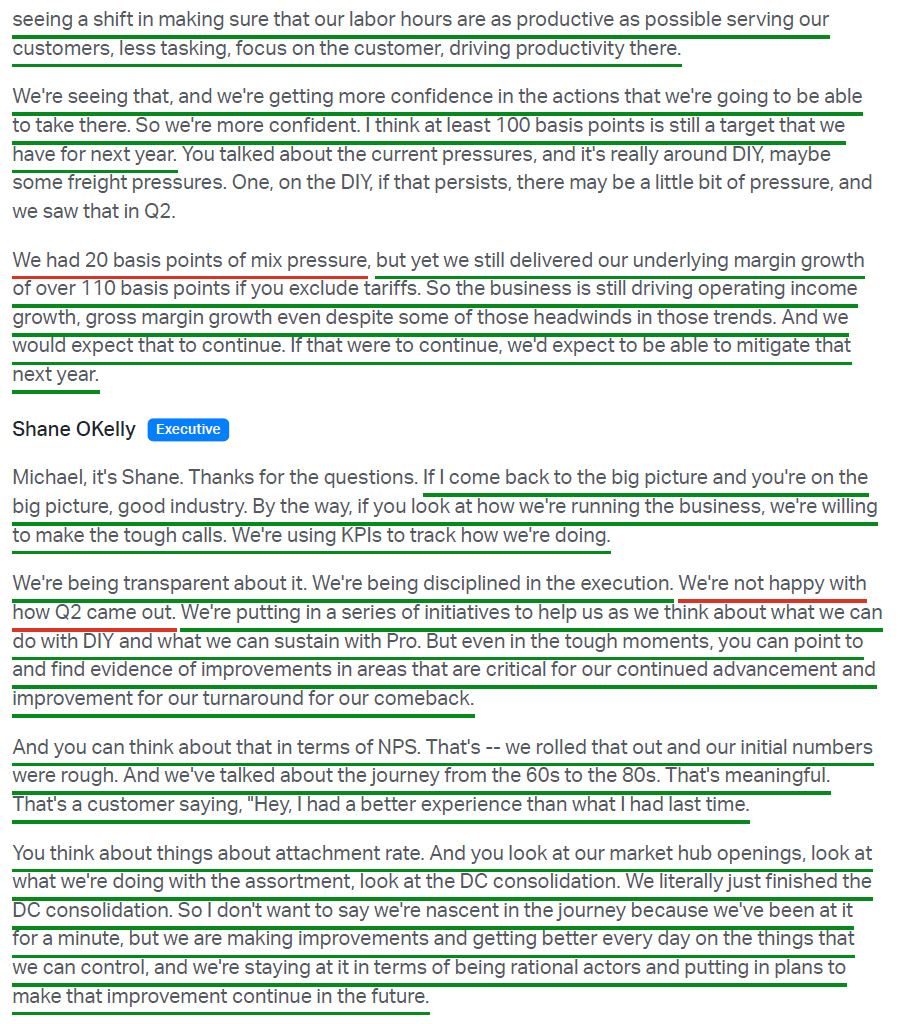
At the store level, AAP continues to see tangible evidence of progress across key internal initiatives. Net Promoter Scores have climbed to nearly 80 from the high 60s a year ago, while in-store attachment rates have approached 30% from the mid-to-high 20s. Much of this traces back to something unglamorous that O’Kelly prioritized early: putting people behind the counter who actually know auto parts and training them properly.
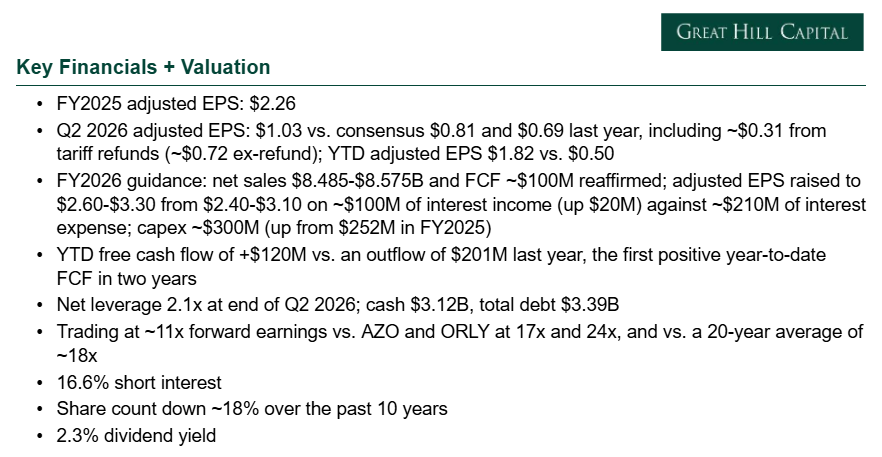
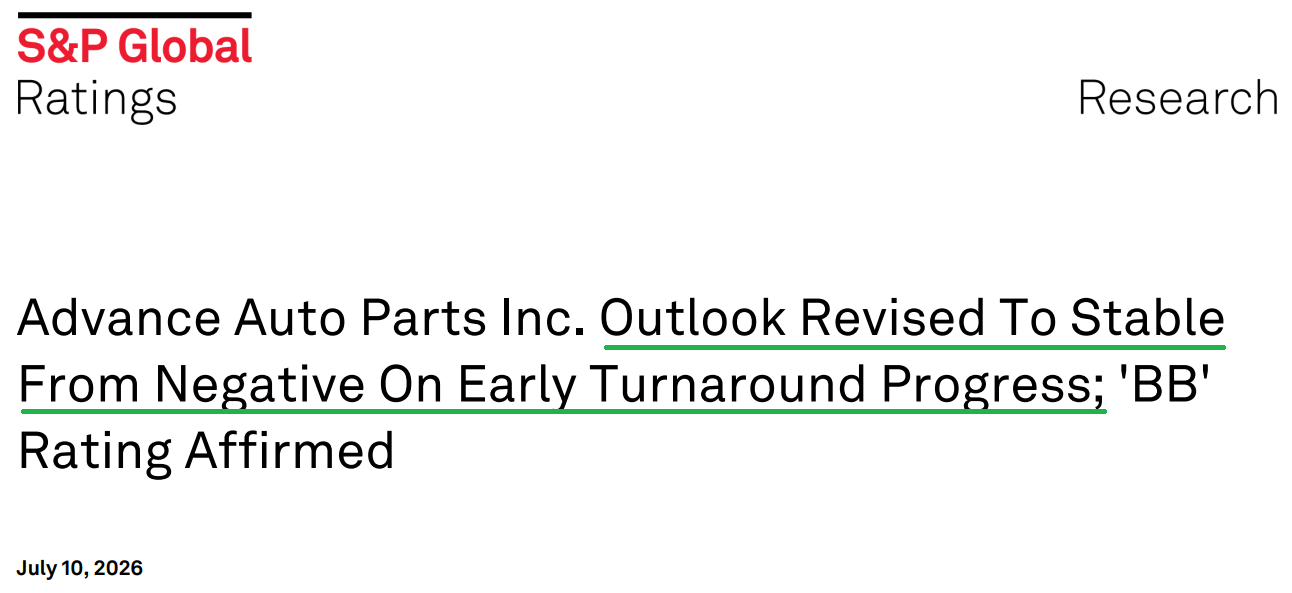
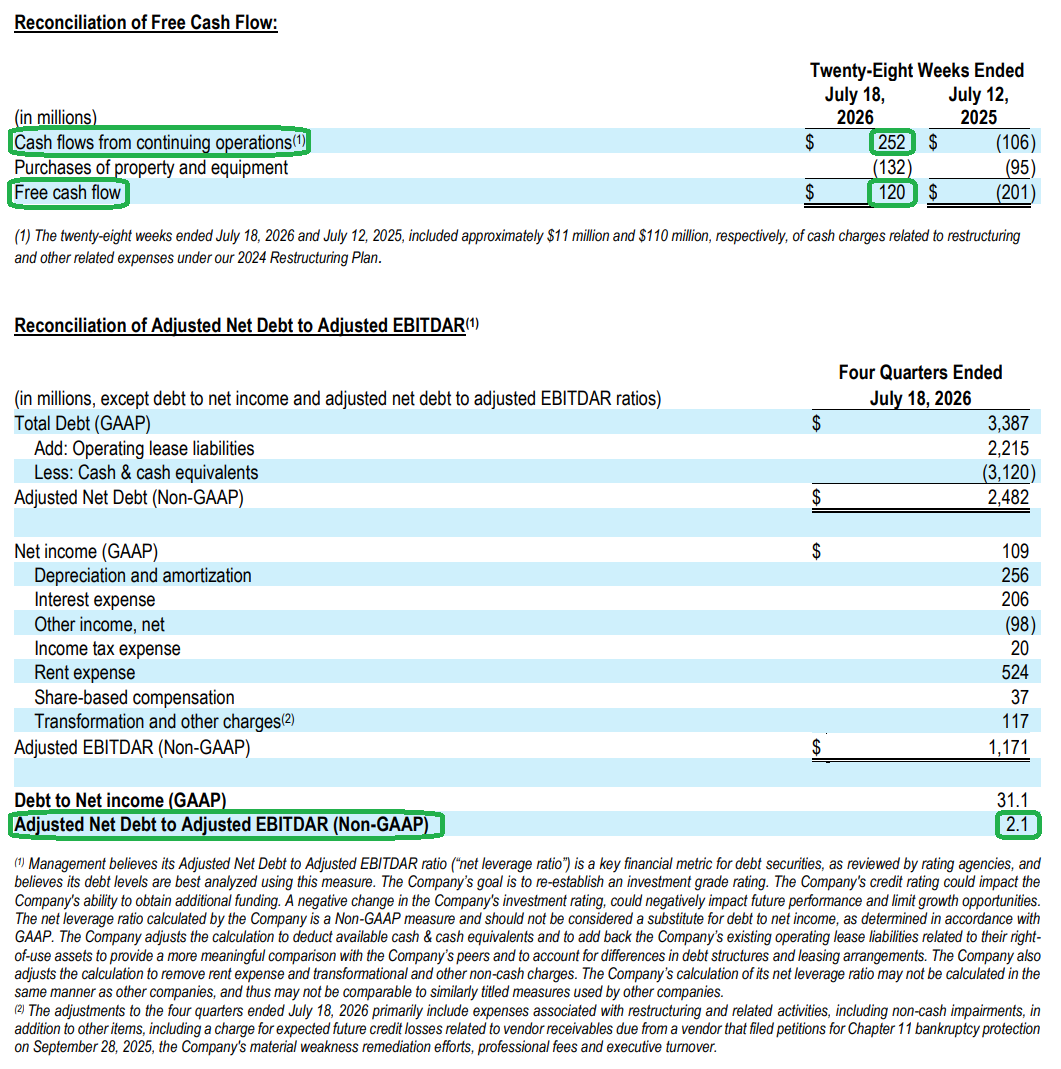
That operational overhaul is already showing up in the financials. Free cash flow turned positive at $120M year to date versus an outflow of $201M last year, with management’s ~$100M full-year target set to deliver Advance’s first full year of positive free cash flow since FY2022. The improved cash generation has translated into a stronger balance sheet, with net leverage falling to 2.1x from 2.4x, comfortably within management’s 2.0x to 2.5x target range. These signs of turnaround progress and improving financials led both Moody’s and S&P to move their outlooks to stable during the quarter, another step in the right direction as Advance works to get back to investment grade.
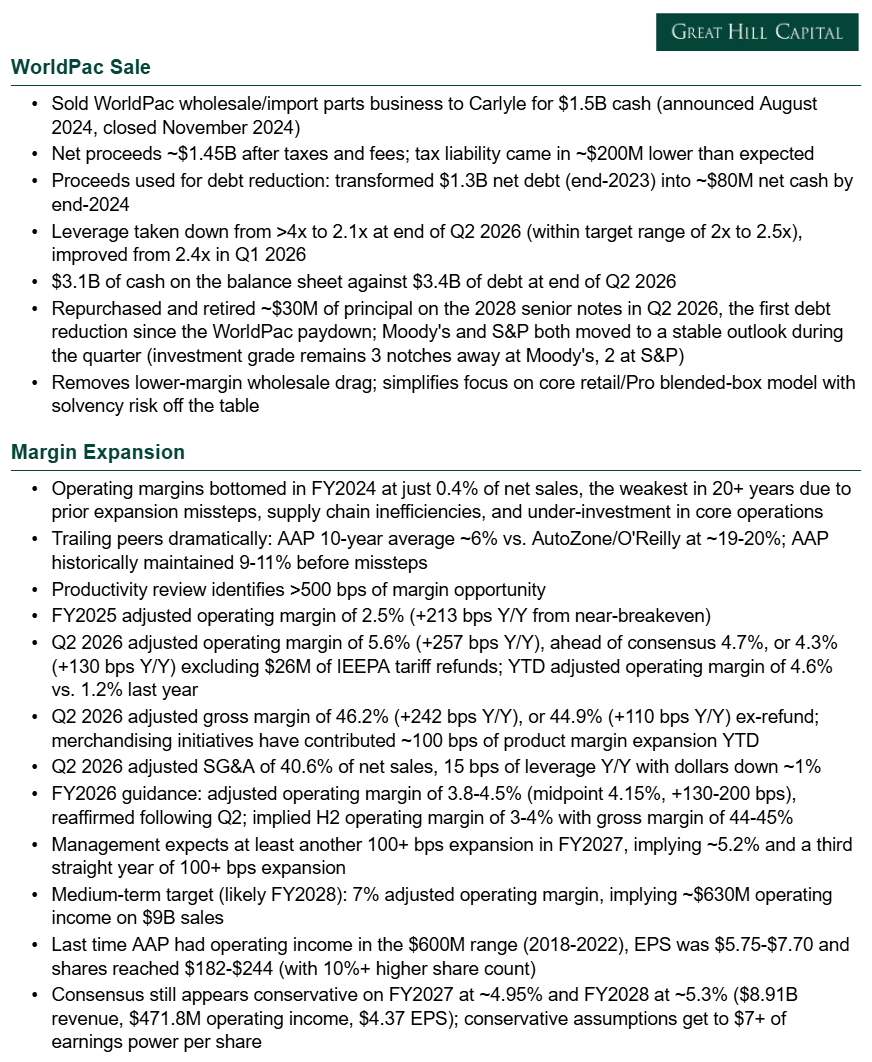
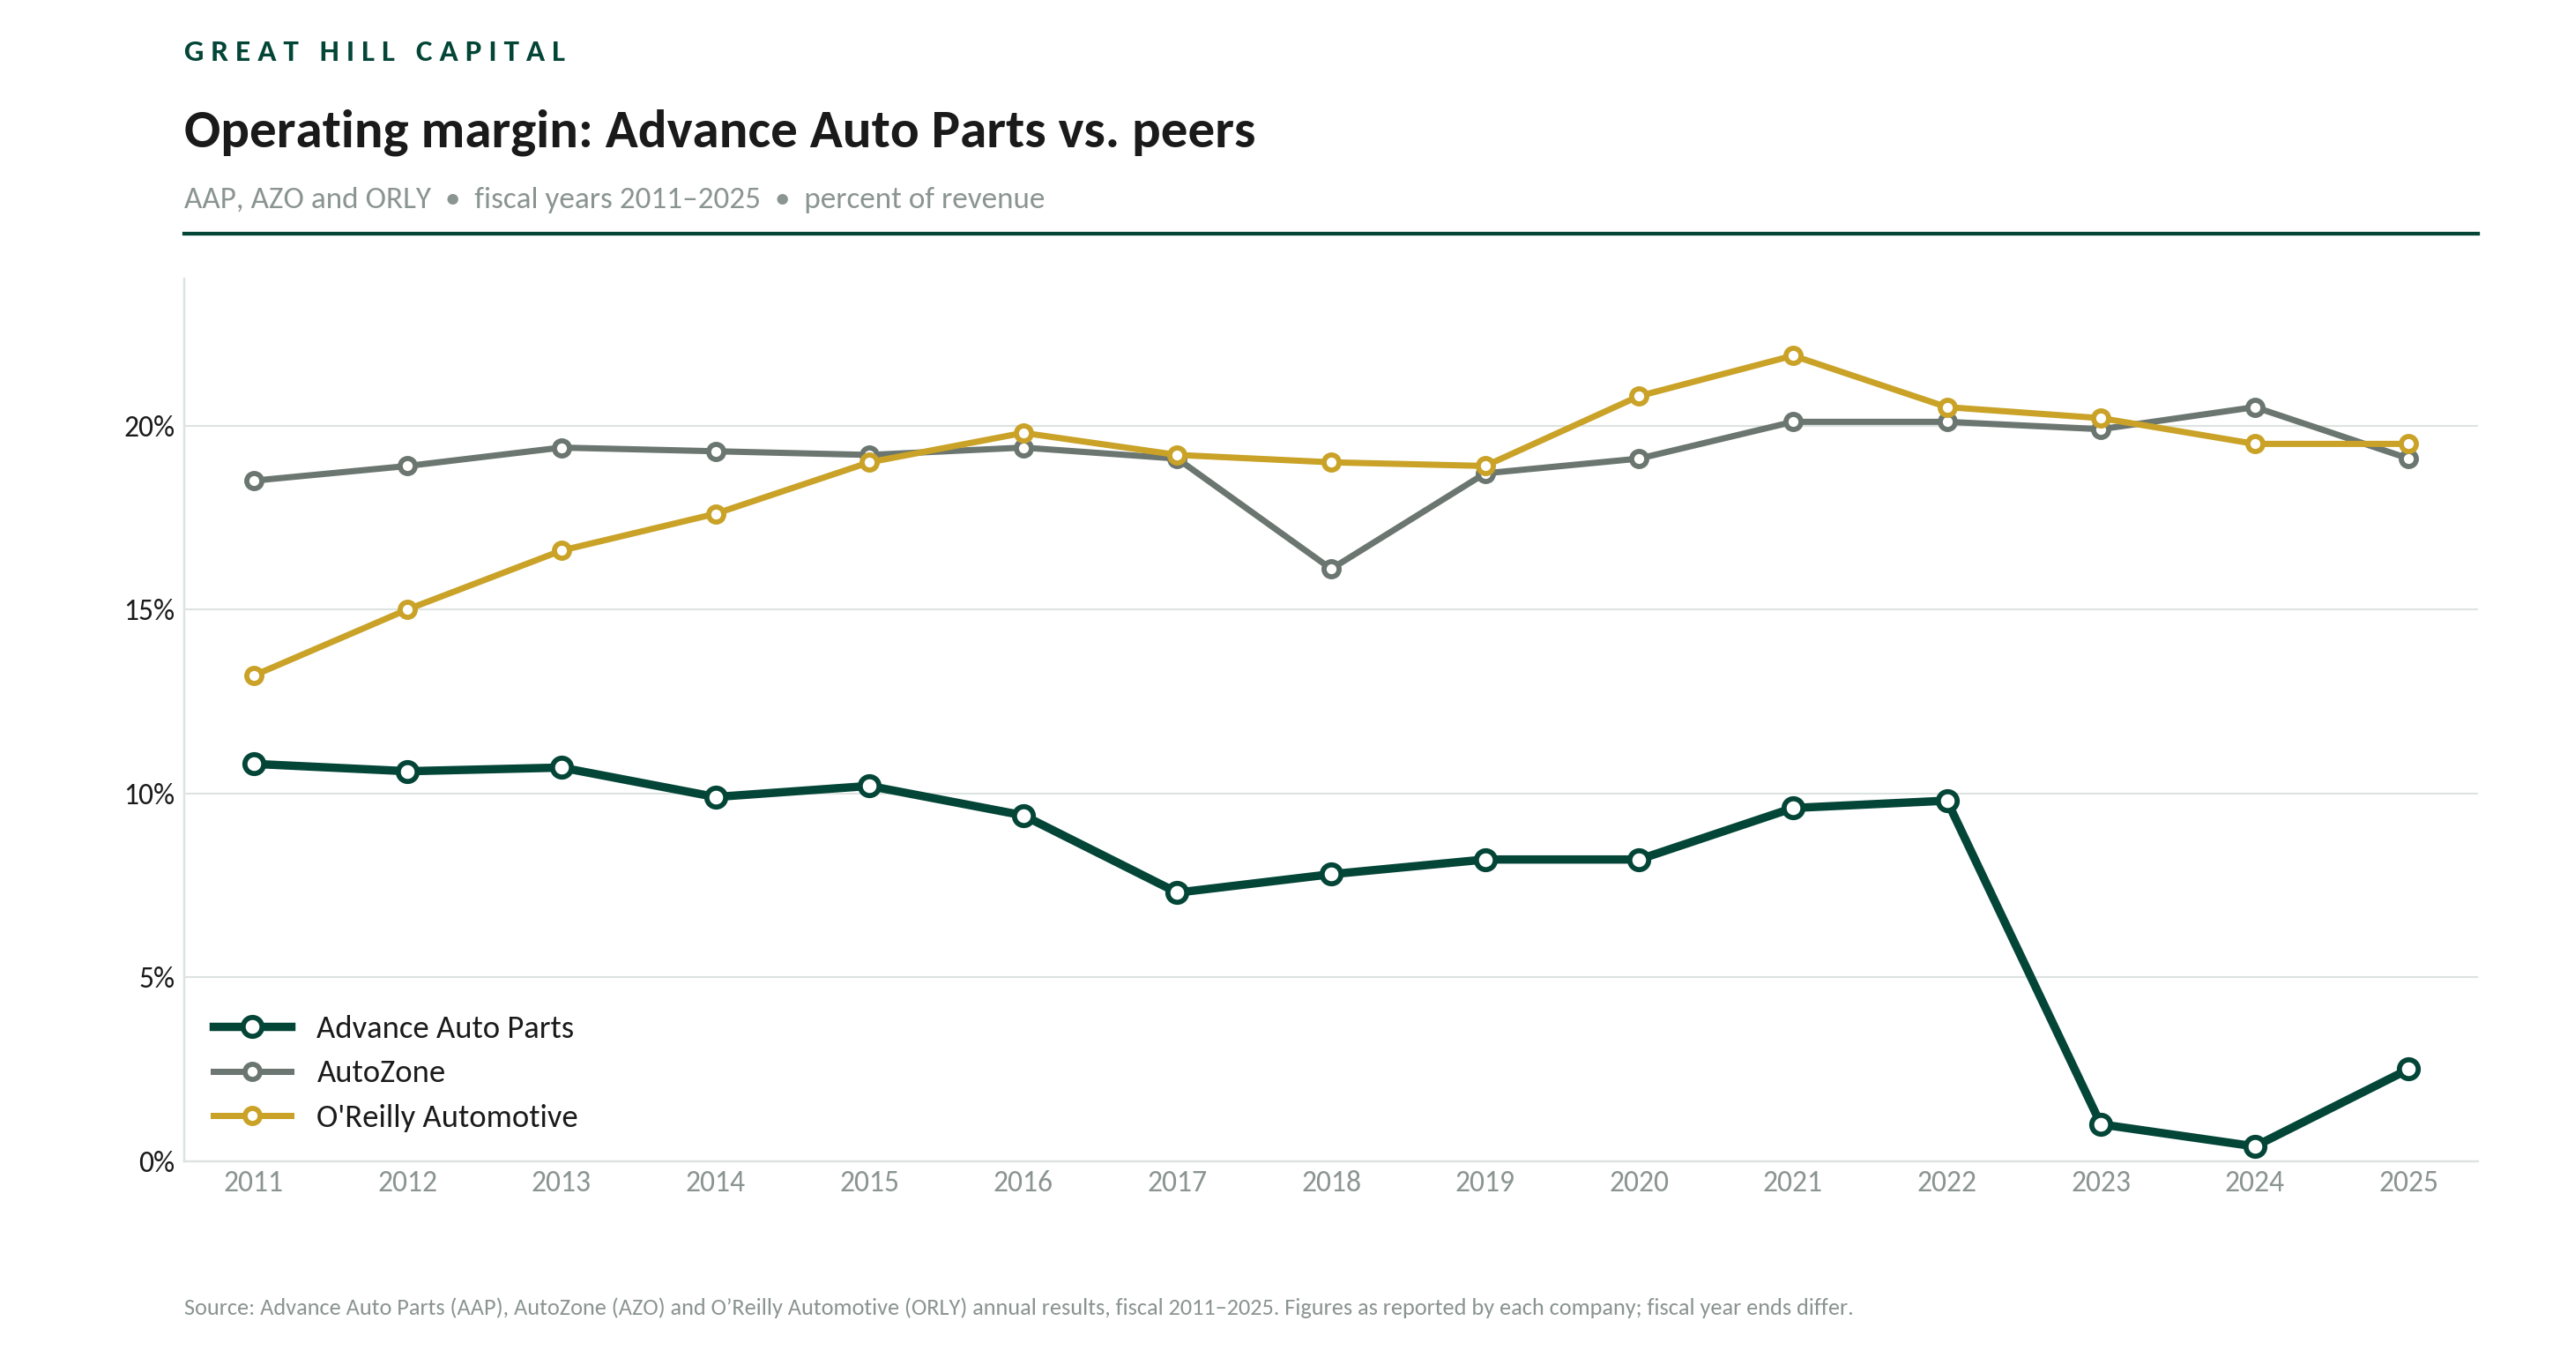
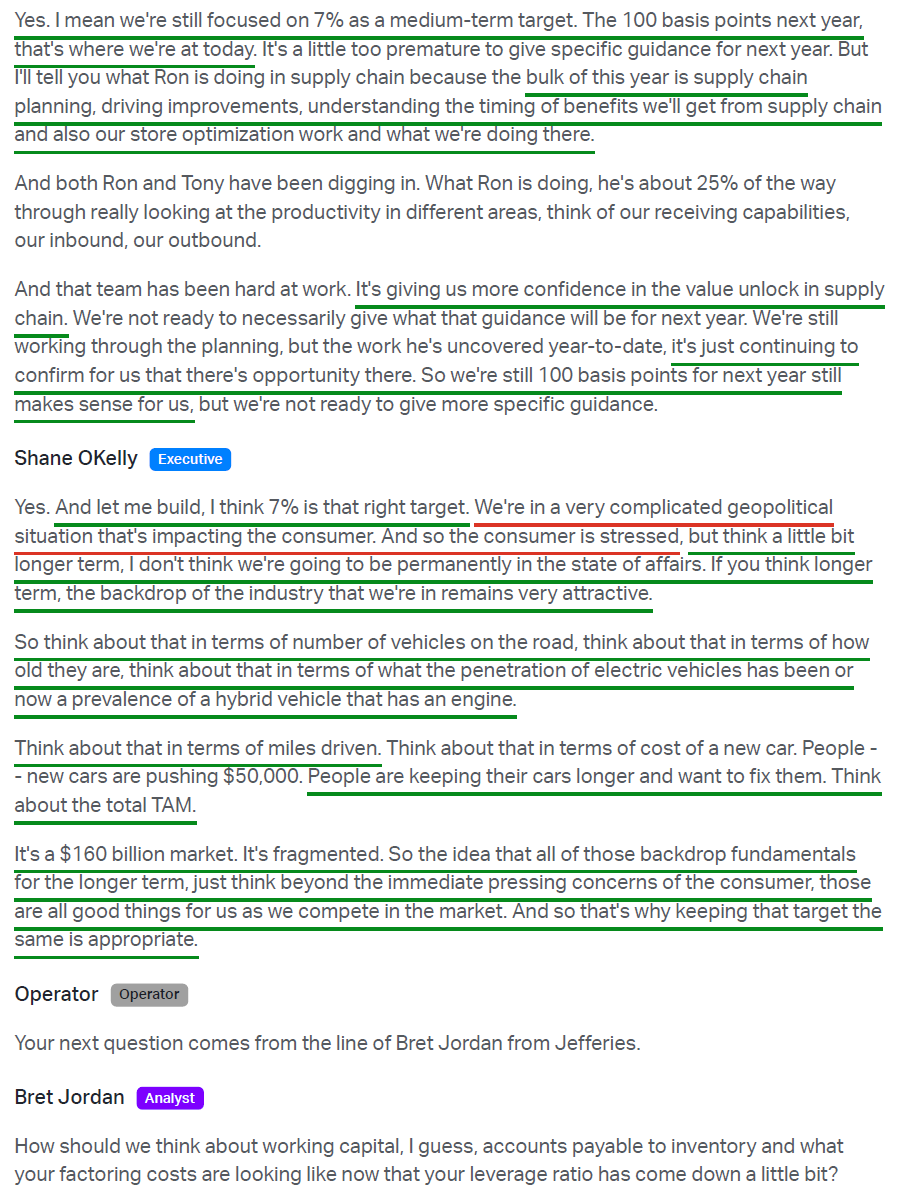
That brings us to the metric that matters more than any other in this turnaround: operating margins. Adjusted operating margins reached 5.6% in the quarter, up 257 bps Y/Y, with ~130 bps of the improvement coming from $26M of IEEPA tariff refunds. Year-to-date margins reached 4.6% versus 1.2% last year, while management reaffirmed full-year adjusted operating margin guidance of 3.8% to 4.5%, up 165 bps at the midpoint from 2.5% last year. Most importantly, management continues to see at least another 100 bps of margin expansion in 2027 and remains firmly committed to its medium-term 7% operating margin target.
We continue to see 7% as a low bar for this business. Advance averaged high-single-digit operating margins before the missteps that derailed the business, while industry peers ORLY and AZO operate at 19% to 20% today.
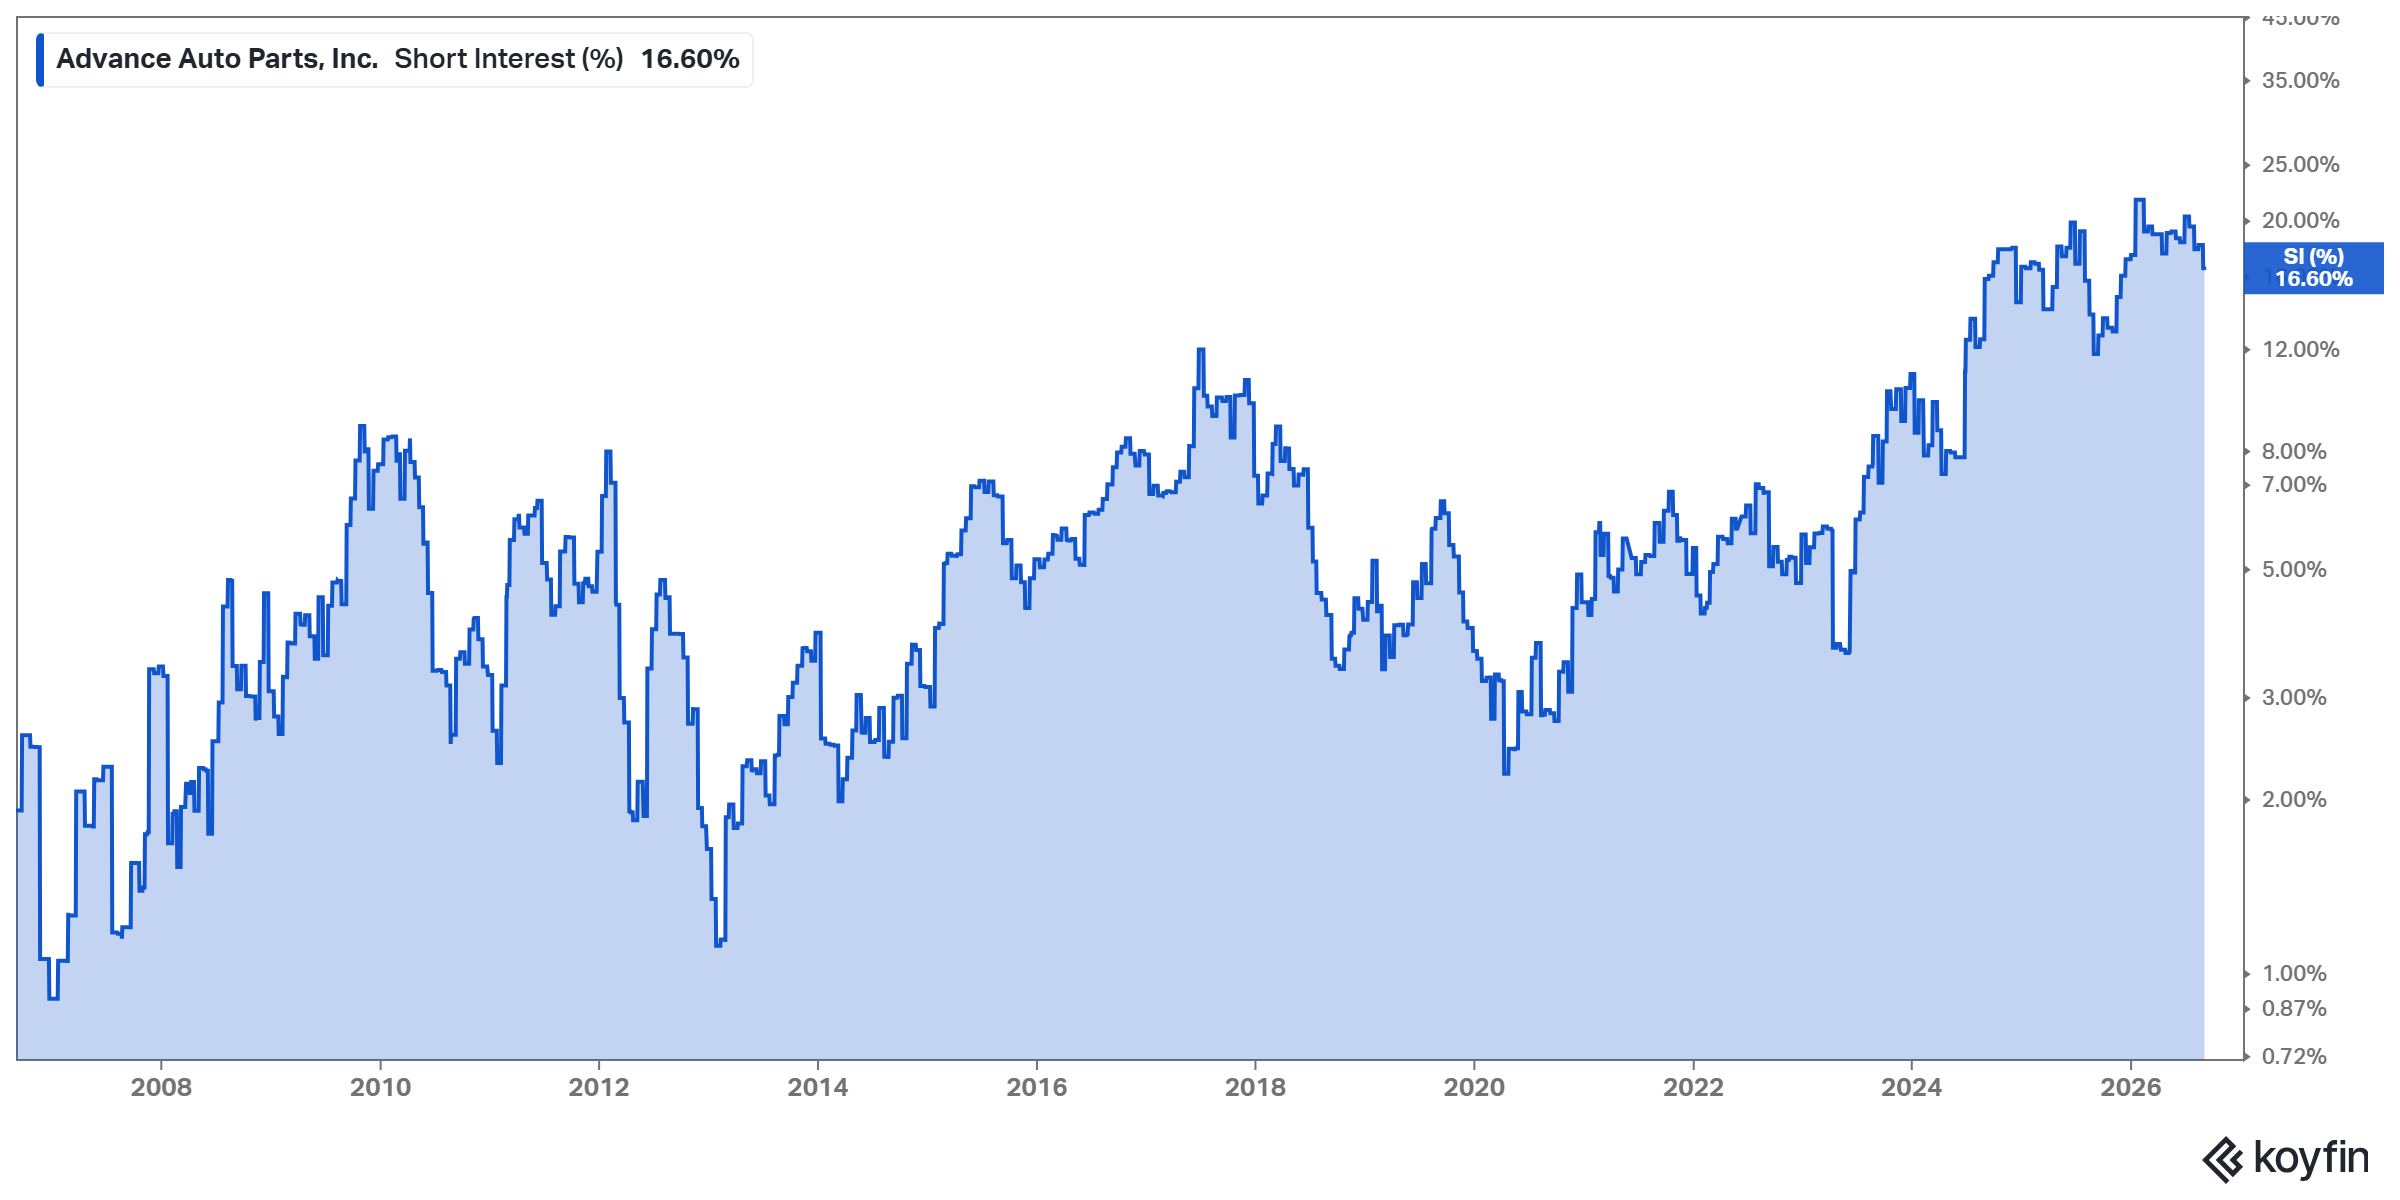
At a 7% operating margin, Advance would generate ~$630M of operating income on ~$9B of revenue, a level that has historically supported a stock price above $150 and, in our view, earnings power north of $7 per share. Consensus is still taking the under, forecasting just $471.8M of operating income in FY2028 at a 5.3% operating margin, while sentiment remains washed out, with short interest near a multi-year high at 16.6%. We’ll happily take the other side of that bet.
Our confidence in taking the other side comes from the fact that Advance is executing on these internal initiatives and producing structural improvements in the business against one of the most difficult backdrops you could ask for. Consumer sentiment is at extreme lows, oil is ~$97 a barrel and up ~50% Y/Y, yields remain elevated, inflation expectations are rising, tariffs remain in the mix, and the Iran war continues to weigh on the backdrop.
Yet the business is still expanding margins, generating cash, and strengthening its balance sheet. Most importantly, none of these conditions exist in perpetuity, but the current stock price effectively extrapolates them as if they will. This near-term focus, or what we like to call the short-term voting machine nature of markets, is where most investors get this wrong. The question that matters is what this business looks like two to three years from now in a normalized environment.
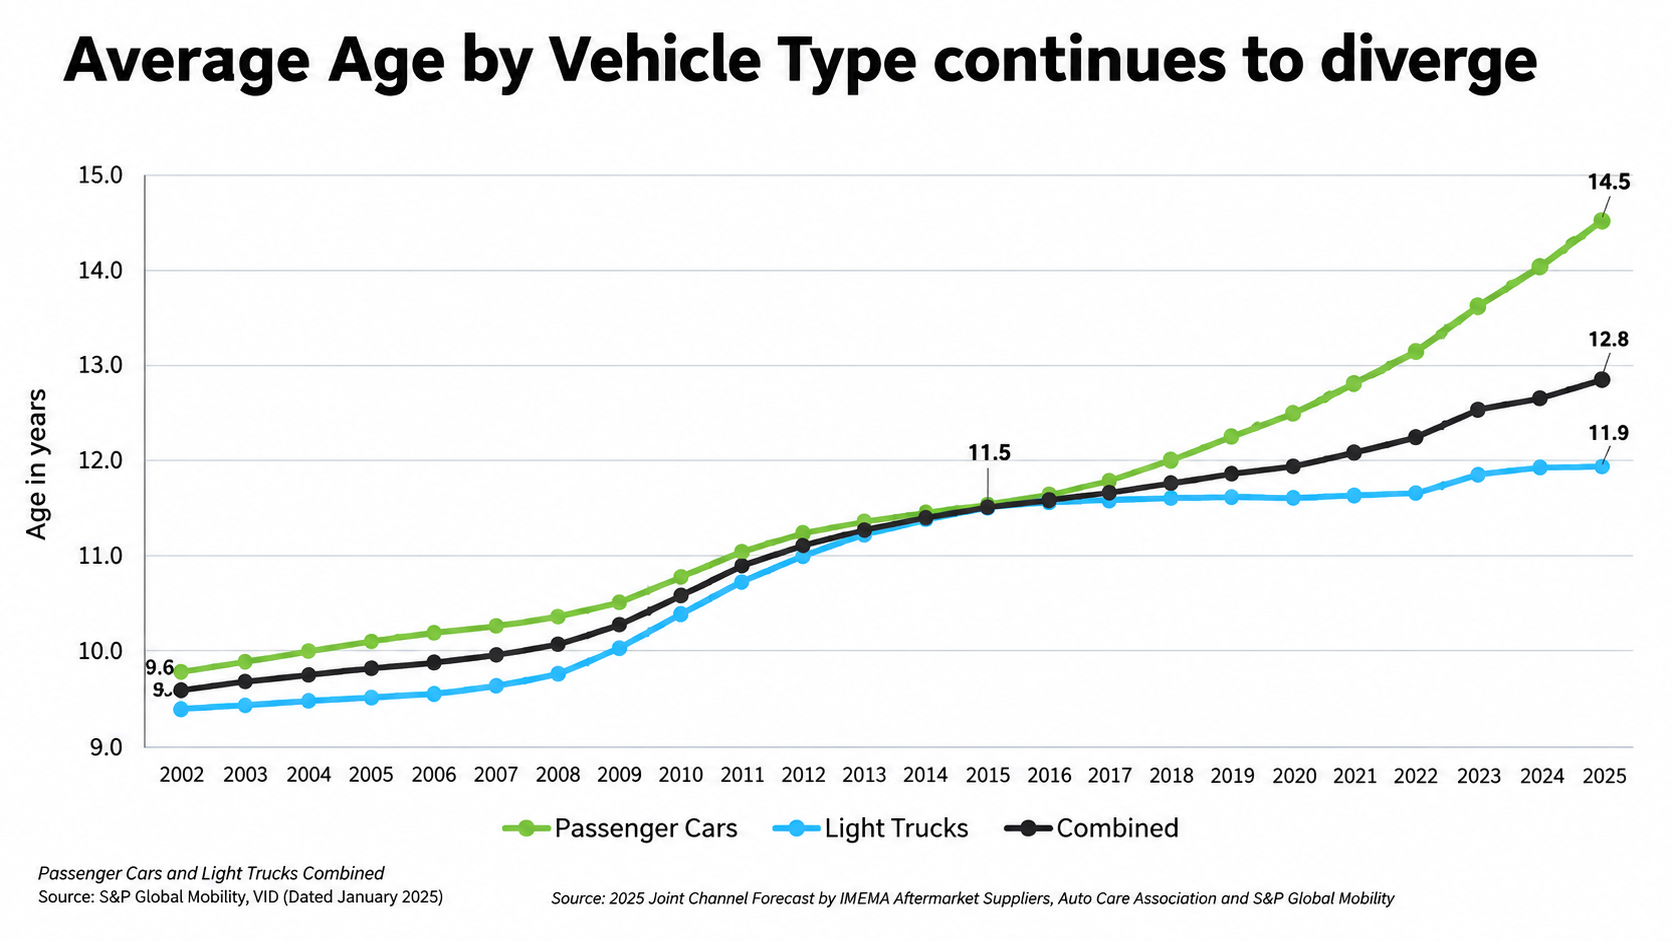
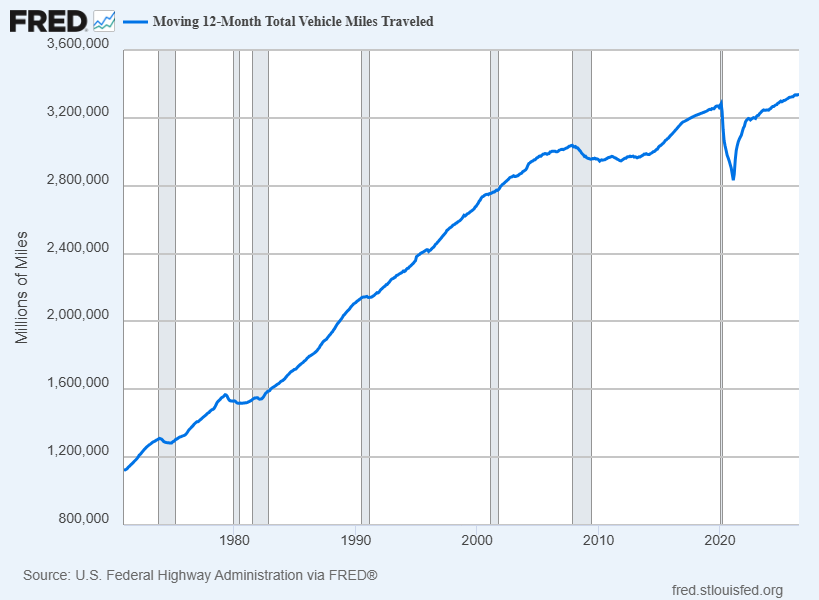
On that horizon, the aftermarket industry has plenty of fuel left in the tank. The average vehicle on American roads is now a record 12.8 years old, with more than 110 million light-duty vehicles in the prime six-to-fourteen-year service window, nearly 38% of the fleet. That fleet has also grown to 289 million vehicles, up ~10% from 263 million in 2016 and projected to exceed 301 million by 2029. Miles traveled have also rebounded to 3.34 trillion after troughing in 2021.
Not to mention, ~90% of what Advance sells is break/fix and non-discretionary. Deferred maintenance can only be kicked down the road for so long before the repair bill comes due, and the fleet only gets older in the meantime.
So while Advance is taking it on the chin in the near term as its core customer catches its breath, management continues doing what matters most: executing the plan, cleaning up operations, and taking cost out of the system. When the consumer eventually converges with the industry backdrop, Advance won’t just be back on its feet. It will be operating in a much higher gear.
Q2 Earnings Breakdown
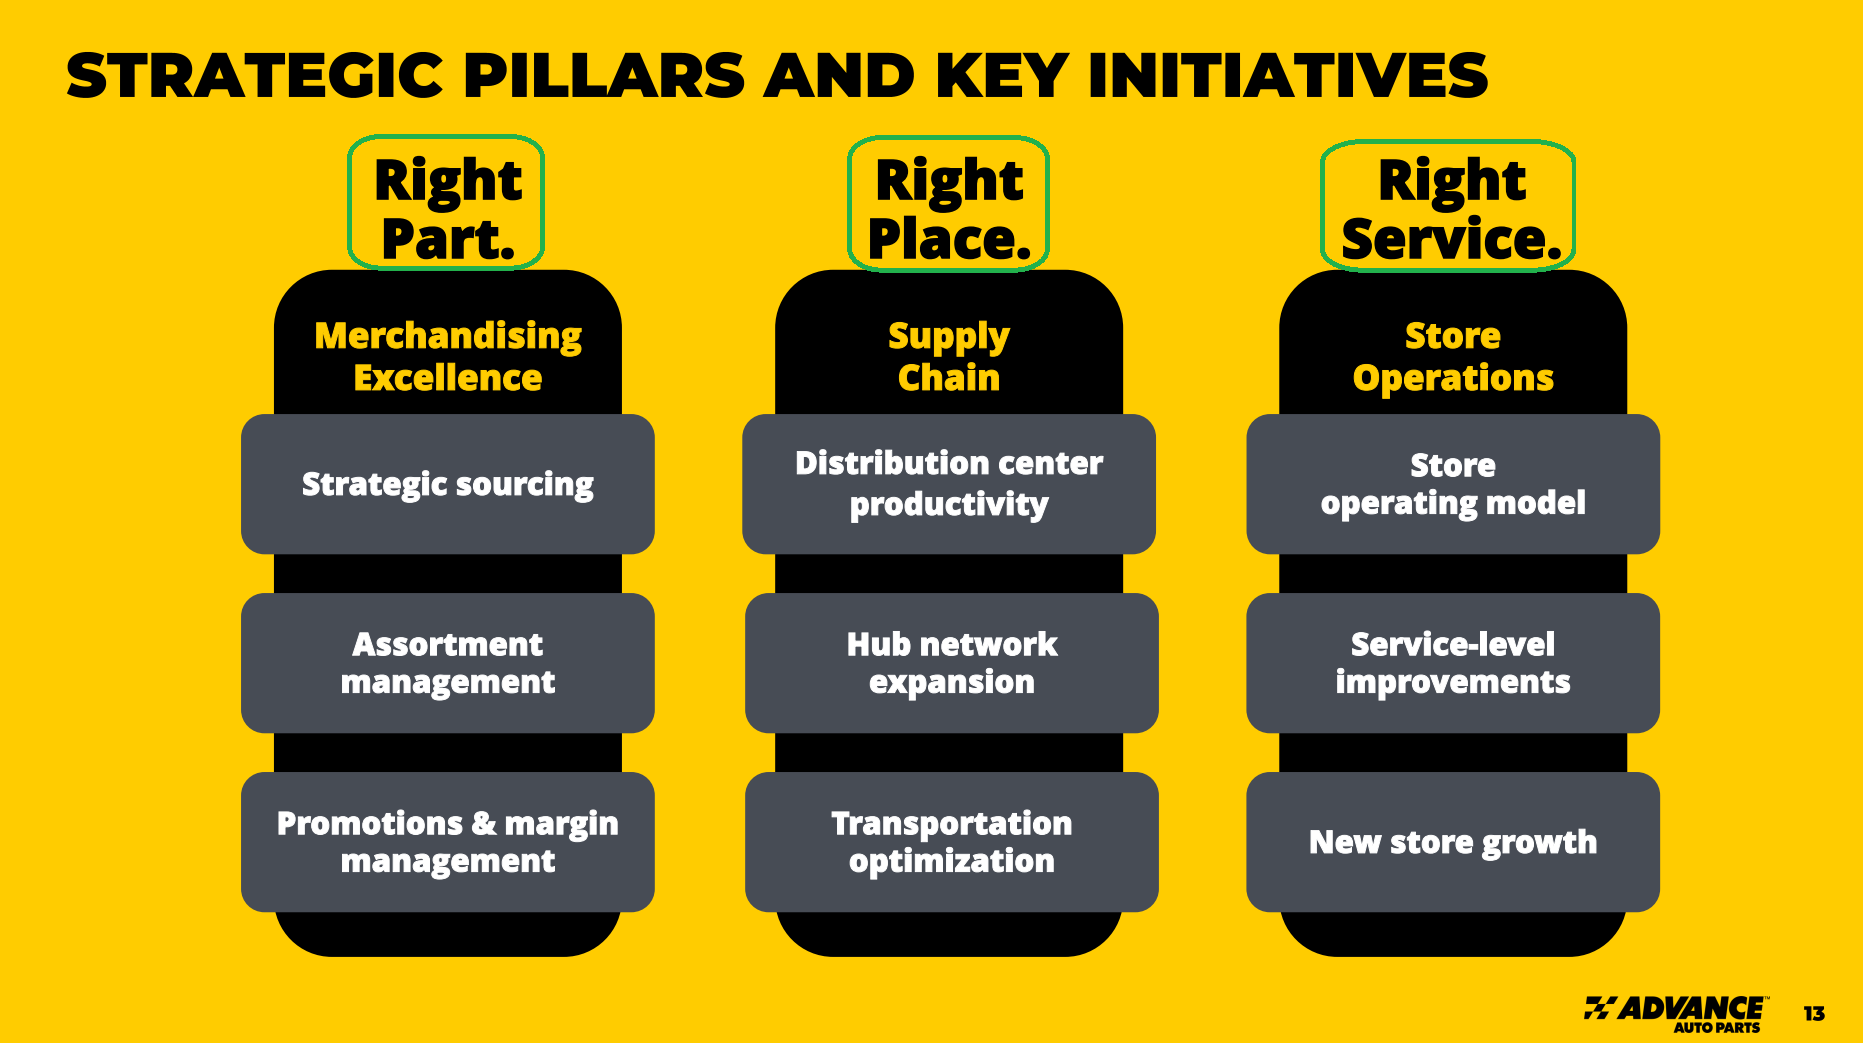
10 Key Points
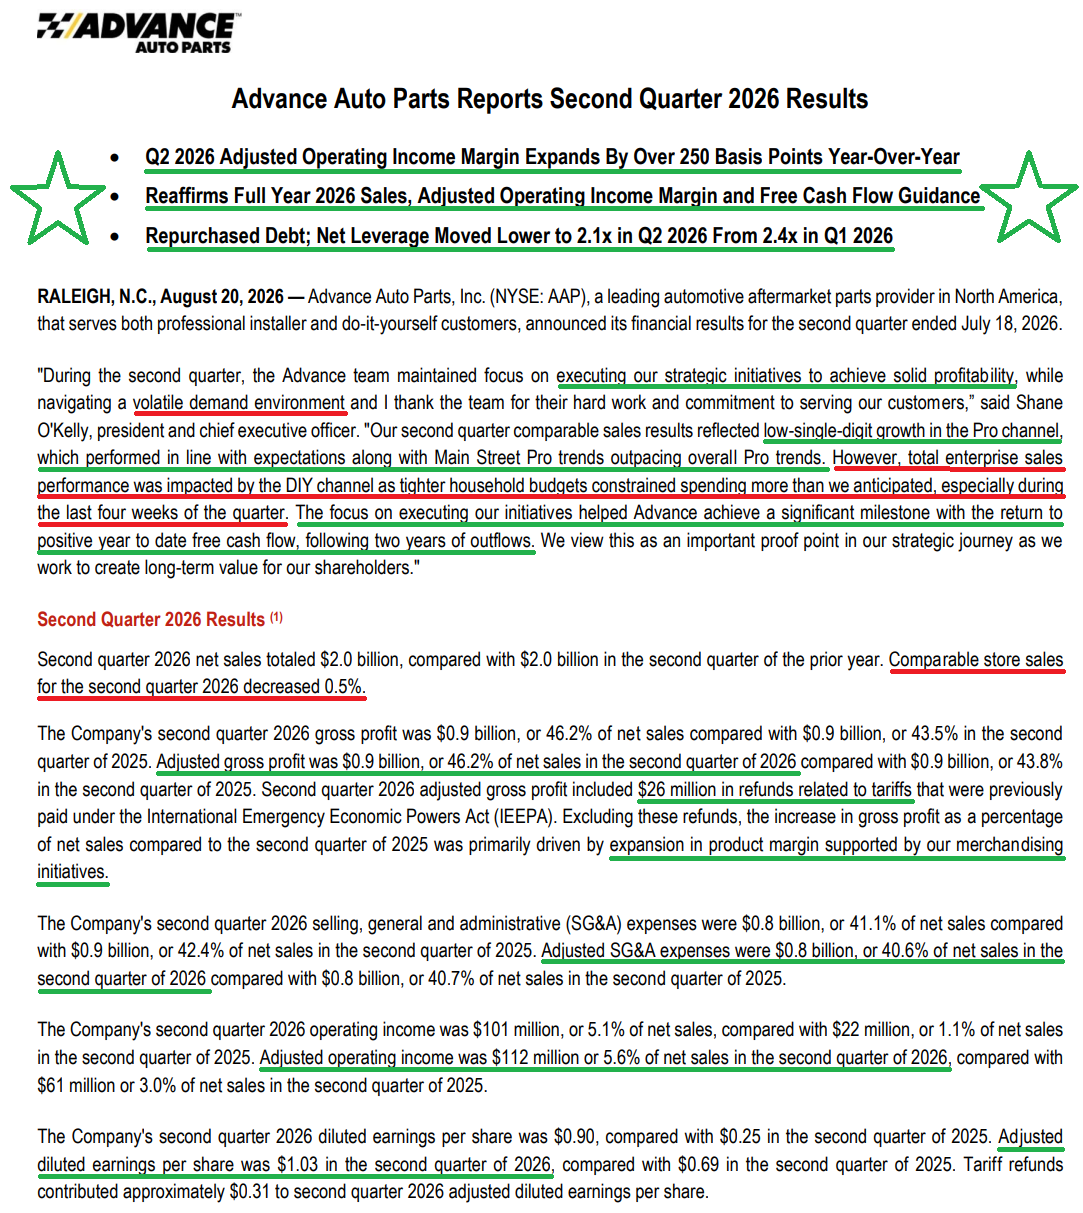
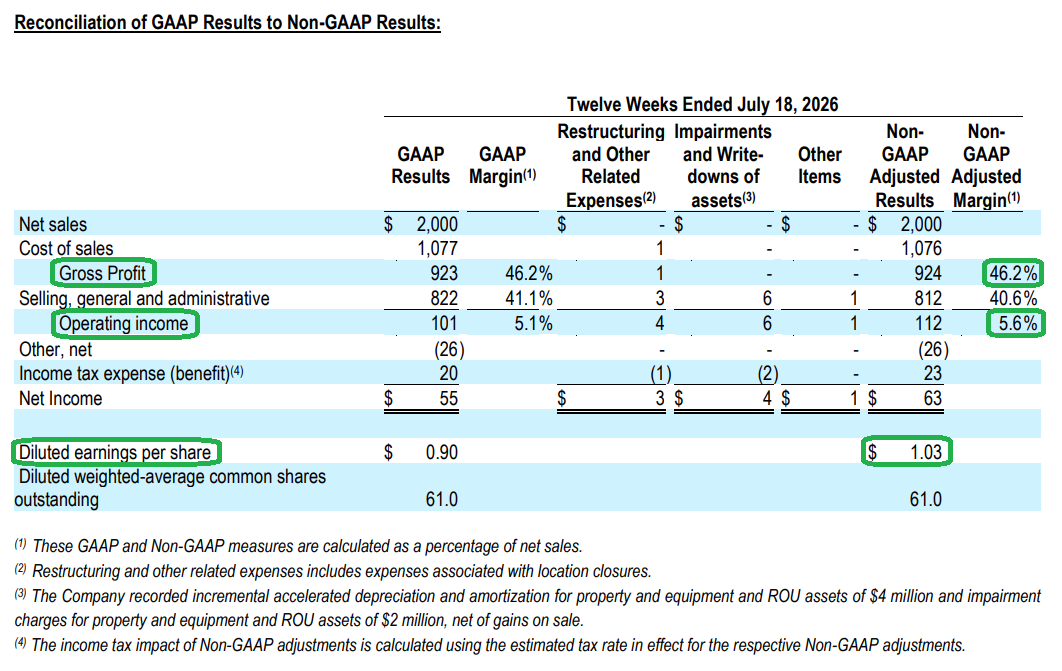
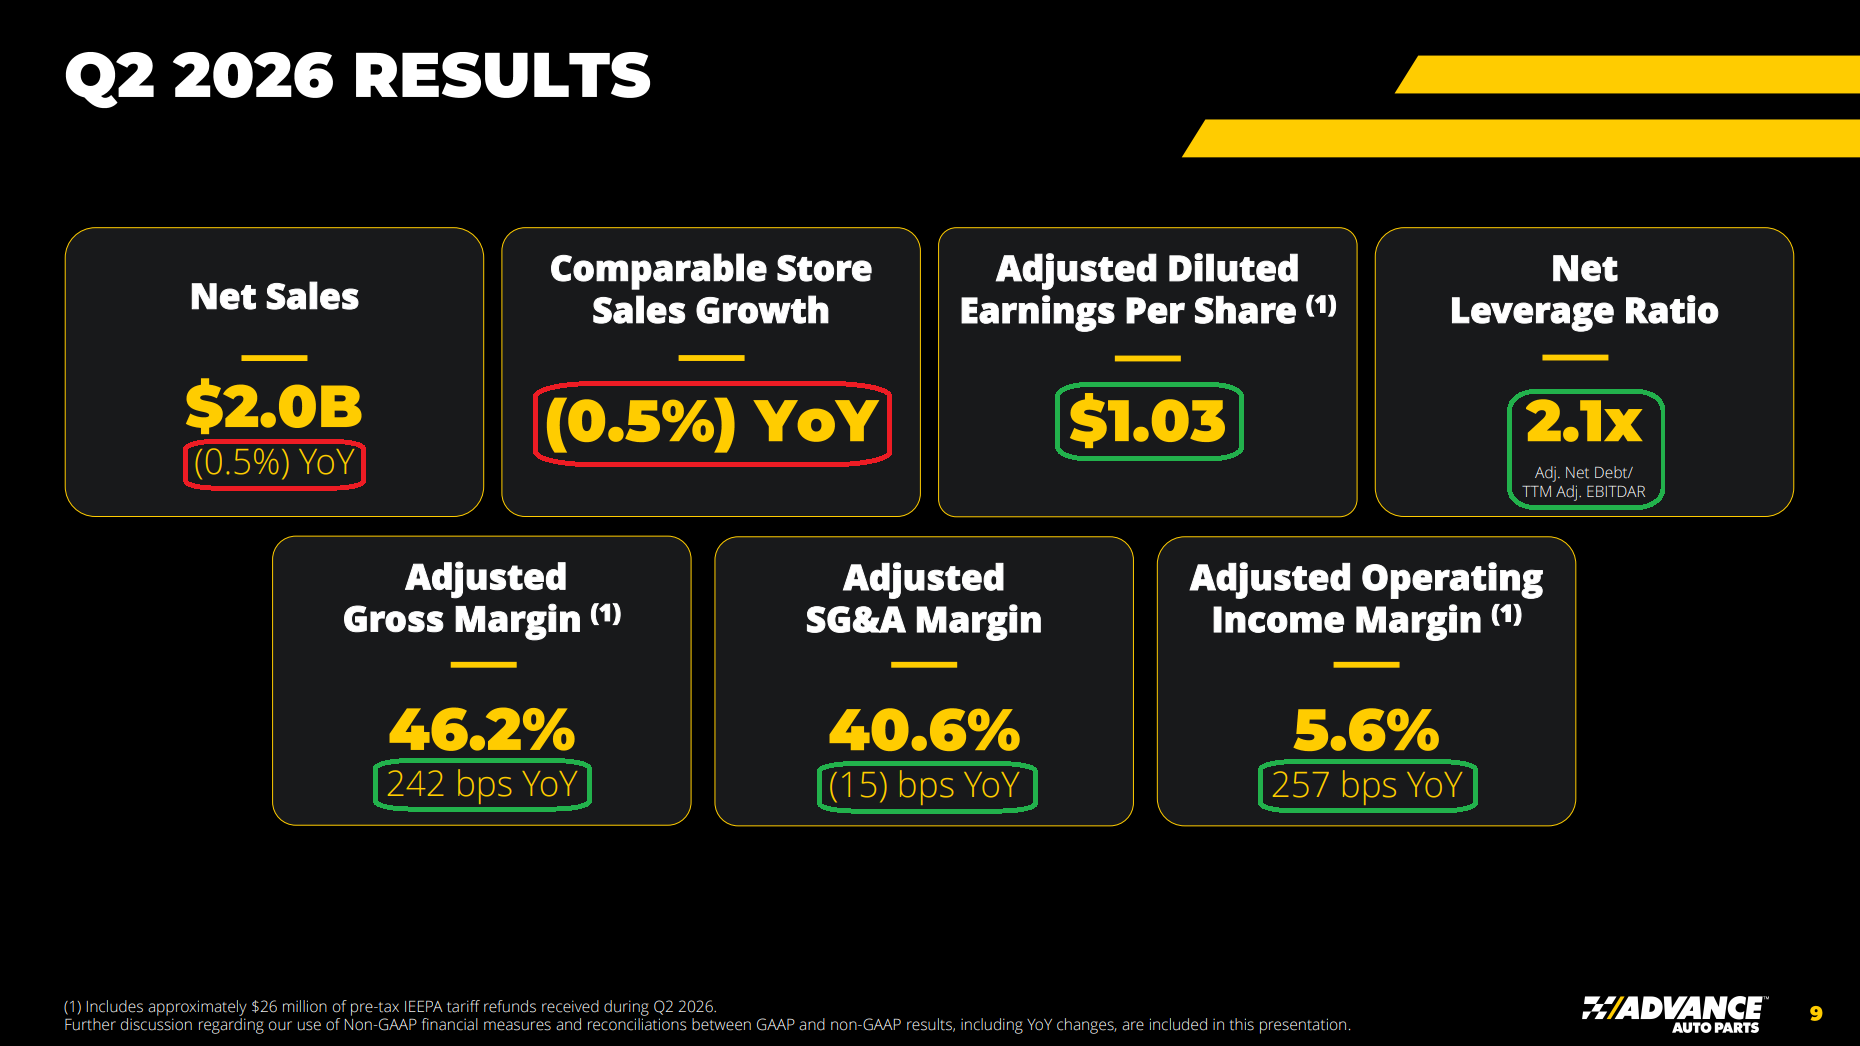
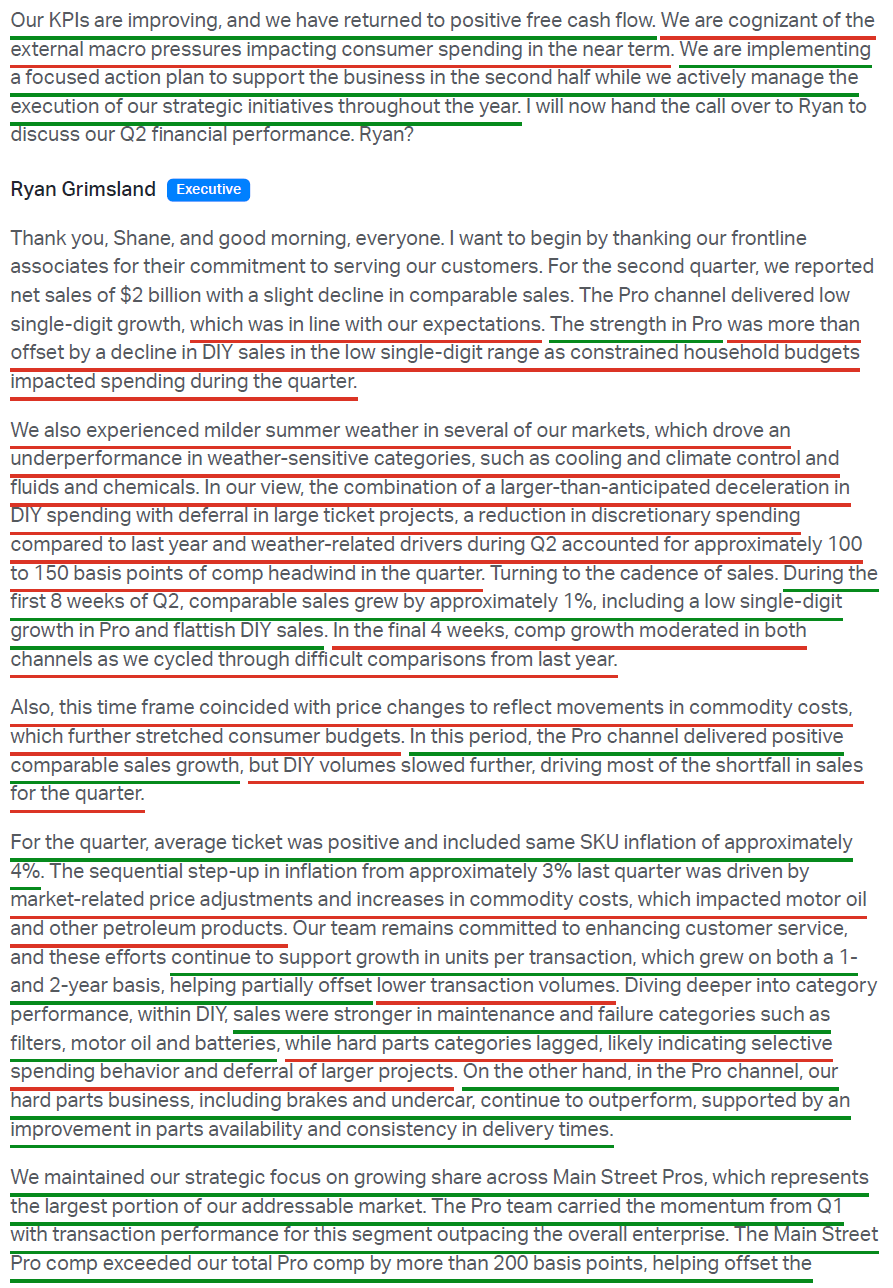
1) AAP delivered $2.0B in revenue (-0.5% Y/Y), missing consensus by ~$40M, with comp sales of -0.5% falling short of the +1.4% Street estimate. Comps ran at ~+1% through the first 8 weeks, with Pro up low single digits and DIY roughly flat, before both channels moderated in the final 4 weeks. Adjusted diluted EPS of $1.03 beat the $0.81 consensus and compared with $0.69 last year (+49.3% Y/Y), though ~$0.31 came from tariff refunds, putting the underlying figure closer to $0.72.
2) The Pro channel delivered low-single-digit growth in line with management’s expectations and remained positive throughout the entire quarter, with Main Street Pro once again outpacing overall Pro by more than 200 bps. Management continues to rationalize the lower-margin national account book and redeploy selling resources toward Main Street, which represents both the larger TAM and higher-margin opportunity. Growth is coming from both existing accounts buying more frequently and accounts that had not previously shopped AAP in any meaningful size, a sign the assortment and service improvements are landing. Improved parts availability, consistent sub-40-minute delivery times, and the expanding hub network are supporting share gains in hard-parts categories, including brakes and undercar.
3) DIY declined low single digits and drove most of the quarter’s shortfall as tighter household budgets pressured a customer base skewed toward lower- and middle-income consumers. Management sized the combination of DIY deceleration, deferred large-ticket projects, lower discretionary spending, and milder weather at ~100 to 150 bps of comp headwind. Management acknowledged being slow to pivot its messaging toward value and is responding with the Advance Rewards loyalty program, paid search optimization, vendor-funded media campaigns, a good-better-best assortment push, and expansion of the ARGOS owned brand into additional categories. DIY has since accelerated on a 2-year basis in Q3 alongside improving transaction trends.
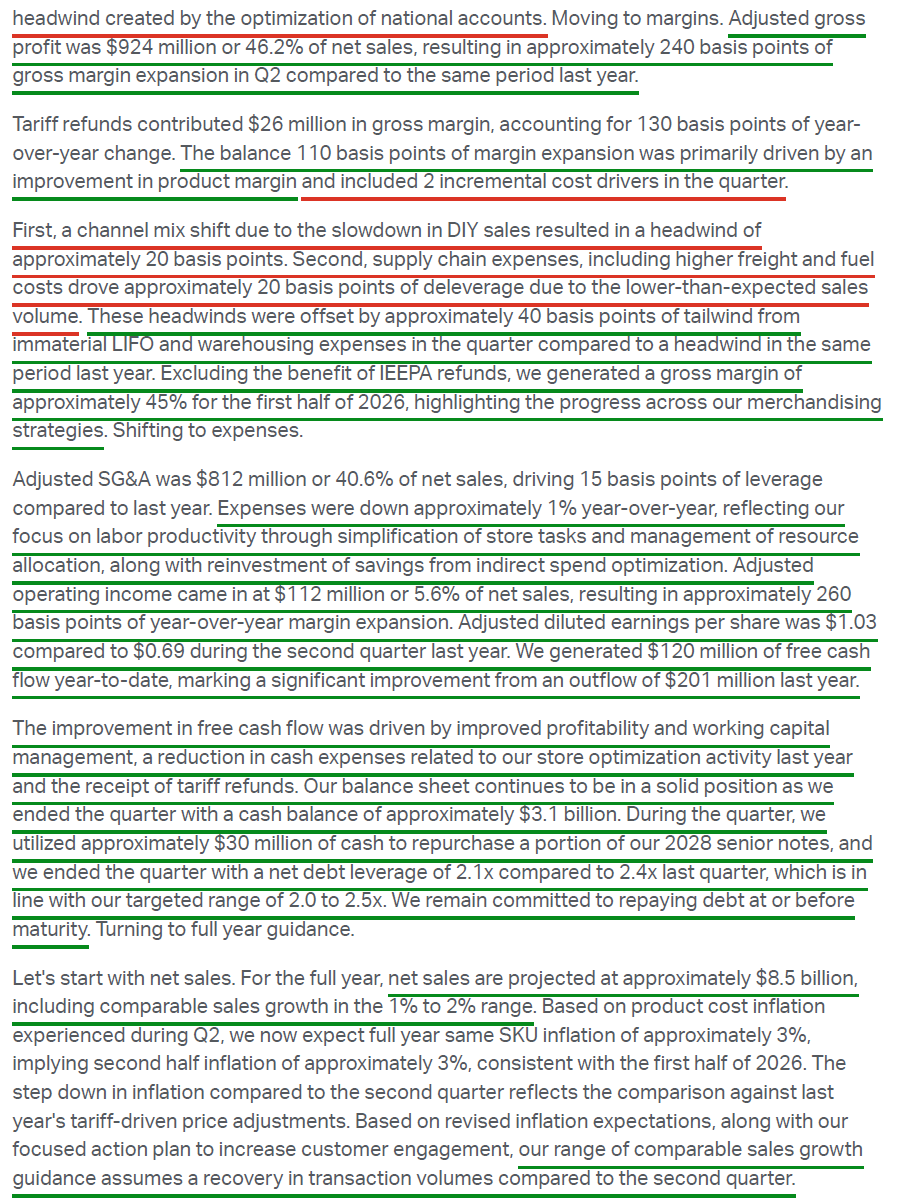
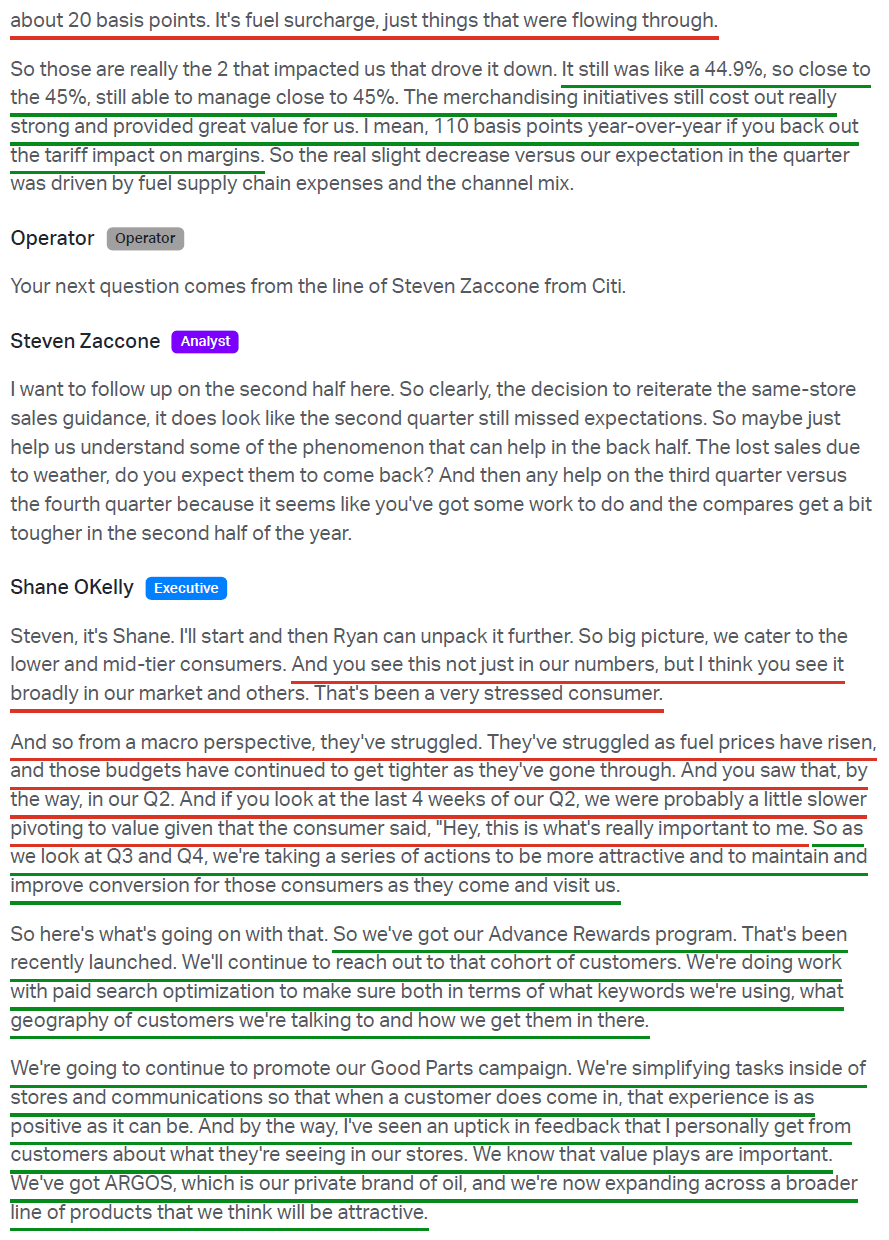
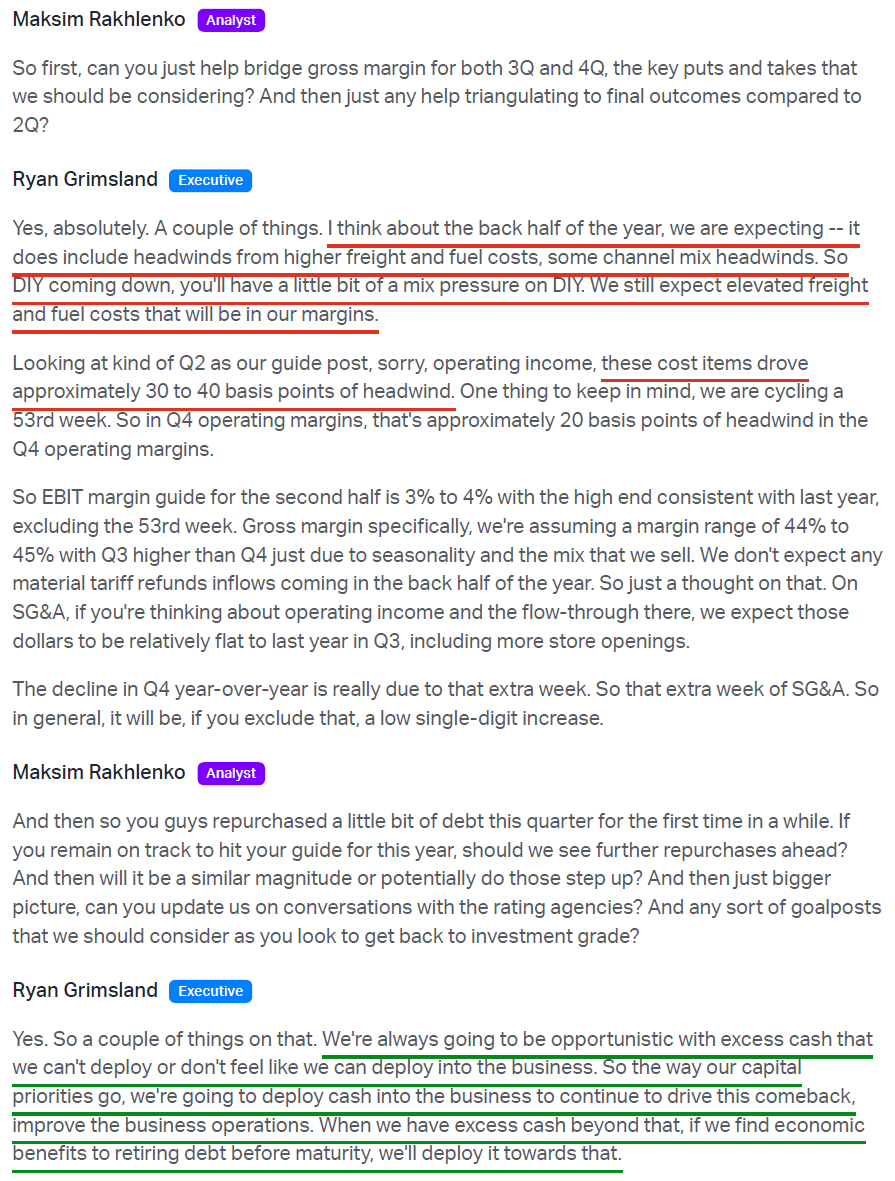
4) Adjusted gross margin came in at 46.2% (+242 bps Y/Y), including $26M of IEEPA tariff refunds worth ~130 bps. Excluding the refunds, gross margin was 44.9% (+110 bps Y/Y), driven by product margin expansion from merchandising initiatives that have contributed ~100 bps to product margin year to date. Offsetting items included ~20 bps of channel mix pressure from the DIY slowdown and ~20 bps of supply chain deleverage from higher freight and fuel costs, partially offset by a ~40 bps tailwind from immaterial LIFO and warehousing expense. YTD adjusted gross margin stands at 45.6% (+230 bps Y/Y), or ~45% excluding refunds.
5) The most important metric in the AAP turnaround, adjusted operating margin, came in at 5.6% (+257 bps Y/Y), ahead of the 4.7% consensus estimate, with adjusted operating income of $112M versus a $93.9M estimate. Excluding the tariff refunds, operating margin still expanded to 4.3% (+130 bps Y/Y), supported by adjusted SG&A of 40.6% of sales, which delivered 15 bps of leverage as dollars fell ~1% Y/Y on simplified store tasking and indirect spend optimization. That brings YTD adjusted operating margin to 4.6% versus 1.2% last year, with management reiterating its medium-term 7% target and expecting at least another 100 bps of expansion in 2027.
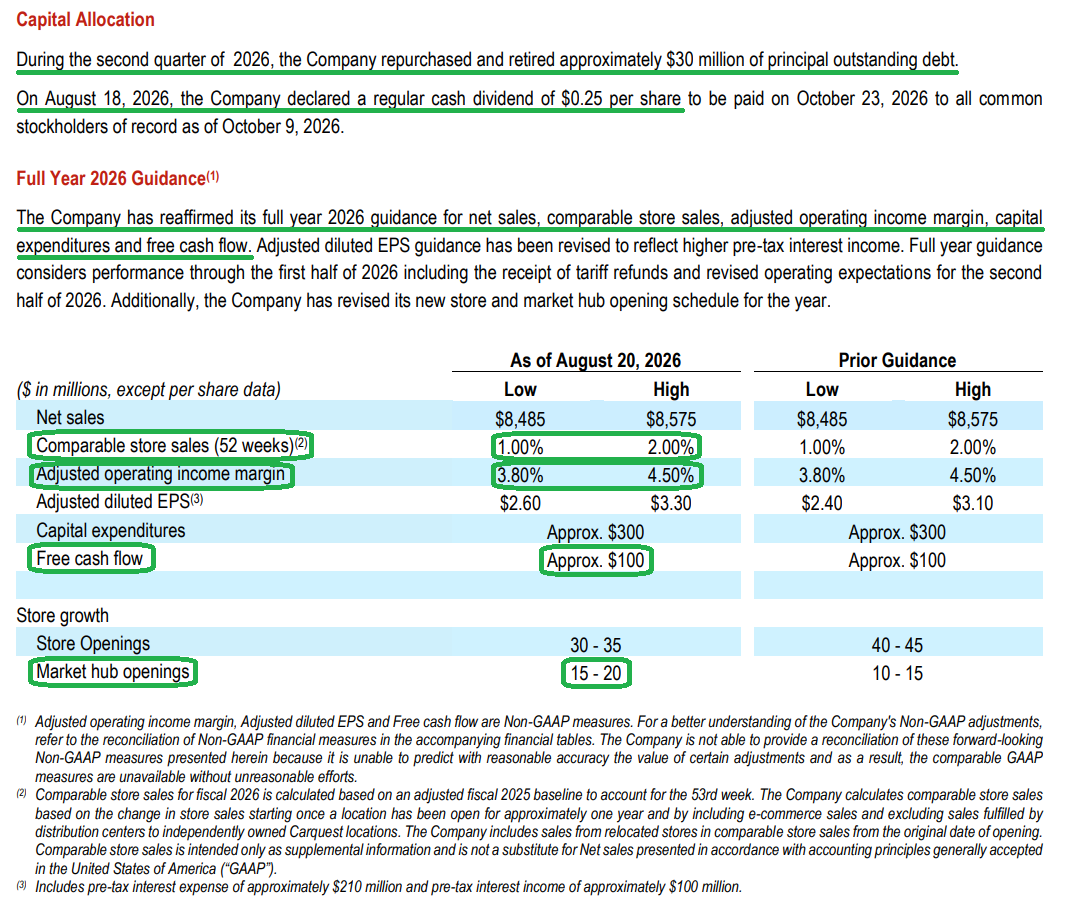
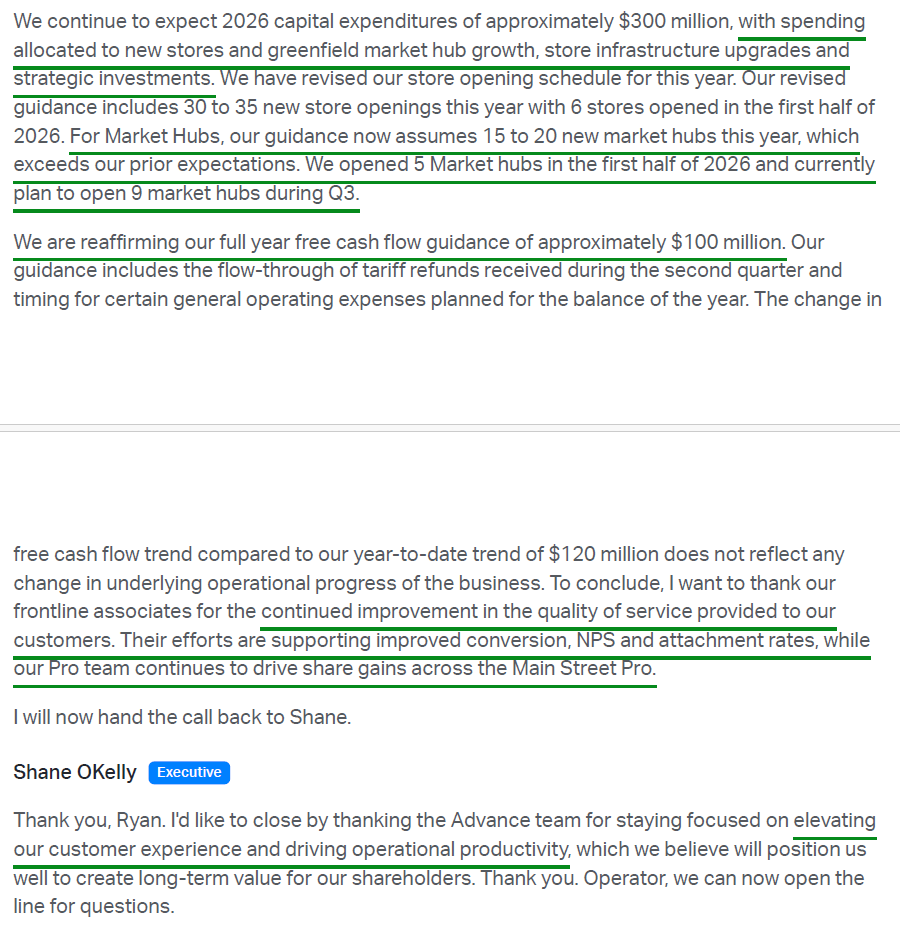
6) The supply chain transformation hit a key milestone with the DC consolidation now complete, ending at 15 distribution centers operating on a single unified warehouse management system versus nearly 40 facilities running multiple systems when the effort began two years ago. Attention now shifts to productivity, where 25% of identified DC process improvements are complete, with full implementation expected by mid-2027 and the associated margin benefit beginning next year. Management is also rebidding all carrier contracts and expects to consolidate volume across 70% fewer carriers, worth tens of millions of dollars in savings supporting 2027 margins. On the hub front, AAP opened 5 market hubs in the first half for a total of 38 and raised its FY2026 target to 15 to 20 openings, with 9 slated for Q3 alone. That puts the company at ~50 hubs by year end and on track for ~60 by mid-2027, lifting hub coverage to 70% of stores by year end and 100% by the middle of next year.
7) Store-level KPIs continued to improve sequentially as management remains focused on what it can control. NPS improved to nearly 80 from the high 60s in the prior-year period, while in-store attachment rates rose to nearly 30% from the mid-to-high 20s, with average time to serve Pro orders holding below 40 minutes in every week of the quarter. AAP also completed an independent study of store task execution to update labor standards that had gone unchanged for more than a decade, with revised labor allocation systems beginning to roll out later this year.
8) Free cash flow came in at +$120M year to date versus an outflow of $201M in the prior-year period, marking the first positive year-to-date free cash flow in two years. The improvement was driven by better profitability, working capital management, lower restructuring cash charges of $11M versus $110M, and the receipt of tariff refunds. Management reaffirmed FY2026 free cash flow of ~$100M, with the difference versus the year-to-date figure reflecting the timing of operating expenses rather than any change in underlying performance.
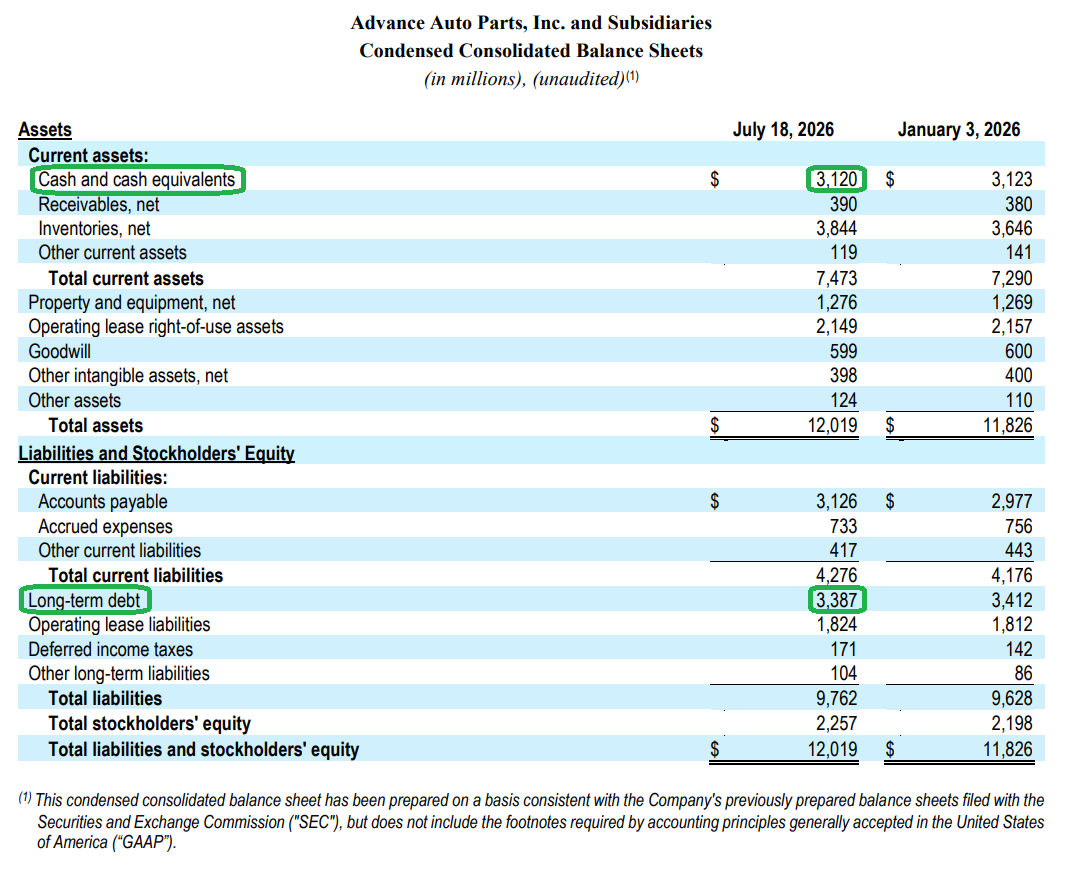
9) The balance sheet continued to improve, with net leverage falling to 2.1x from 2.4x in Q1 and sitting within the 2.0x to 2.5x target range, backed by $3.12B of cash against $3.39B of long-term debt. AAP retired ~$30M of principal on its 2028 senior notes during the quarter, marking the first debt reduction since the WorldPac proceeds were deployed, with management signaling it will remain opportunistic when excess cash exceeds what the business can absorb. Both Moody’s and S&P moved to a stable outlook during the quarter, a step toward the goal of re-establishing an investment-grade rating, which sits 3 notches away at Moody’s and 2 at S&P.
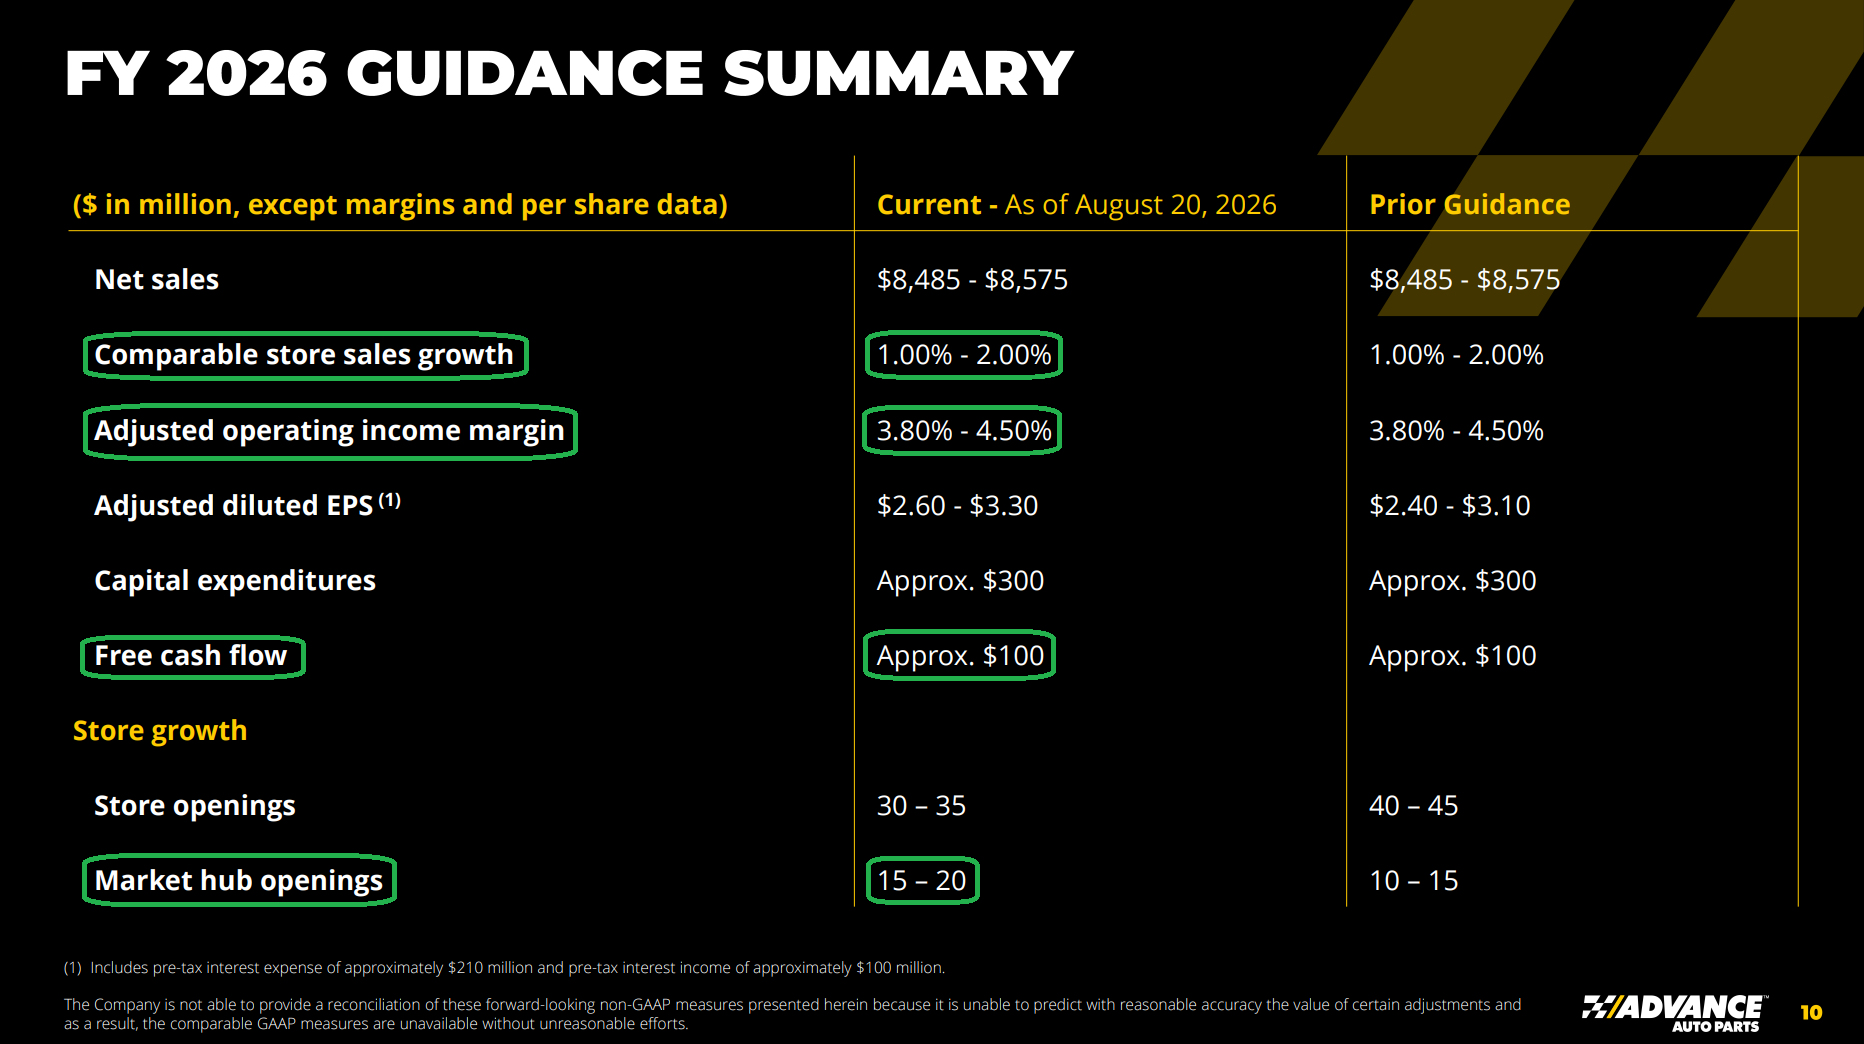
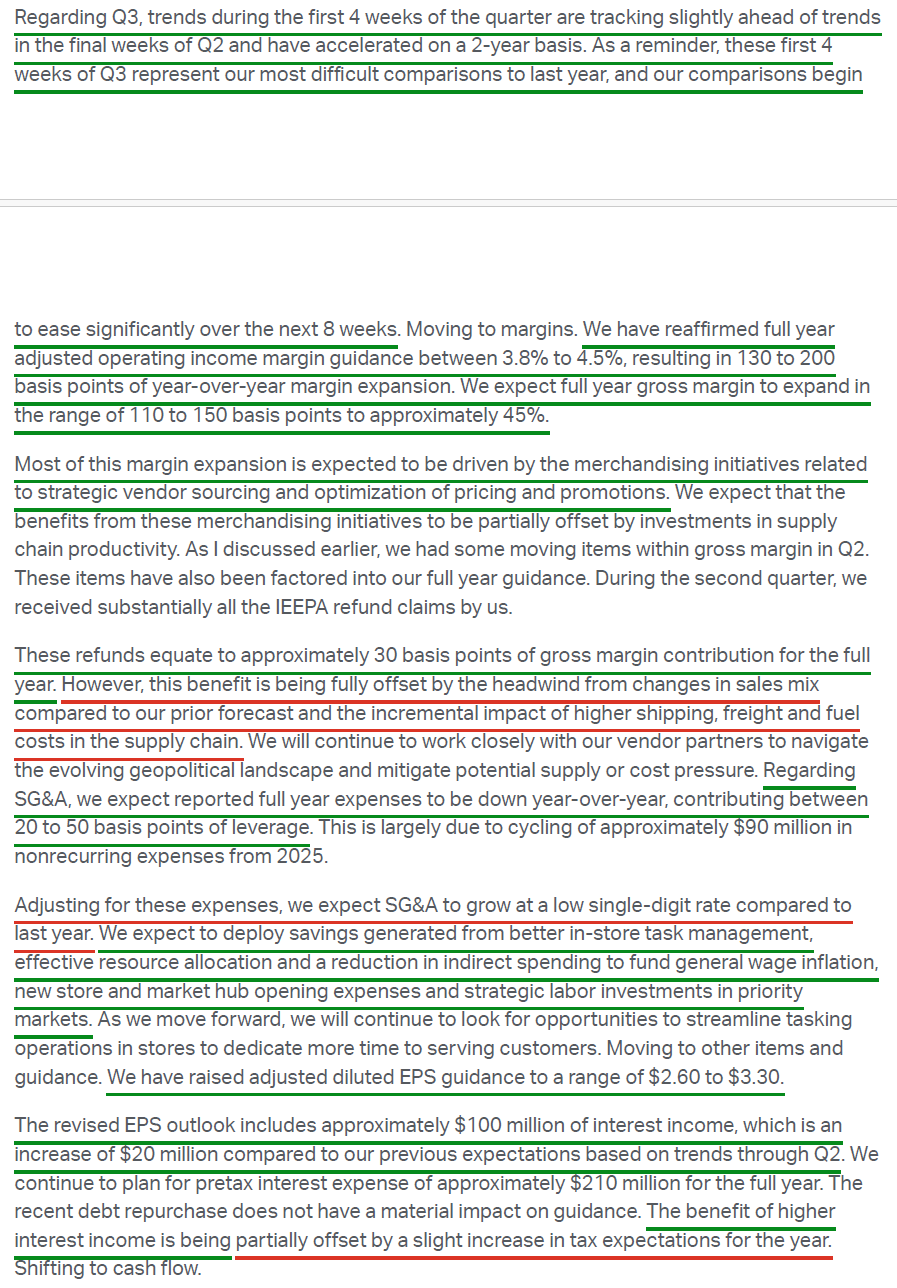
10) Management reaffirmed full-year net sales of $8.485B to $8.575B and comp sales growth of +1% to +2%, while raising adjusted EPS guidance to $2.60 to $3.30 from $2.40 to $3.10 (consensus: $2.93). The increase was driven by ~$100M of interest income, up $20M from prior expectations, against unchanged interest expense of ~$210M. The implied H2 operating margin of 3% to 4% and gross margin of 44% to 45% assume a recovery in transaction volumes, with Q3 running above Q4 on seasonal mix. Trends in the first 4 weeks of Q3 are tracking slightly ahead of the Q2 exit rate, with improving transaction growth, while comps ease significantly over the following 8 weeks.
Earnings Call Highlights
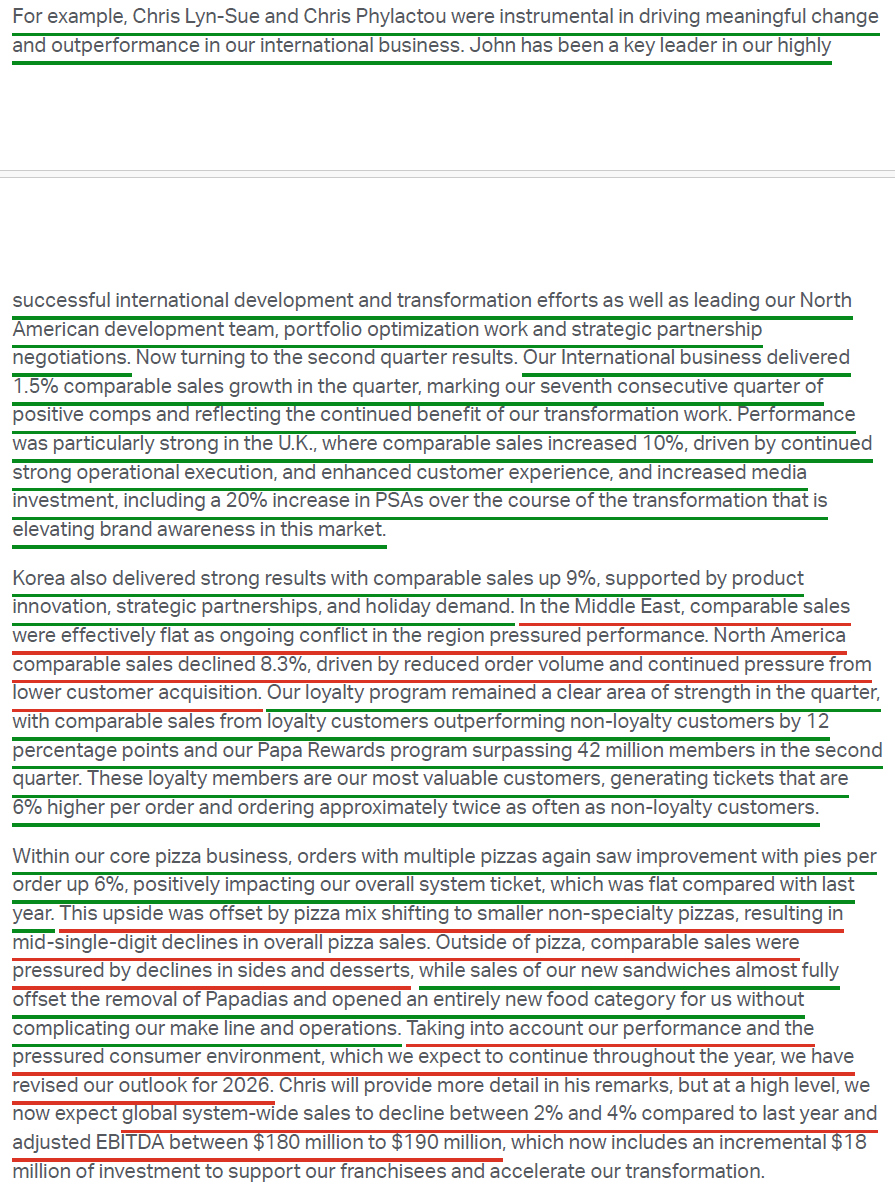
Papa John’s (PZZA) Update
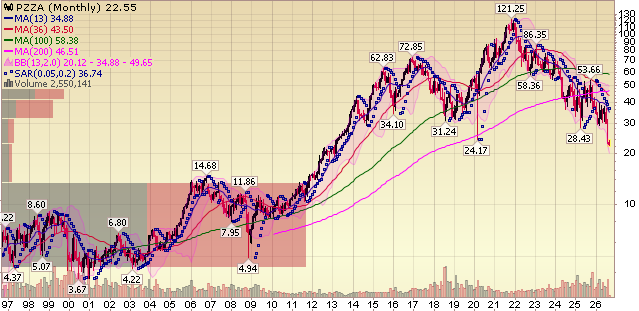
For newer readers, here’s a quick overview of our thesis on Papa John’s, a global leader in the pizza QSR category, where a proven operator is driving a back-to-basics turnaround after years of self-inflicted missteps:
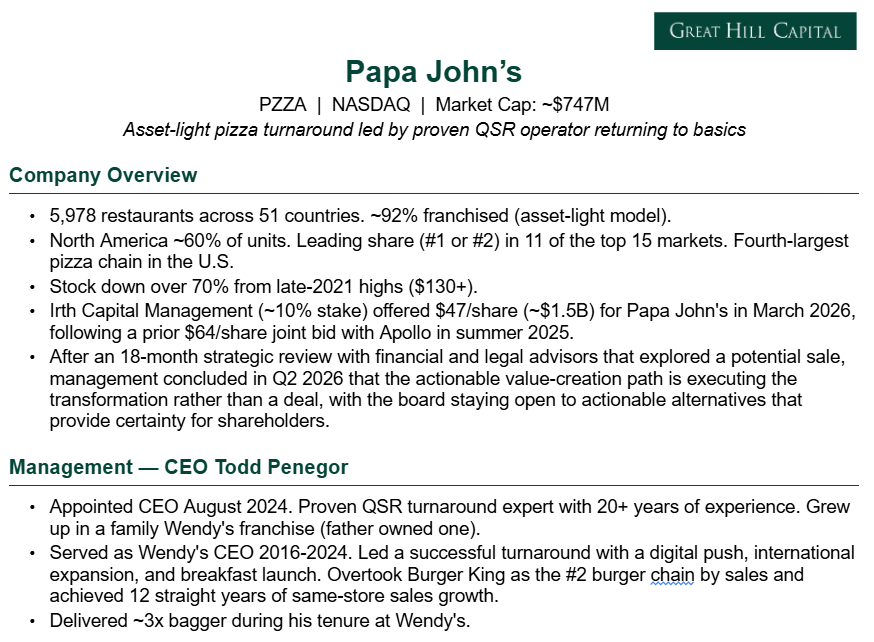
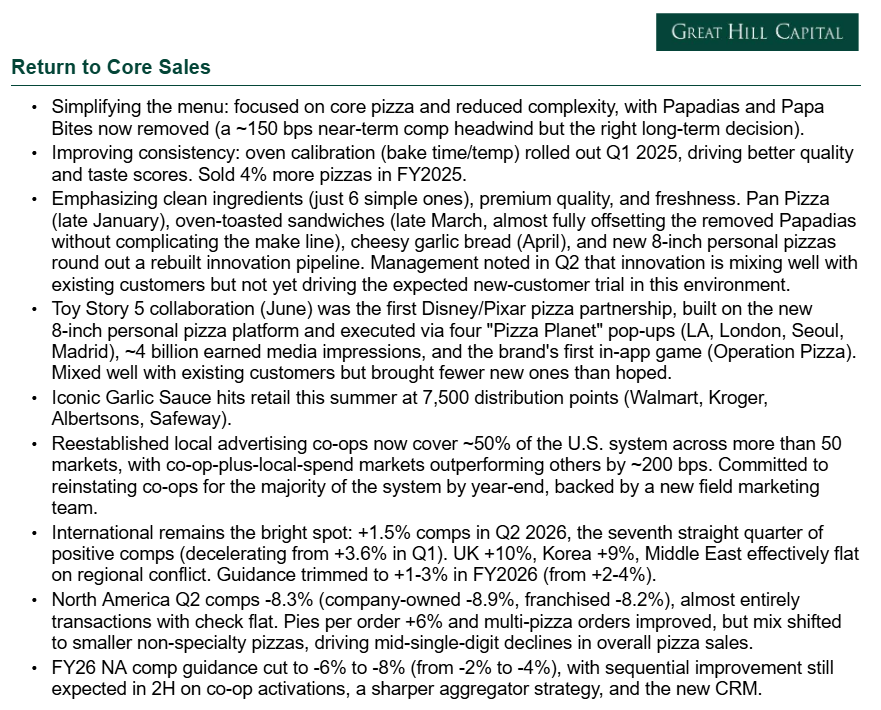
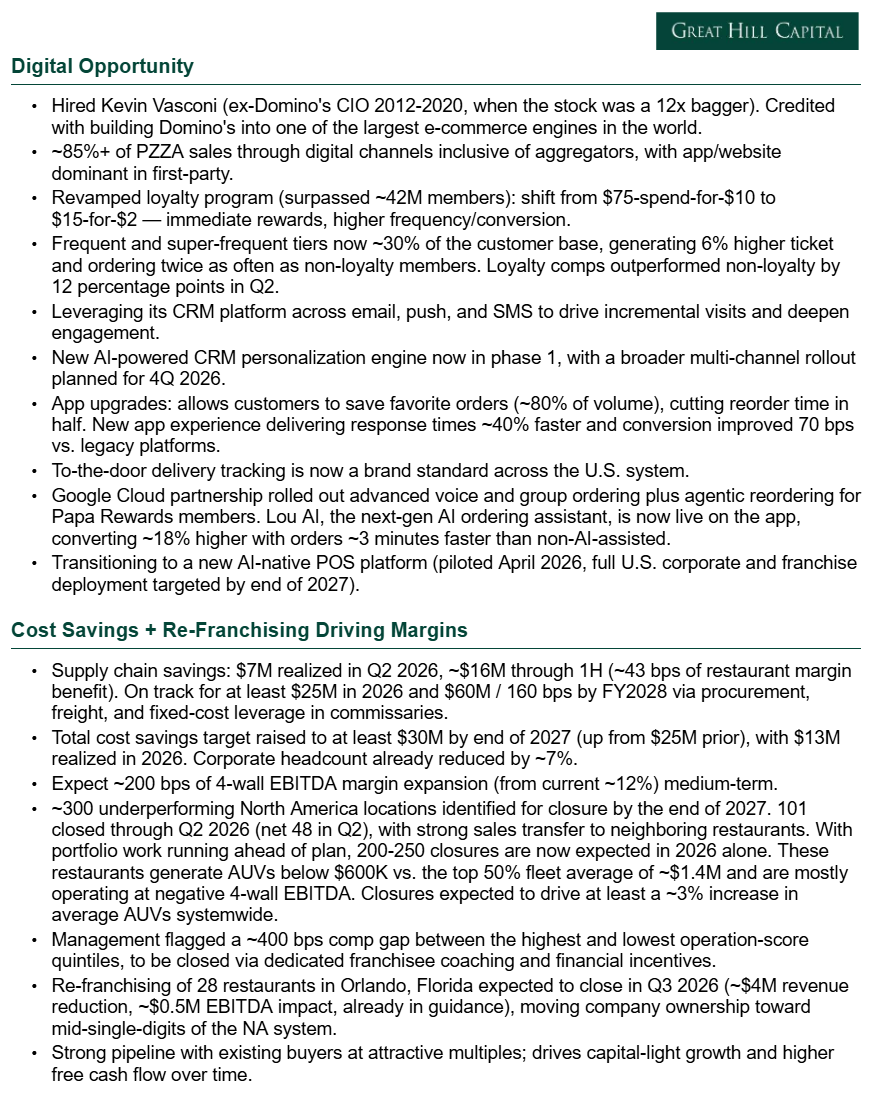
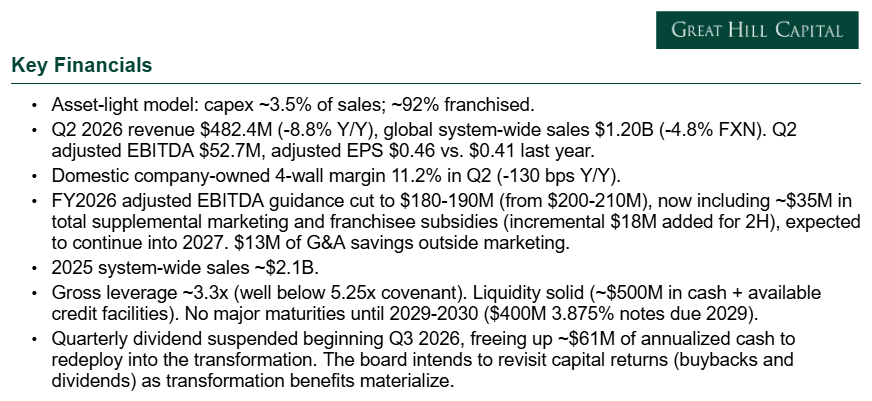
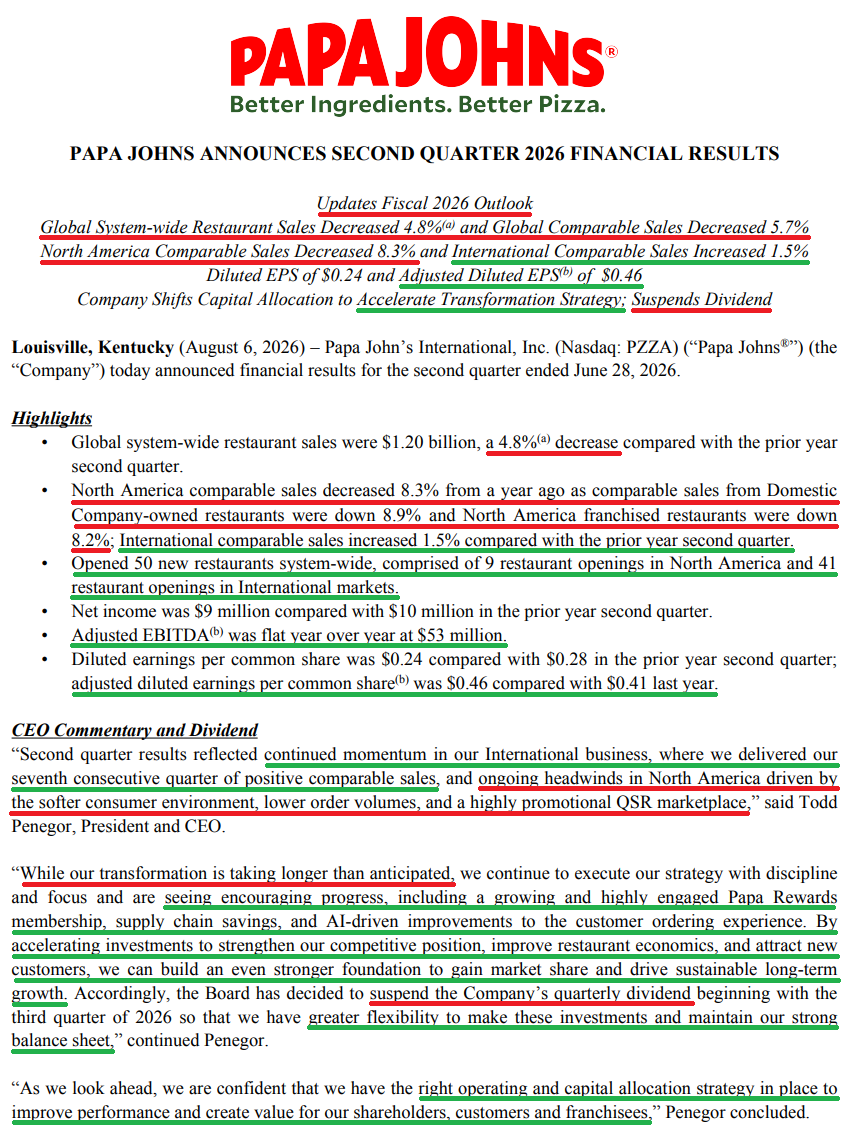
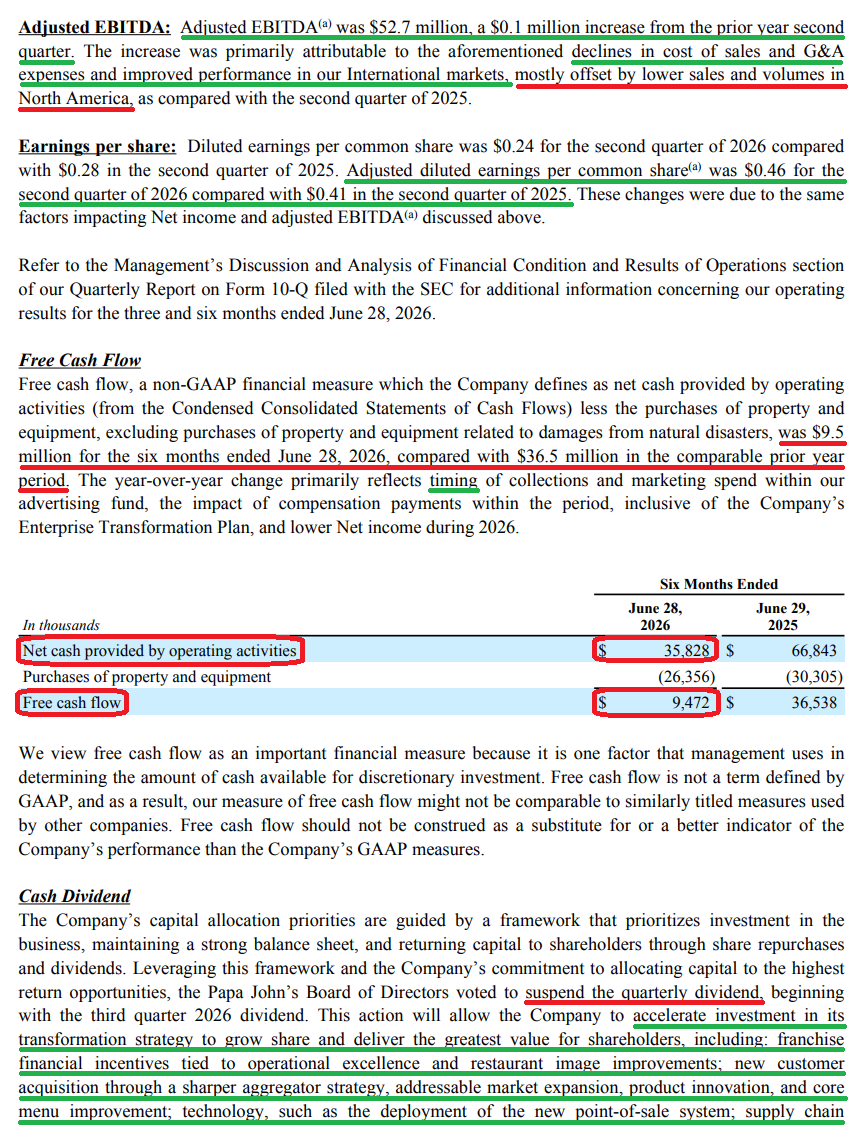
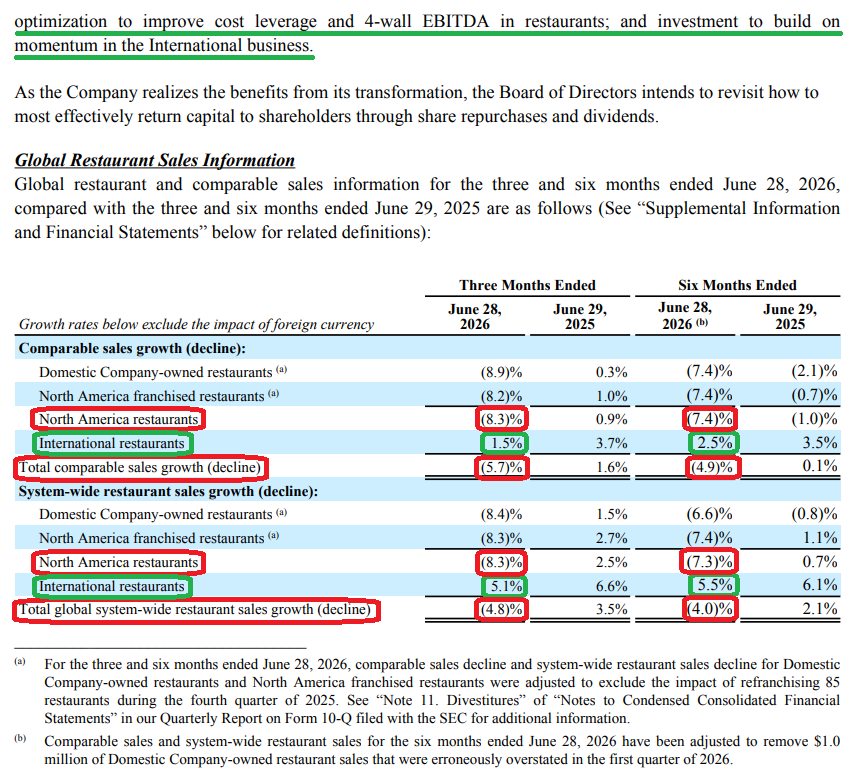
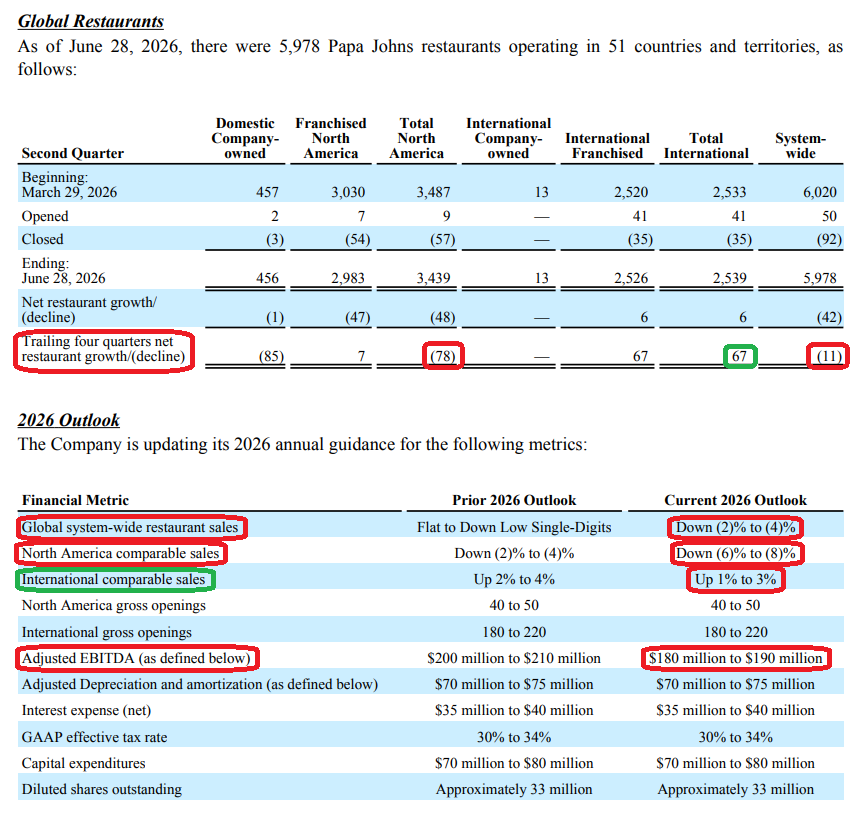
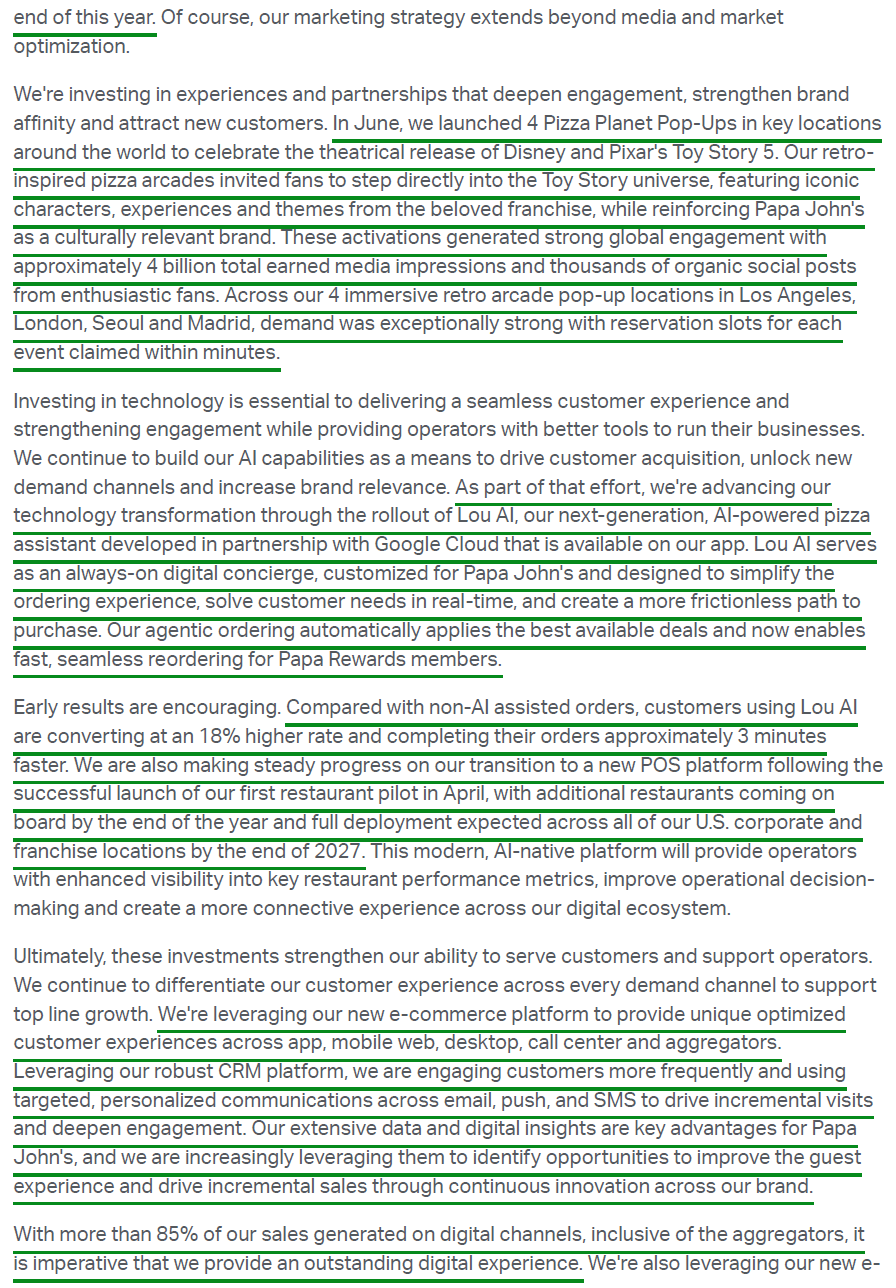
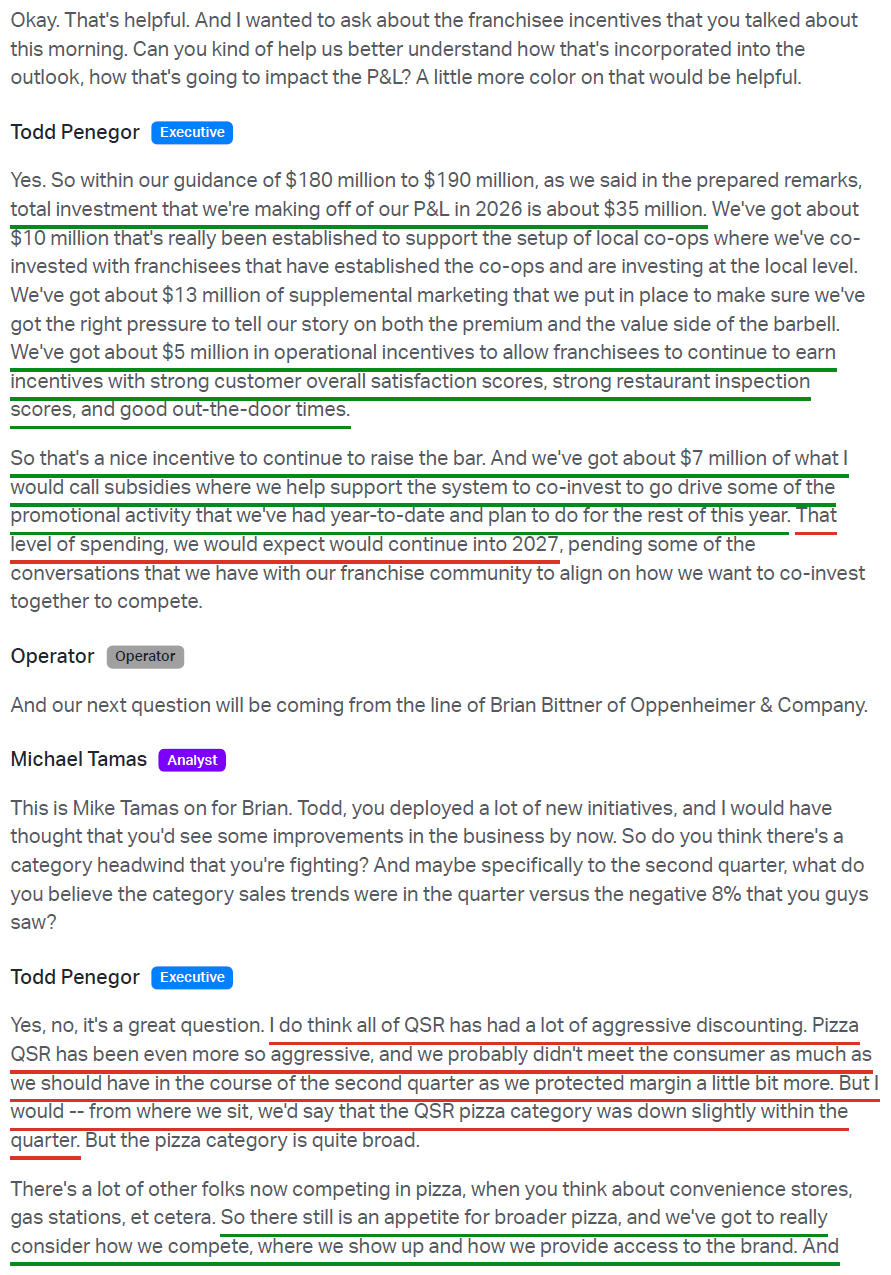
Papa John’s continued to face pressure in the second quarter, as a cautious consumer and increasingly promotional QSR backdrop weighed on results. Revenue came in at $482.4M, down 8.8% Y/Y, as international comps of +1.5% were dragged down by a North America comp of -8.3%, below the ~7% decline the Street had expected. While adjusted EBITDA held flat at $52.7M and adjusted EPS improved to $0.46 from $0.41, neither was enough to keep management from cutting full-year guidance. North America comps were lowered to -6% to -8% from -2% to -4%, international comps to +1% to +3% from +2% to +4%, and adjusted EBITDA to $180M to $190M from $200M to $210M.
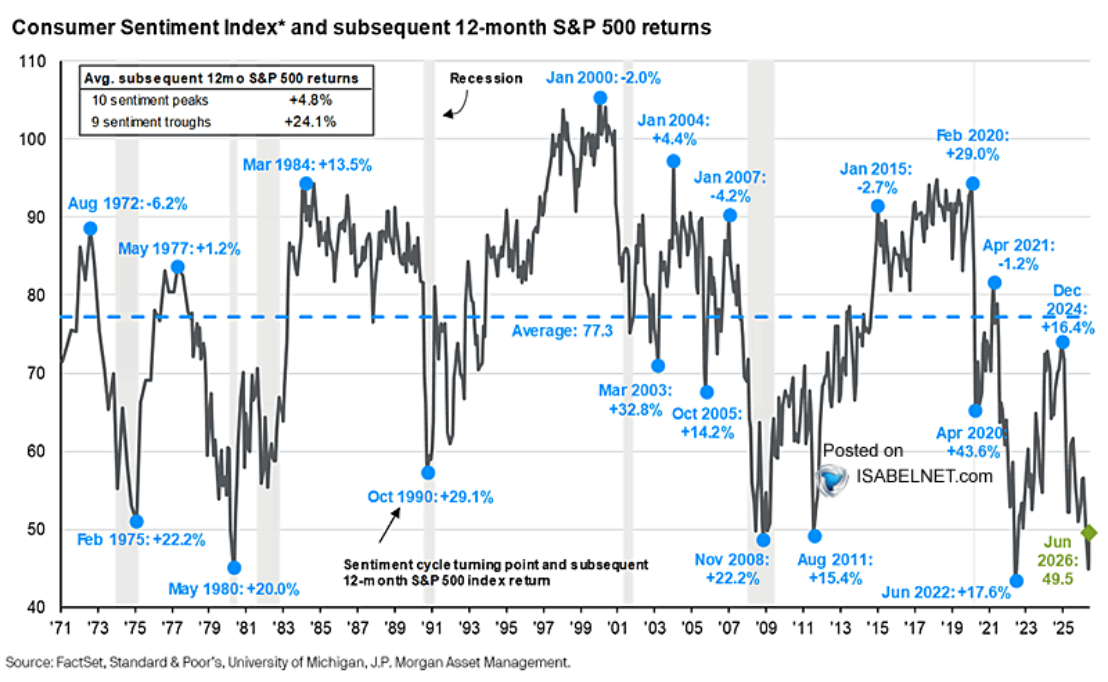
Similar to Advance, Papa John’s core customer is feeling the heat in today’s consumer environment. This is the same lower- and middle-income consumer we have been talking about, already stretched by a tight budget and now facing higher fuel costs that are taking an even bigger bite out of disposable income, all while sentiment sits at washed-out extremes. Papa John’s is hardly alone in feeling the pressure, with names like DPZ, MCD, WING, SHAK, and countless others pointing to the same pressured consumer and increasingly promotional backdrop this quarter.
But as we continue to point out, this is precisely when we want to be ADDING consumer discretionary exposure, when the group is in the gutter and sentiment is in the doldrums. In fact, the last nine sentiment troughs went on to deliver an average 24.1% return over the following twelve months, which is why it pays to be a BUYER when no one else is.
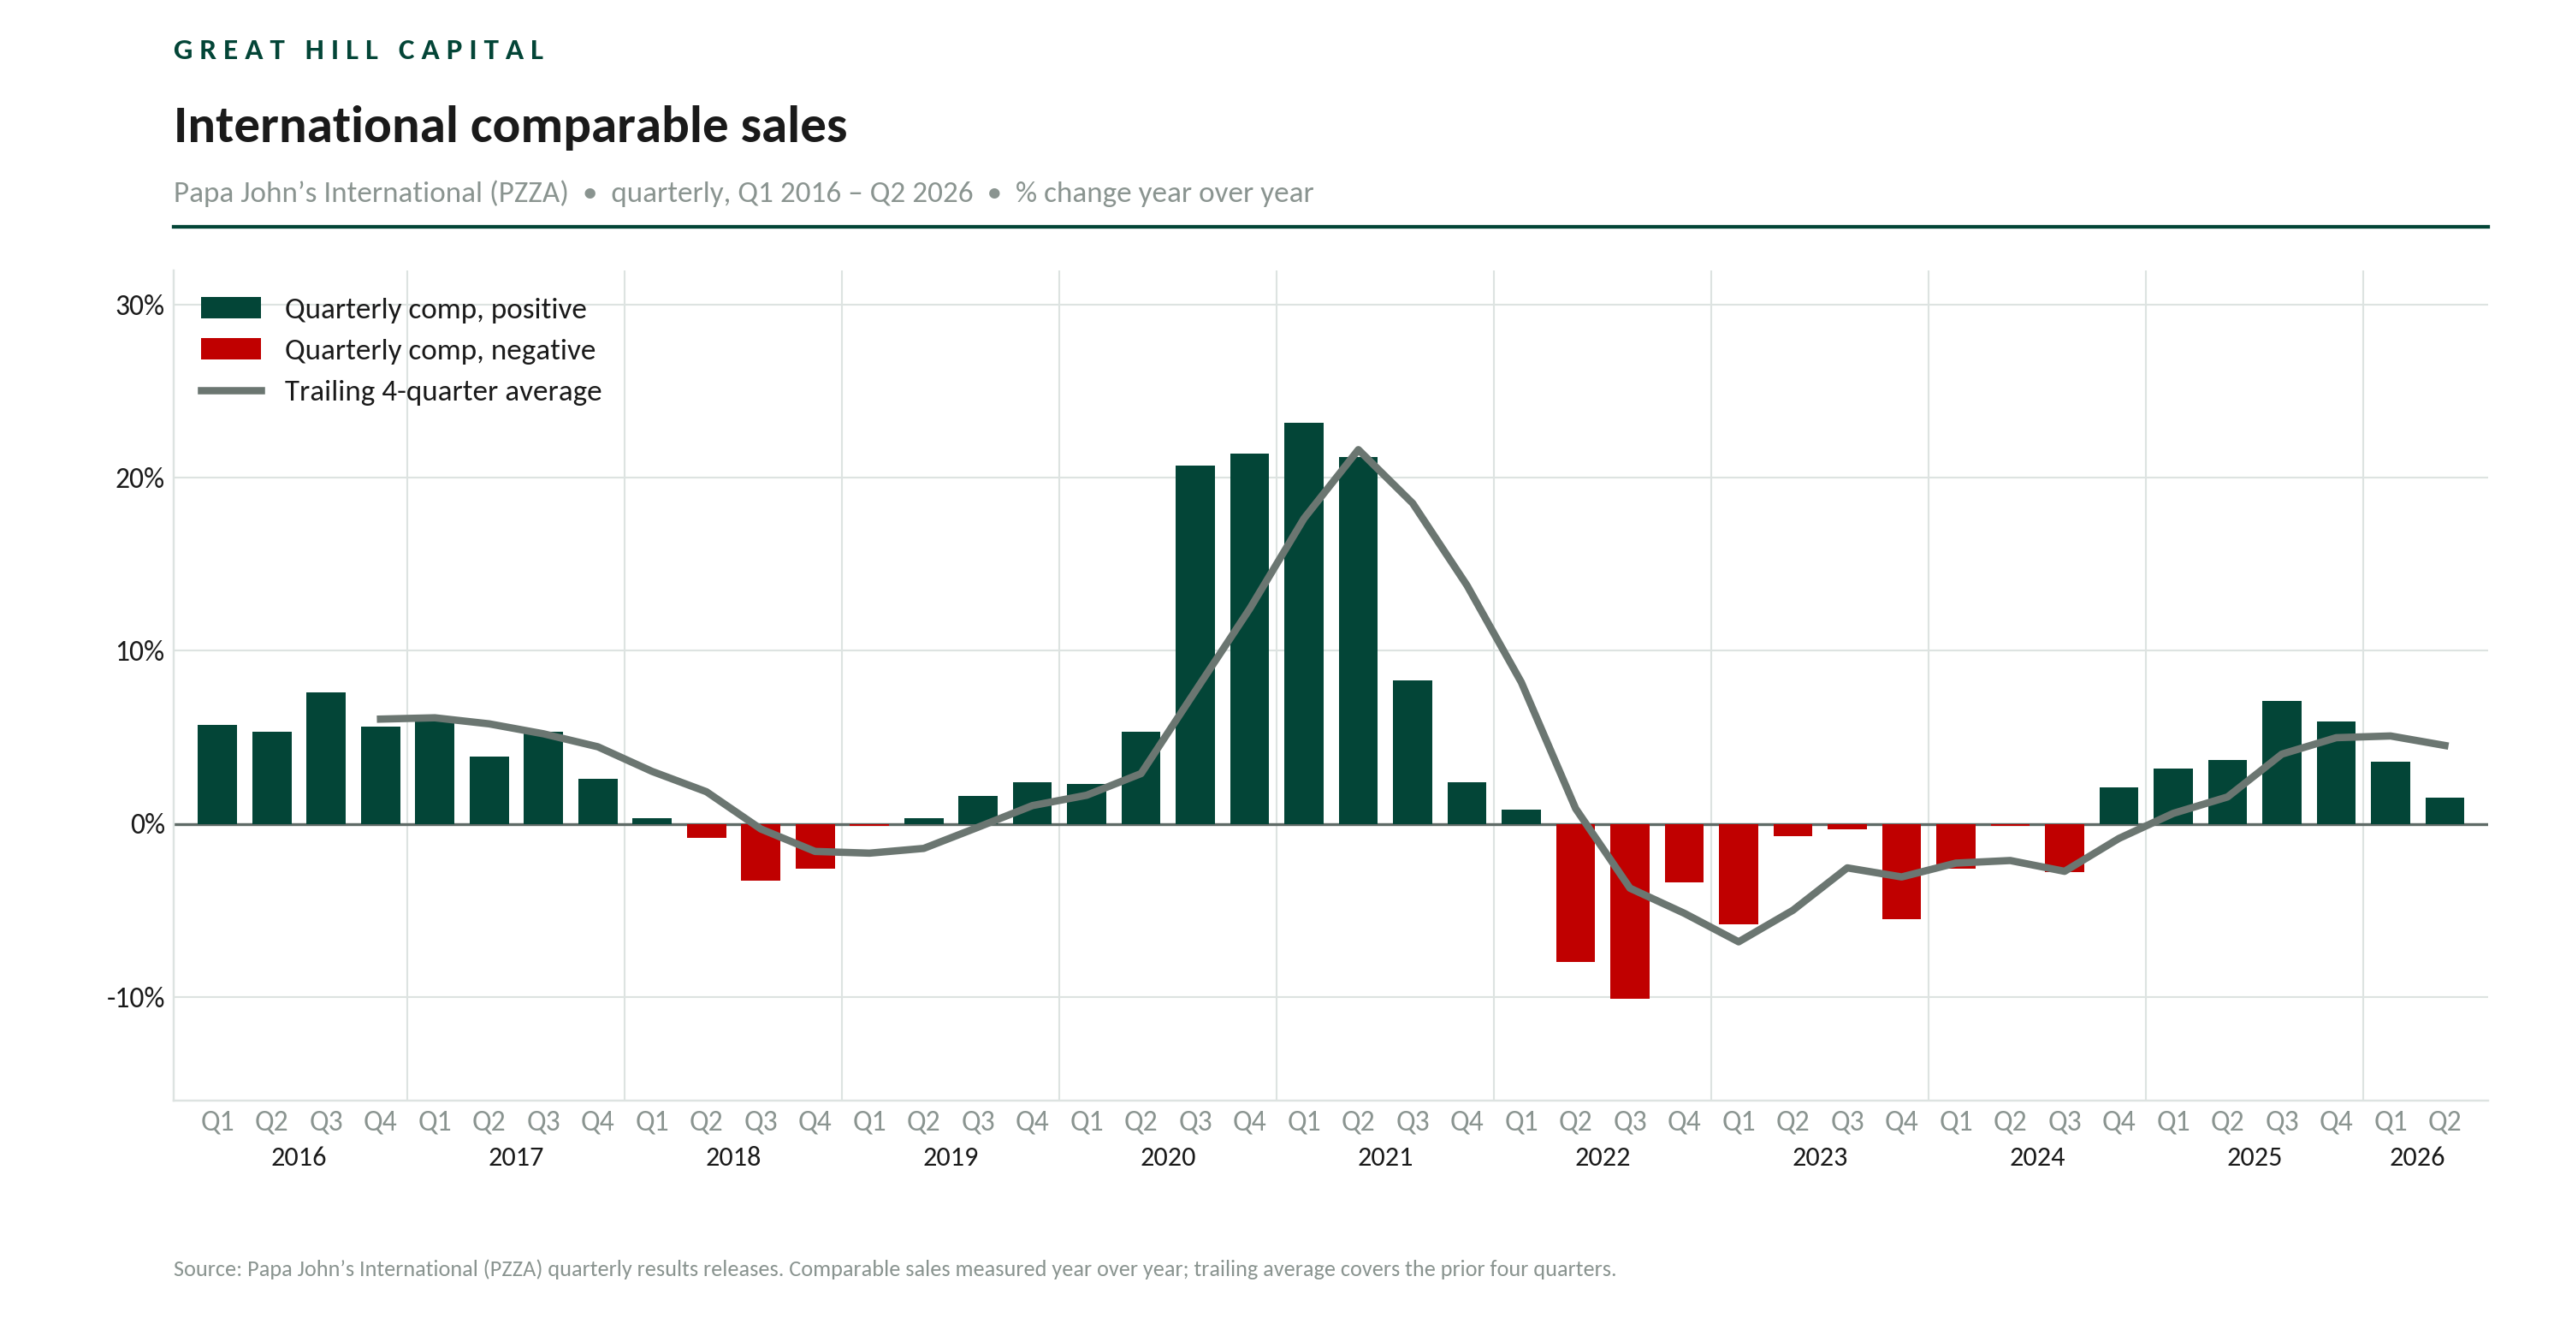
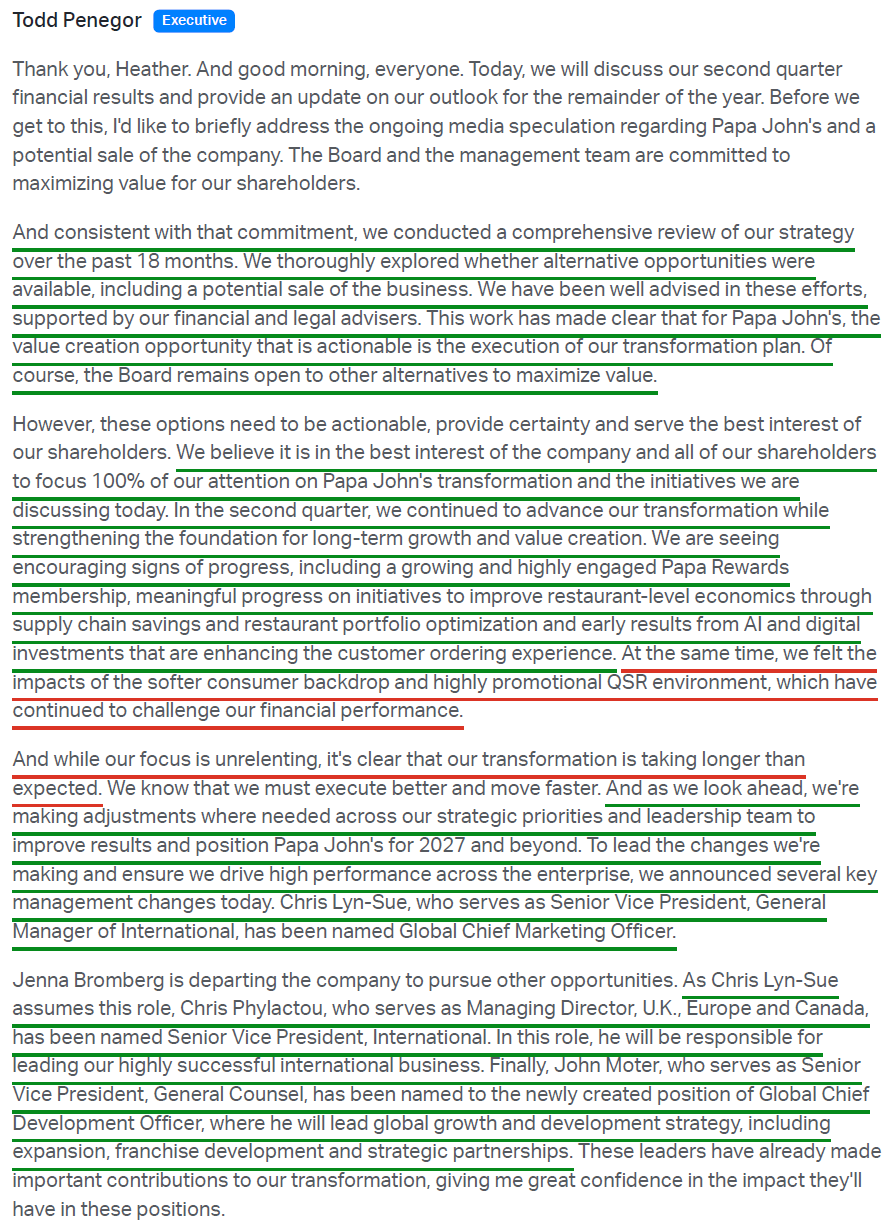
When consumer discretionary exposure is this washed out, expectations alone have already set a low bar. But the real reason we remain highly confident in the Papa John’s turnaround is that management is running a playbook we have already watched work inside this exact company. North America has posted negative comps in nine of the last ten quarters, putting it almost exactly where the international business was during its own turnaround from 2022 through 2024. During that run, international strung together ten consecutive quarters of negative comps, reaching a trough of -10.1% before finally turning. Fast forward to today, and that same business has delivered seven straight quarters of growth, with comps up 1.5% this quarter. This was led by the UK, by far the largest international market, with +10% comps for the second straight quarter of double-digit growth, while Korea, the second-largest international market, grew 9%.
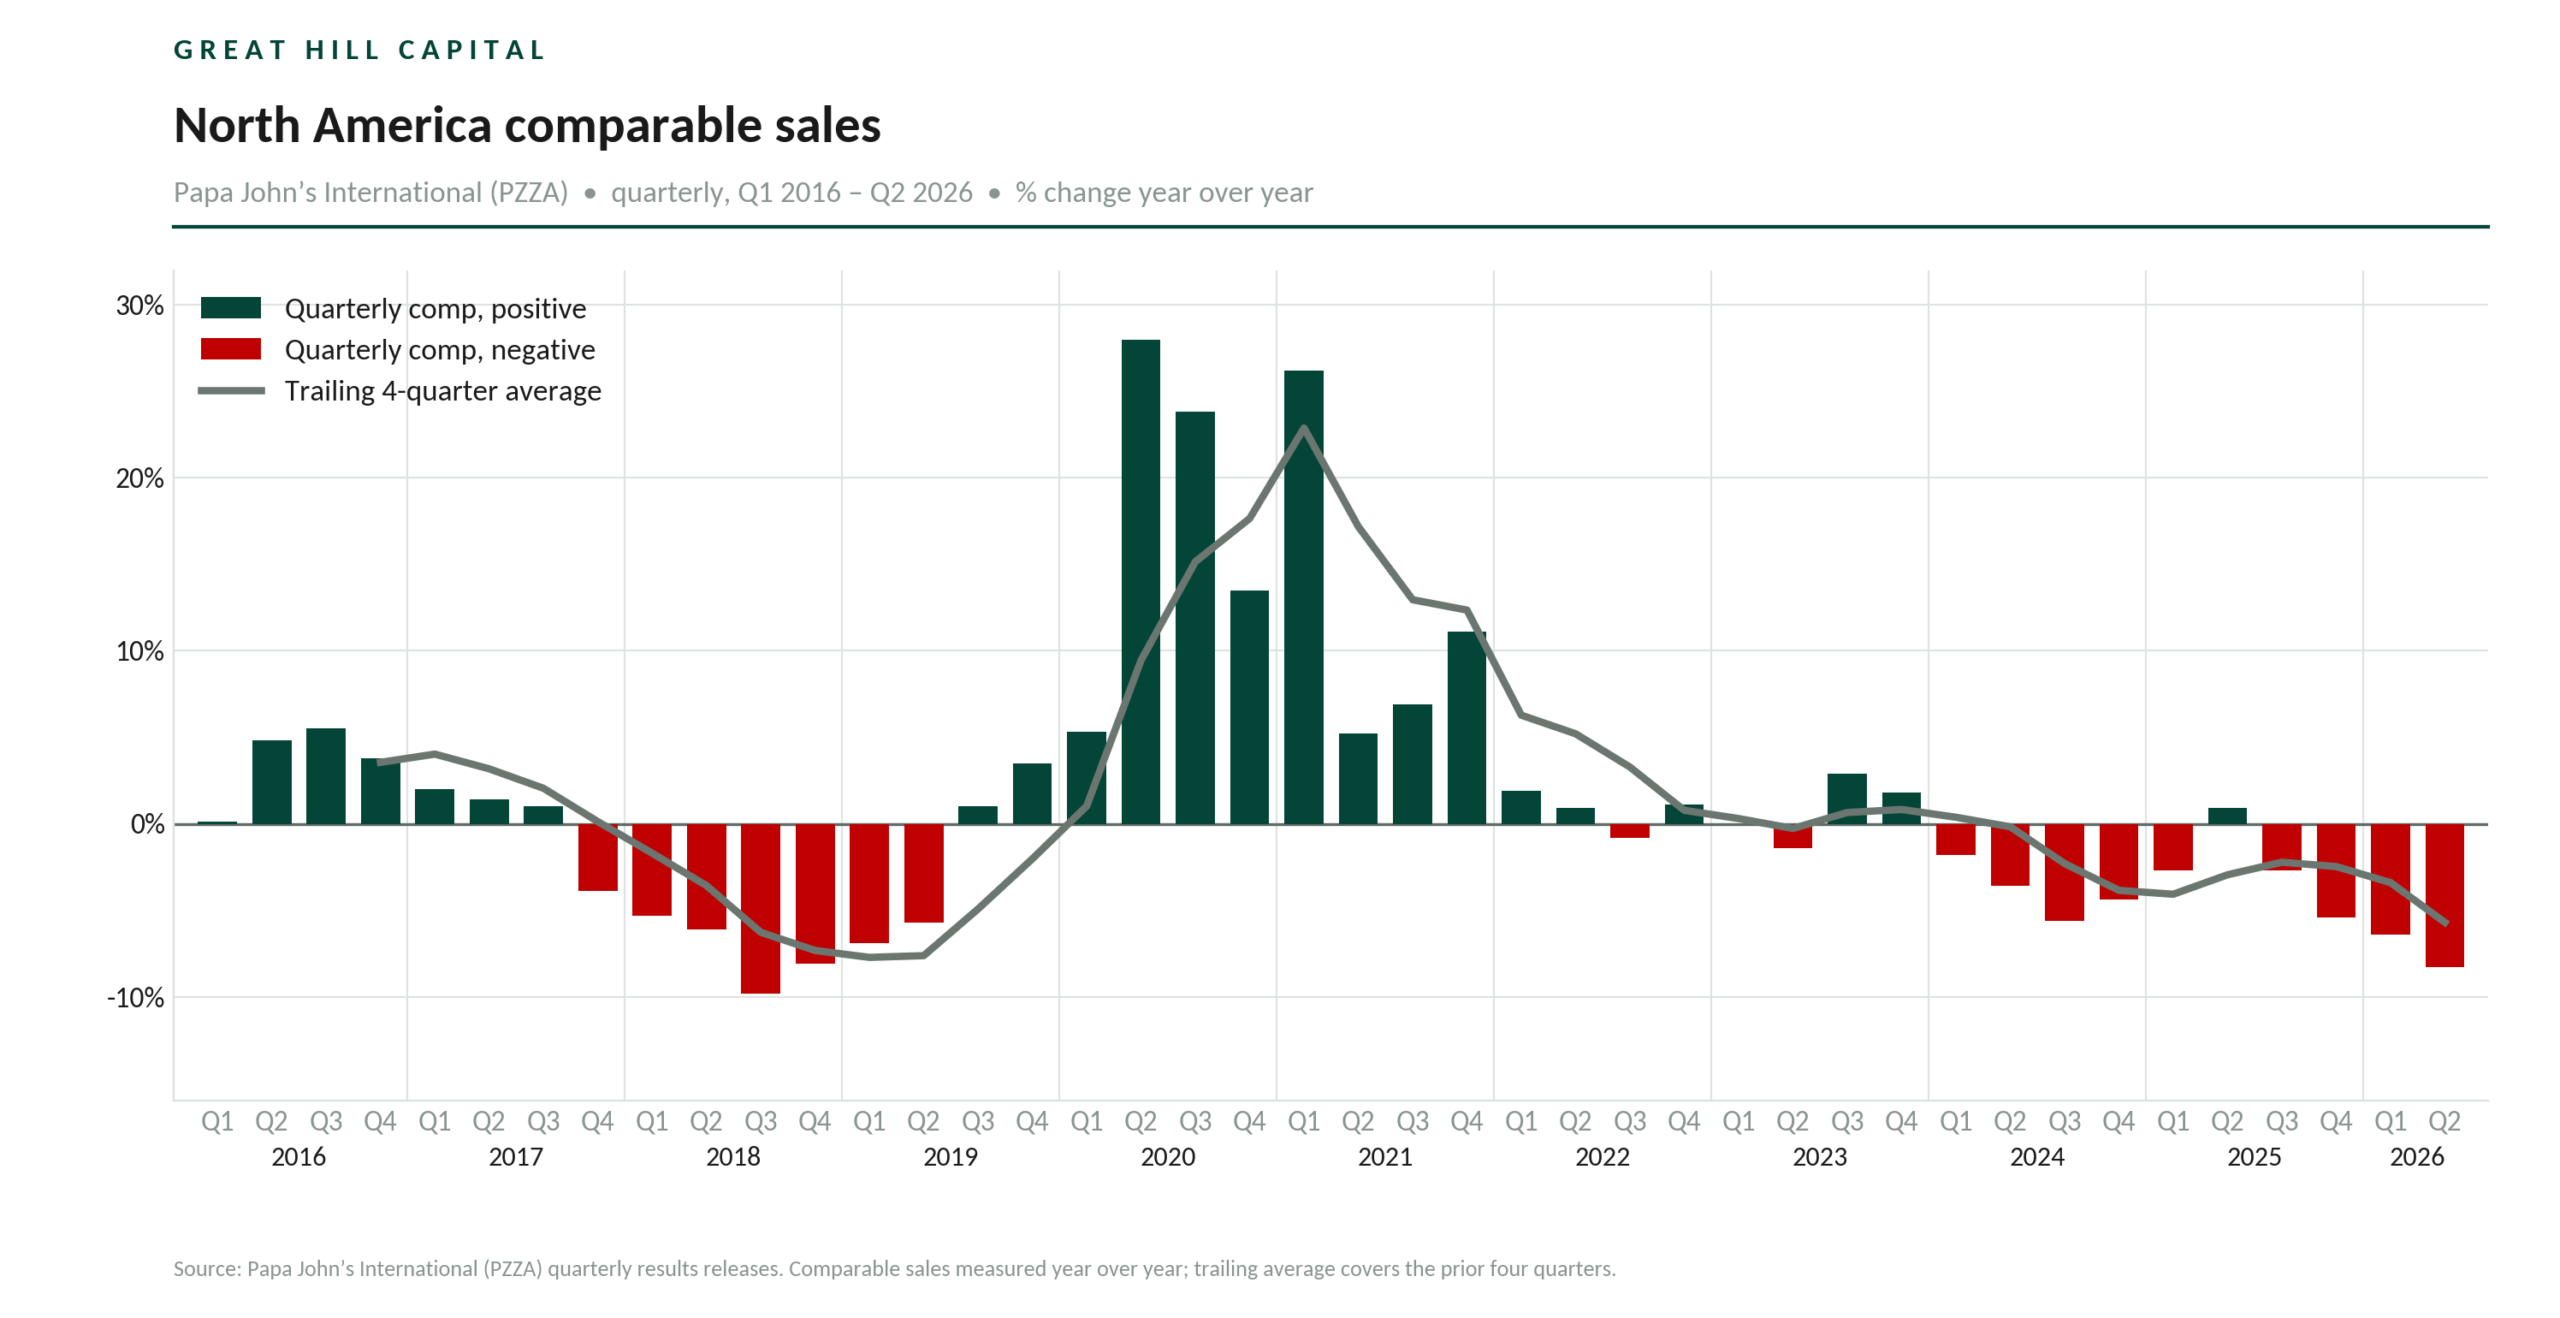
The playbook behind those results was launched in December 2023 as the International Transformation Plan, which focused on three things: closing structurally unprofitable restaurants, exiting poorly performing franchisees, and refranchising viable company-owned locations to proven operators. With a healthier system and lighter capital structure in place, management then reinvested behind what remained through marketing, innovation, and operational execution.
The UK, with 451 restaurants representing 18% of the international system and ~1.6x the next-largest market, offers the clearest example. Papa John’s refranchised 60 company-owned restaurants there, primarily to existing franchisees, taking company ownership down to just 13 locations and subsequently driving a 17% increase in average unit volumes from 2023 to 2025.
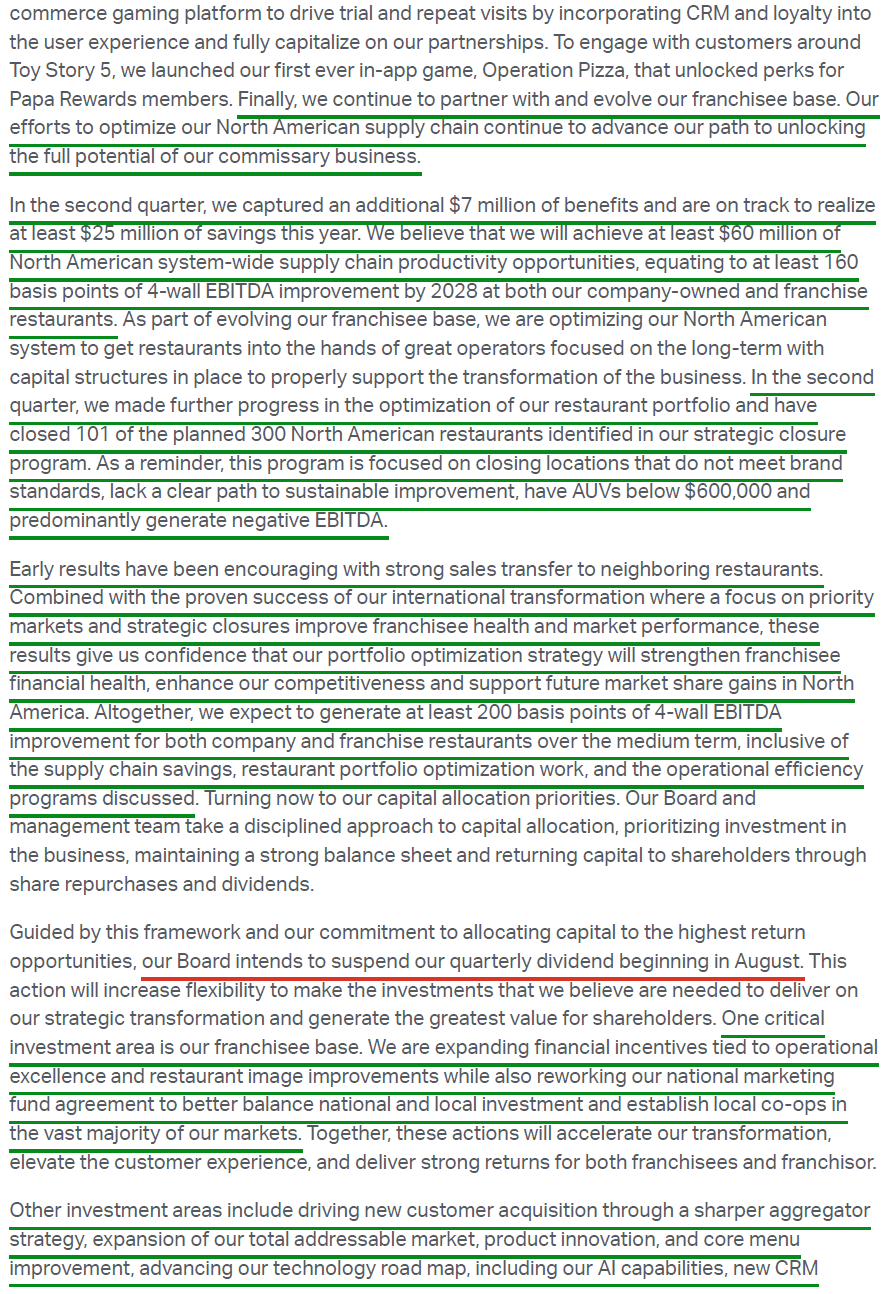
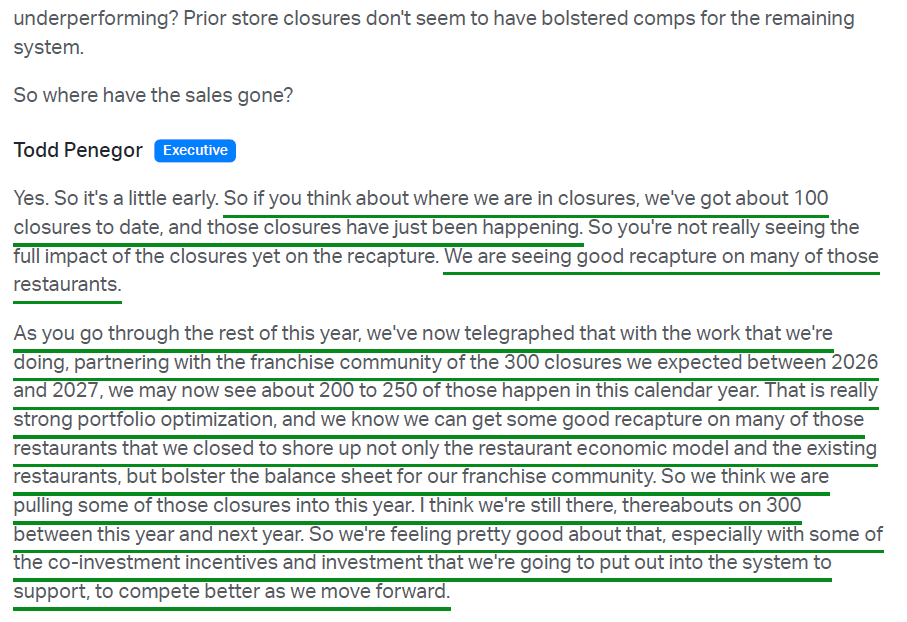
That proven playbook is now being run in North America, starting with the same portfolio cleanup that laid the foundation for the international turnaround. Of the 300 underperforming restaurants identified for closure, 101 have already been taken out, with the pace now running ahead of plan as management expects to close 200 to 250 in 2026 alone versus an original schedule spread evenly across two years. The targeted locations failed to meet brand standards, with AUVs below $600K versus a top-half fleet average of ~$1.4M and most generating negative 4-wall EBITDA. Encouragingly, early sales transfers to neighboring restaurants have been strong.
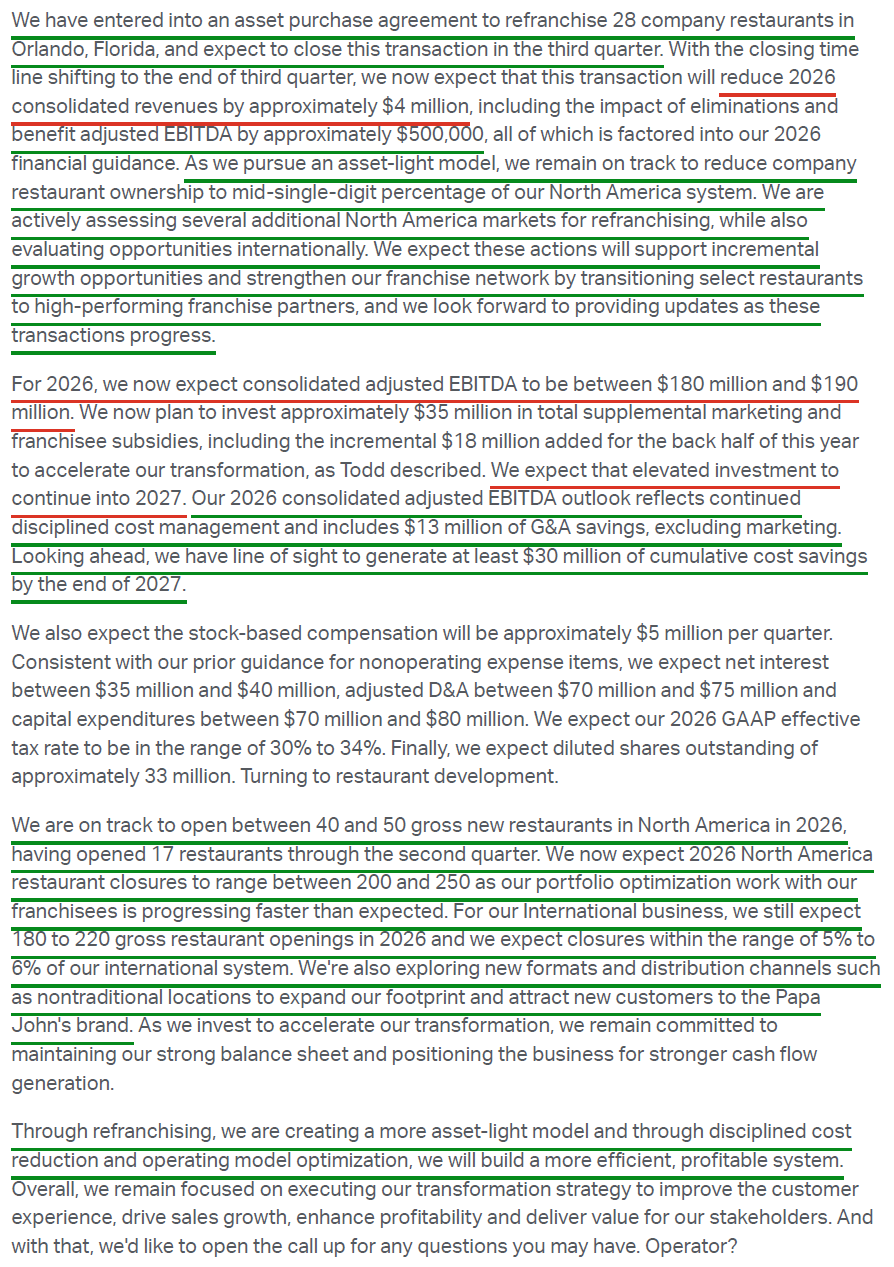
On the refranchising front, management is building on the 85 restaurants refranchised in 2025, closing on another 28-restaurant deal in Orlando during the quarter with one of Papa John’s strongest franchisees, Wade Oney. Oney was Papa John’s COO from 1994 to 2000, has been named Franchisee of the Year multiple times, and now operates more than 120 locations.
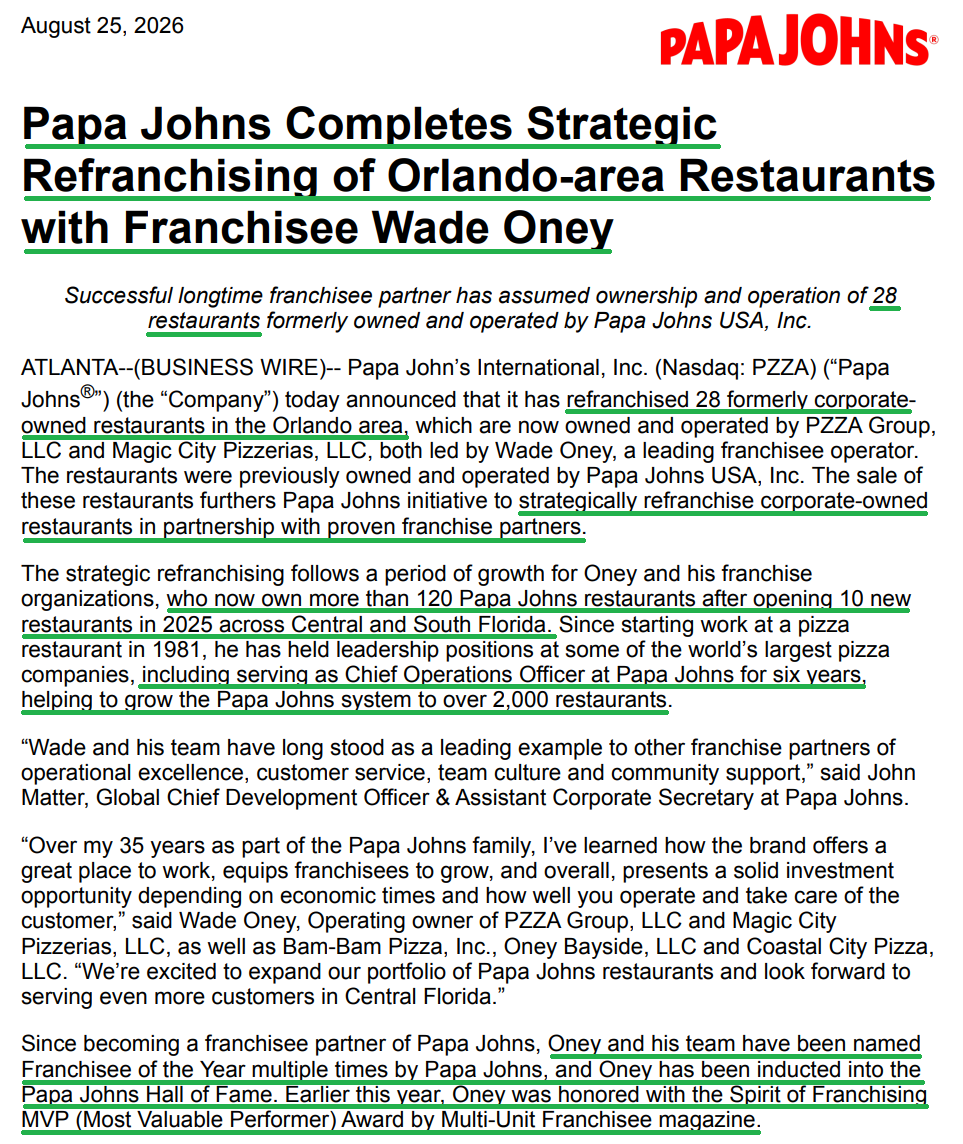
The transaction brings company ownership down to 12.4% of the system, with additional deals in the pipeline across North America and management still targeting a mid-single-digit level. The strategy pivots Papa John’s toward a more capital-light model while putting more restaurants in the hands of proven operators who can drive stronger execution.
Alongside the portfolio cleanup, management is taking significant cost out of the system. Supply chain savings reached $16M through the first half (~43 bps of restaurant margin), putting the company on track for at least $25M of savings by the end of 2026 and at least $60M over the next two years. On the corporate side, the workforce has already been reduced by ~7%, with $13M of G&A savings expected in 2026 as part of at least $30M identified across 2026 and 2027, exclusive of marketing. Put together, management expects at least 200 bps of 4-wall EBITDA margin improvement from the current ~12% over the medium term.
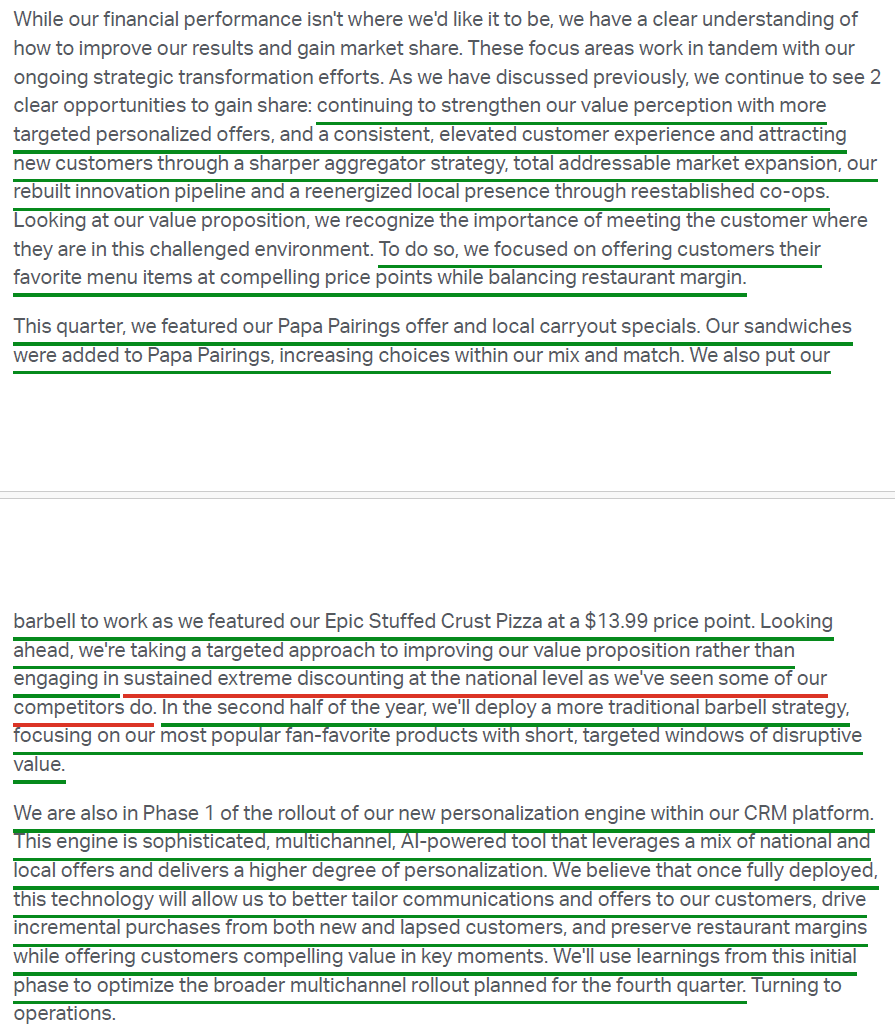
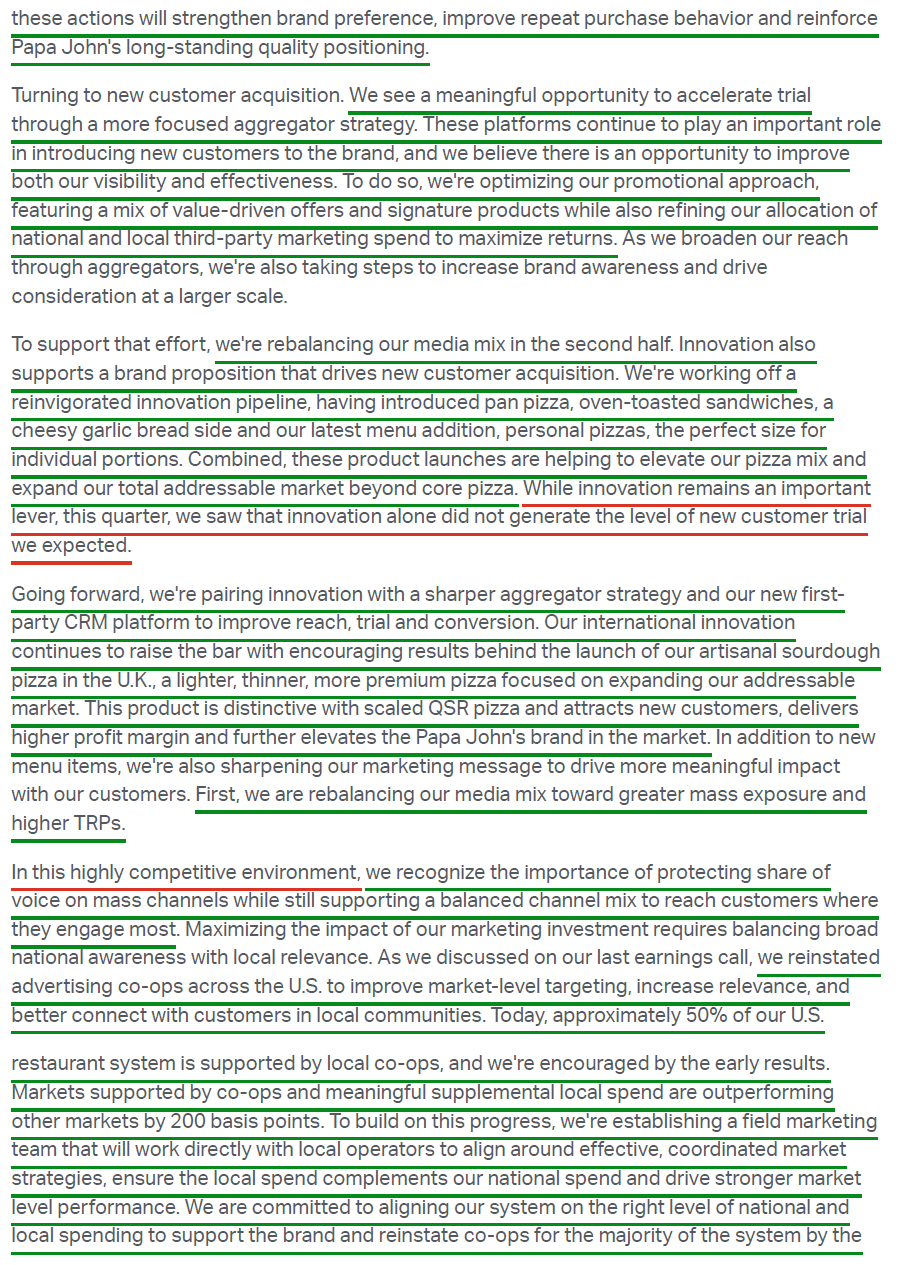
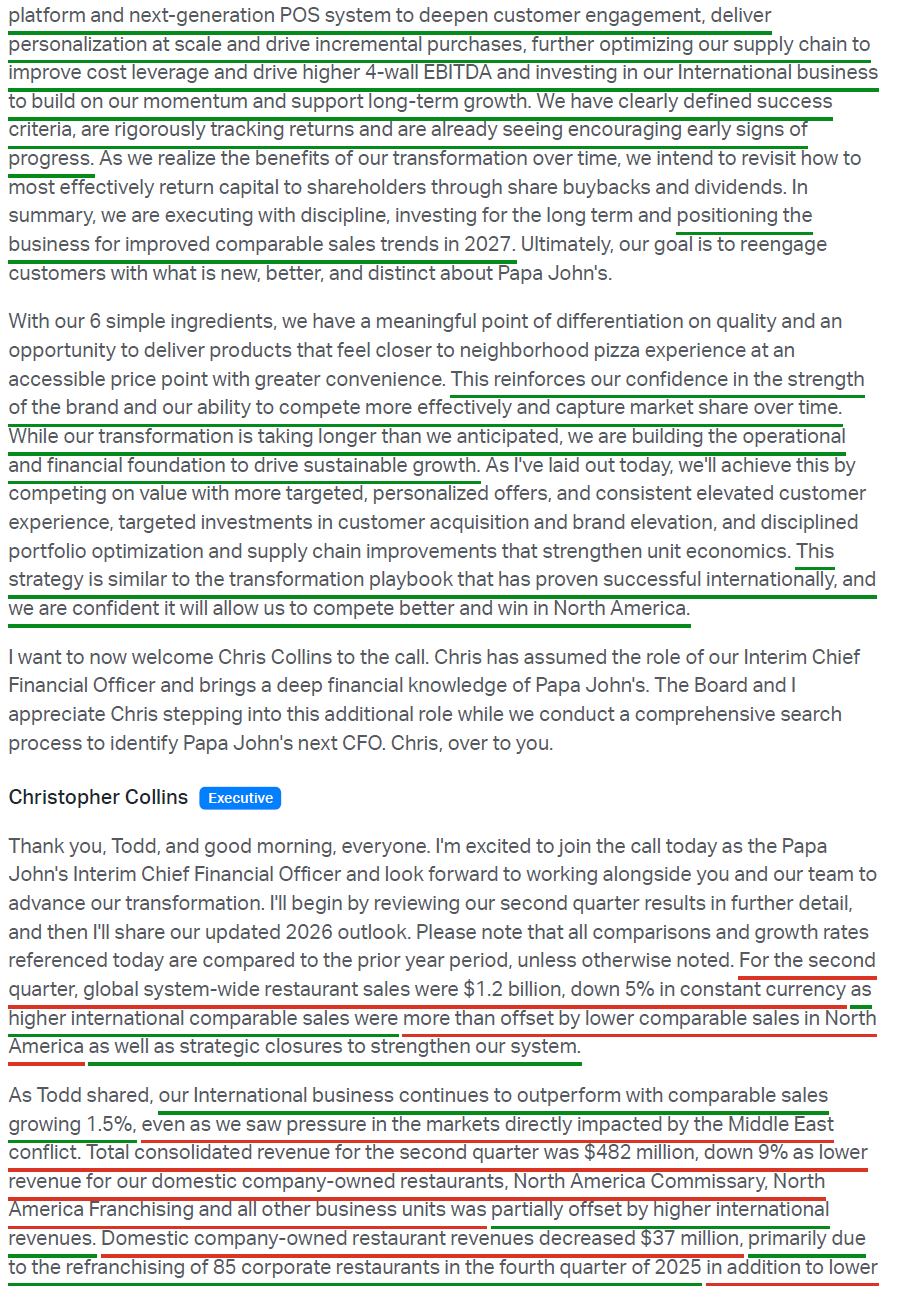
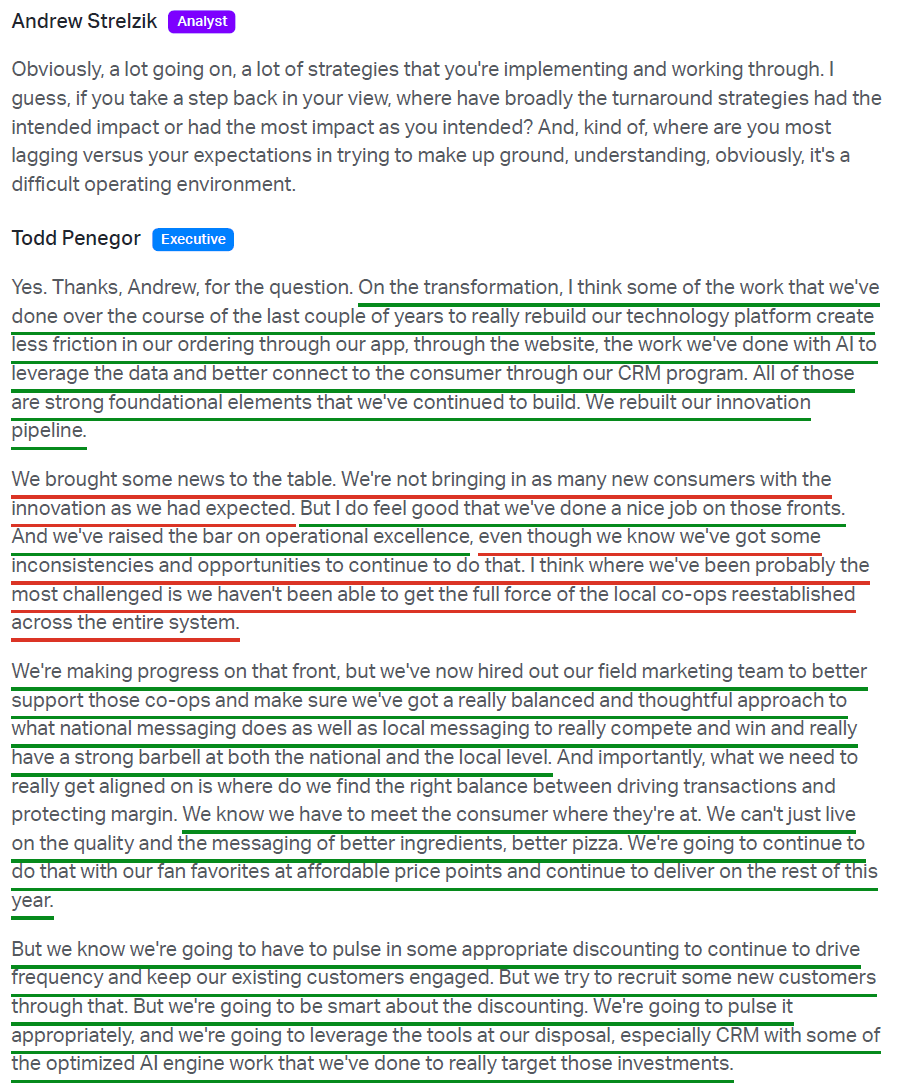
Then comes what we think is the most underappreciated piece of the North America turnaround: bringing back local marketing co-ops. The co-op model allows franchisees within a region to pool their resources and target customers more effectively through localized campaigns. In 2024, prior management moved to a nationally focused model, raising the national marketing fund requirement from 5% to 6% while eliminating the 3% local marketing spend requirement. Todd Penegor called the resulting setup a “big mess,” and one of his first moves as CEO was to begin rebuilding the local co-ops, with ~half the US system covered today and a majority target by year-end. Management is now working to rebalance the mix over time, reducing the national contribution while reinstating a mandated local marketing spend. Franchisees participating in the co-ops are already spending an additional 1.5% to 2% locally, and more importantly, the results are showing up in comps, with co-op markets outperforming the rest of the system by ~200 bps.
All of this brings us to the headline that grabbed the most attention this quarter: the suspension of the quarterly dividend beginning in Q3. While the dividend cut drew the headlines, this was not a forced decision due to any solvency risk. Liquidity sits at ~$500M, the covenant leverage ratio is 3.3x versus a 5.25x covenant, and there are no major maturities until 2029. Instead, it was a reallocation of capital to fund the turnaround, freeing up ~$61M of annual cash to reinvest in the highest-return opportunities across the system, from franchisee incentives and local co-ops to the new POS and CRM platforms and further supply chain optimization. It is a familiar move we have seen many times in the early innings of a turnaround, whether it was BAX, VFC, DEO, or XRAY, and one we support at this stage of the PZZA turnaround.
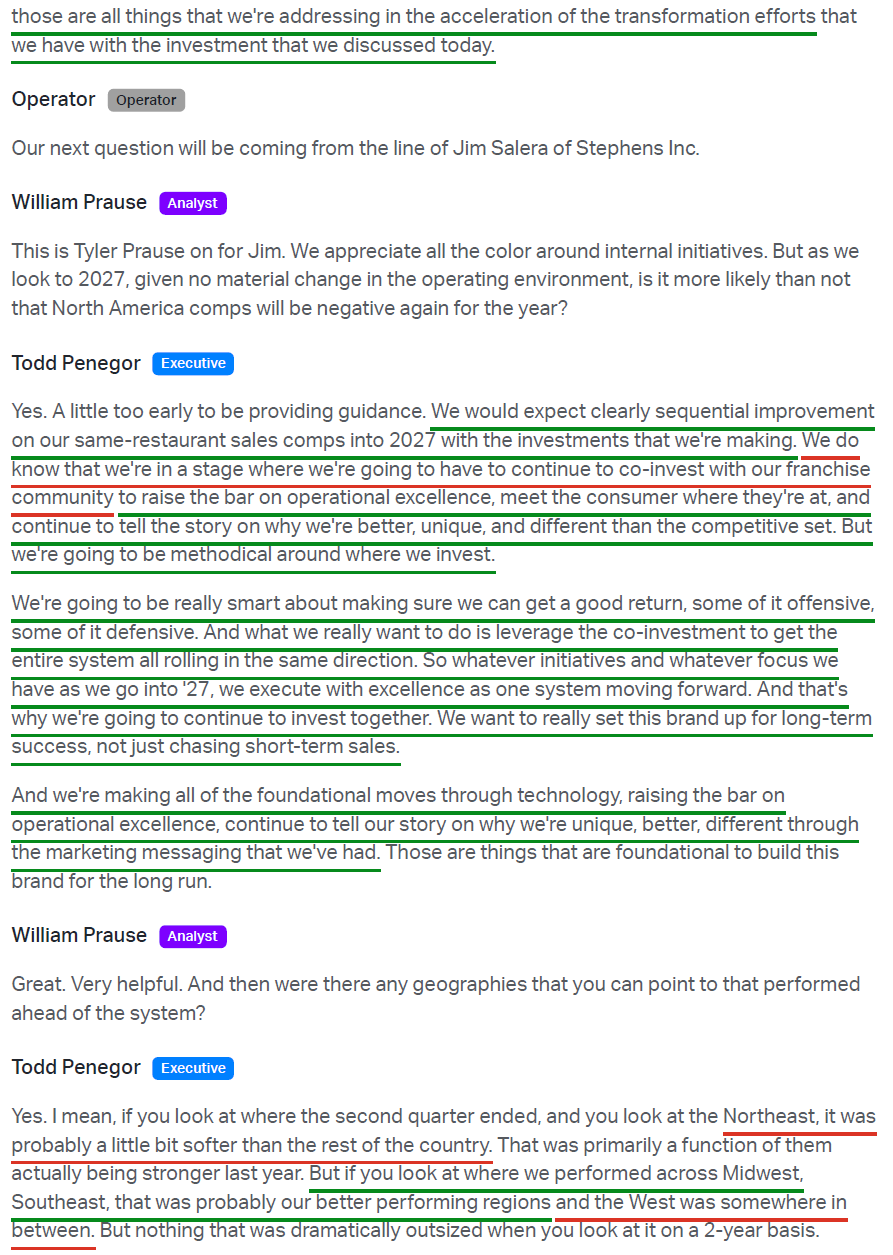
While near-term results remain under pressure and the transformation is taking a bit longer than we would have liked, the underlying playbook hasn’t changed. The same three-pronged strategy that took international comps from a trough of -10.1% to seven straight quarters of growth is now being executed in North America. History may not repeat itself, but it often rhymes, and we have plenty of confidence in management’s ability to execute this proven playbook. With Q2 marking the trough and North America comps expected to improve sequentially through the back half and into 2027, we see better days ahead for Papa John’s.
Q2 Earnings Breakdown
10 Key Points
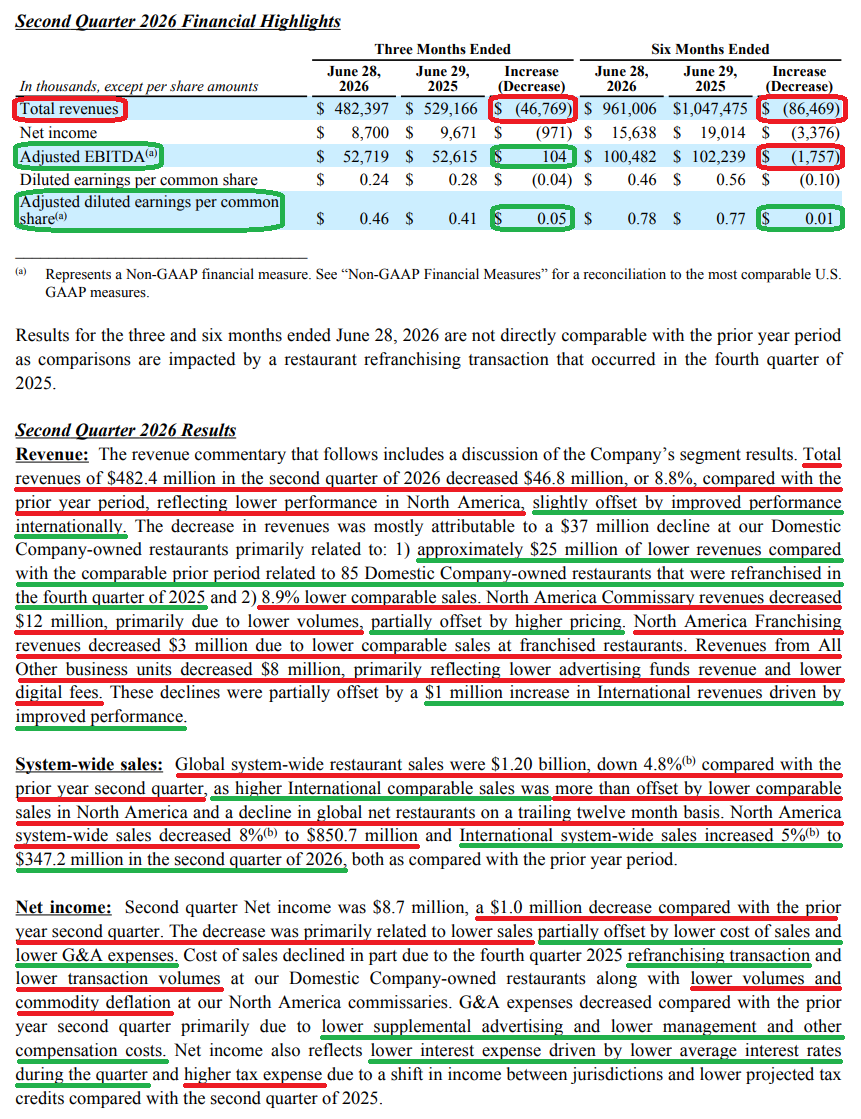
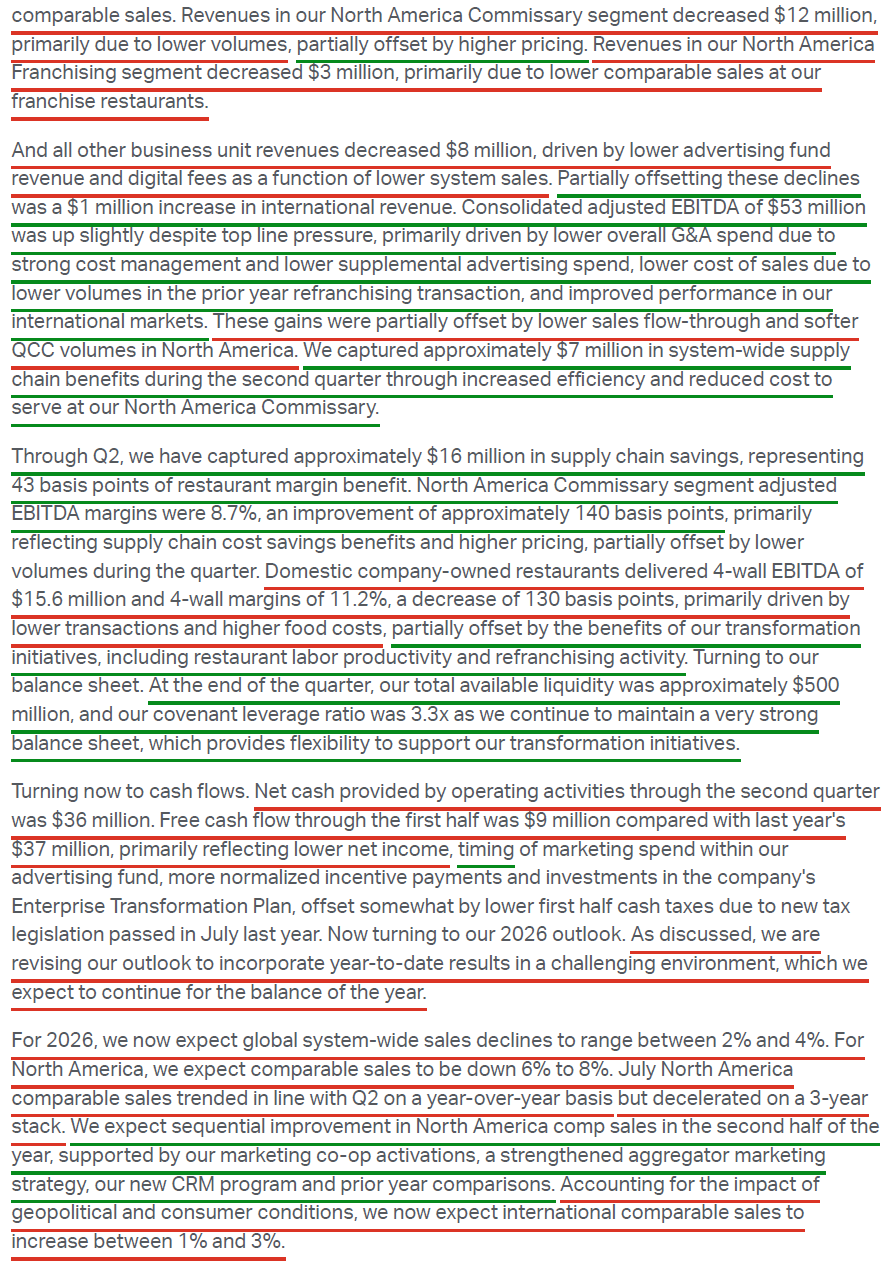
1) Q2 revenue came in at $482.4M (-8.8% Y/Y), essentially in line with consensus of ~$482.0M. The decline was driven by a $37M drop at domestic company-owned restaurants, of which ~$25M was attributable to the Q4 2025 re-franchising of 85 corporate restaurants, with the balance reflecting an 8.9% comp decline at remaining stores. Global systemwide sales were $1.20B (-4.8% Y/Y in C$), with global comps down 5.7%.
2) North America Q2 comps came in at -8.3% Y/Y, below consensus of -7%, as a softer consumer, lower order volumes, and a highly promotional QSR marketplace weighed on results. Company-owned comps declined 8.9% and franchised comps fell 8.2%, pulling NA systemwide sales down 8% to $850.7M. Underlying pizza demand held up in some areas, with pies per order up 6% and multi-pizza orders improving again, though mix shifted toward smaller, non-specialty pizzas, resulting in mid-single-digit declines in overall pizza sales. By channel, third-party aggregators held up best with a low-single-digit decline, followed by carryout, down mid-single digits, while first-party delivery fell double digits.
3) International remains the bright spot, with Q2 comps +1.5% Y/Y, marking seven consecutive quarters of positive comps, though decelerating from +3.6% in Q1 due to Middle East-related pressure. The UK delivered +10% on strong operational execution and increased media investment, while Korea gained +9% on product innovation, strategic partnerships, and holiday demand. The Middle East was effectively flat as ongoing regional conflict pressured performance. International systemwide sales increased 5% in constant currency to $347.2M, with 41 gross openings across the segment during the quarter.
4) Q2 adjusted EBITDA came in at $52.7M, essentially flat Y/Y and modestly below consensus of ~$53.6M. Lower cost of sales, disciplined G&A, including lower supplemental advertising, and improved international performance offset weak NA sales flow-through and softer commissary volumes. Domestic company-owned 4-wall EBITDA was $15.6M at an 11.2% margin, down 130 bps Y/Y on lower transactions and higher food costs, partially offset by labor productivity and re-franchising benefits. NA commissary segment EBITDA margin came in at 8.7%, an improvement of ~140 bps Y/Y on supply chain cost savings and higher pricing, partially offset by lower volumes.
5) Management continues to execute on right-sizing the cost structure, capturing an additional $7M in supply chain savings during Q2 and ~$16M through the first half, representing 43 bps of restaurant margin benefit. PZZA remains on track for at least $25M this year, with at least $60M / 160 bps of 4-wall EBITDA improvement targeted by 2028 across both company-owned and franchise restaurants. The 2026 outlook also includes $13M of G&A savings outside marketing, with line of sight to at least $30M of cumulative cost savings by the end of 2027, keeping PZZA on a path to at least 200 bps of total 4-wall EBITDA improvement over the medium term.
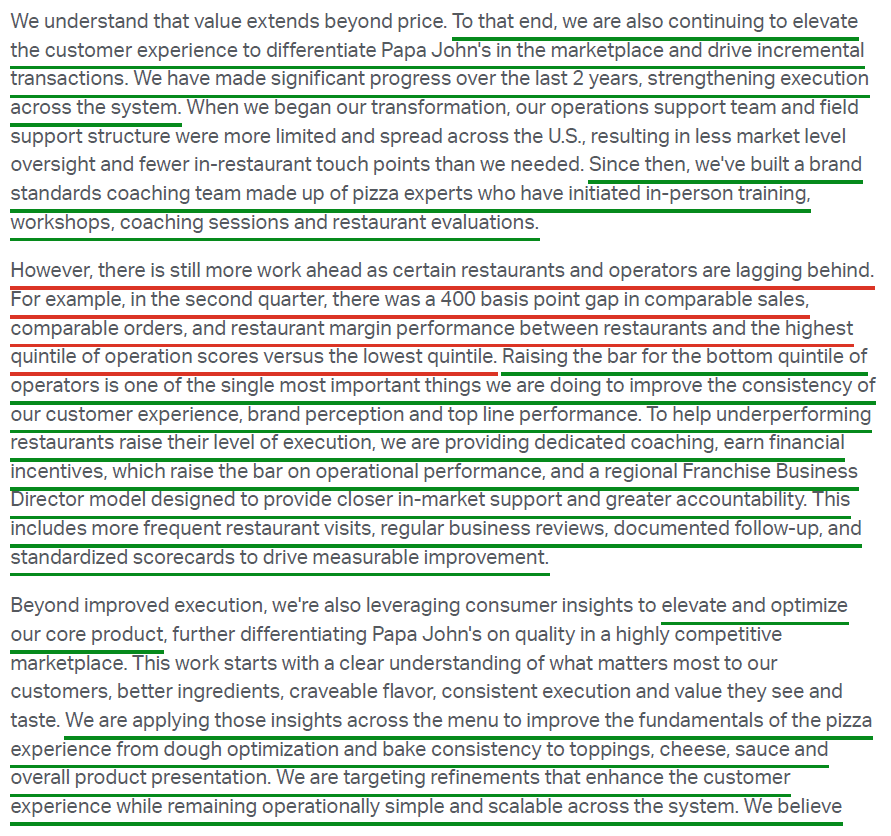
6) PZZA has now closed 101 of the 300 identified underperforming NA locations, with a net 48 closures coming during Q2, and early results showing strong sales transfer to neighboring restaurants. The program targets locations that do not meet brand standards, lack a clear path to sustainable improvement, carry AUVs below $600K, and predominantly generate negative EBITDA. The work is progressing faster than expected, with 2026 NA closures now guided to 200-250 versus the original 300 spread across 2026 and 2027. Management also reiterated the ~400 bps gap in comps, orders, and restaurant margin between the highest- and lowest-operation-score quintiles, which it plans to narrow through dedicated coaching, financial incentives, and a new regional franchise business director model.
7) PZZA’s rebuilt innovation pipeline expanded further this quarter with personal pizzas, joining pan pizza, oven-toasted sandwiches, and cheesy garlic bread. Sandwich sales almost fully offset the removal of Papadias while opening an entirely new food category without complicating the make line. The Toy Story 5 collaboration launched in June across four Pizza Planet pop-ups, generating ~4B earned media impressions, with reservation slots claimed within minutes. Management was clear that innovation alone did not generate the level of new customer trial expected, with both pan pizza and Toy Story resonating well with existing customers but bringing in fewer new ones. Sandwiches are still viewed as a longer-term opportunity to expand the addressable market.
8) Papa Rewards exceeded 42M members, with loyalty comps outperforming non-loyalty customers by 12 percentage points. Loyalty members generate tickets 6% higher per order while ordering ~2x as often as non-loyalty customers, with more than 85% of total sales now generated through digital channels, including aggregators. PZZA is in phase 1 of the rollout of a new AI-powered personalization engine within its CRM platform, with learnings feeding a broader multi-channel rollout planned for Q4. Lou AI, the next-generation ordering assistant built with Google Cloud (GOOGL), is converting at an 18% higher rate, with orders completed ~3 minutes faster. On the operator side, the new AI-native POS platform completed its first restaurant pilot in April, with additional restaurants onboarding this year and full deployment across all US corporate and franchise locations expected by the end of 2027.
9) The board voted to suspend the quarterly dividend beginning in Q3 2026, freeing up ~$61M of annualized cash to redeploy into franchisee incentives, customer acquisition, technology, supply chain, and international investment, with the intent to revisit repurchases and dividends as transformation benefits are realized. The balance sheet remains sound, with total available liquidity of ~$500M and a covenant leverage ratio of 3.3x. First-half free cash flow was $9.5M versus $36.5M in the prior-year period, reflecting lower net income, the timing of collections and marketing spend within the advertising fund, and compensation payments tied to the Enterprise Transformation Plan.
10) FY26 guidance was cut across the board, with global systemwide sales now expected to fall 2% to 4% versus prior guidance of flat to a low-single-digit decline, NA comps of -6% to -8% versus -2% to -4% prior, international comps of +1% to +3% versus +2% to +4% prior, and adjusted EBITDA of $180M to $190M versus $200M to $210M prior. The revised outlook absorbs an incremental $18M of back-half investment, bringing total supplemental marketing and franchisee subsidies to ~$35M for the year, a level expected to continue into 2027. Gross openings were maintained at 40 to 50 in NA and 180 to 220 internationally, with management guiding to sequential NA comp improvement in the back half on co-op activations, a sharper aggregator strategy, the new CRM program, and easier comps, extending into 2027 as the investments take hold.
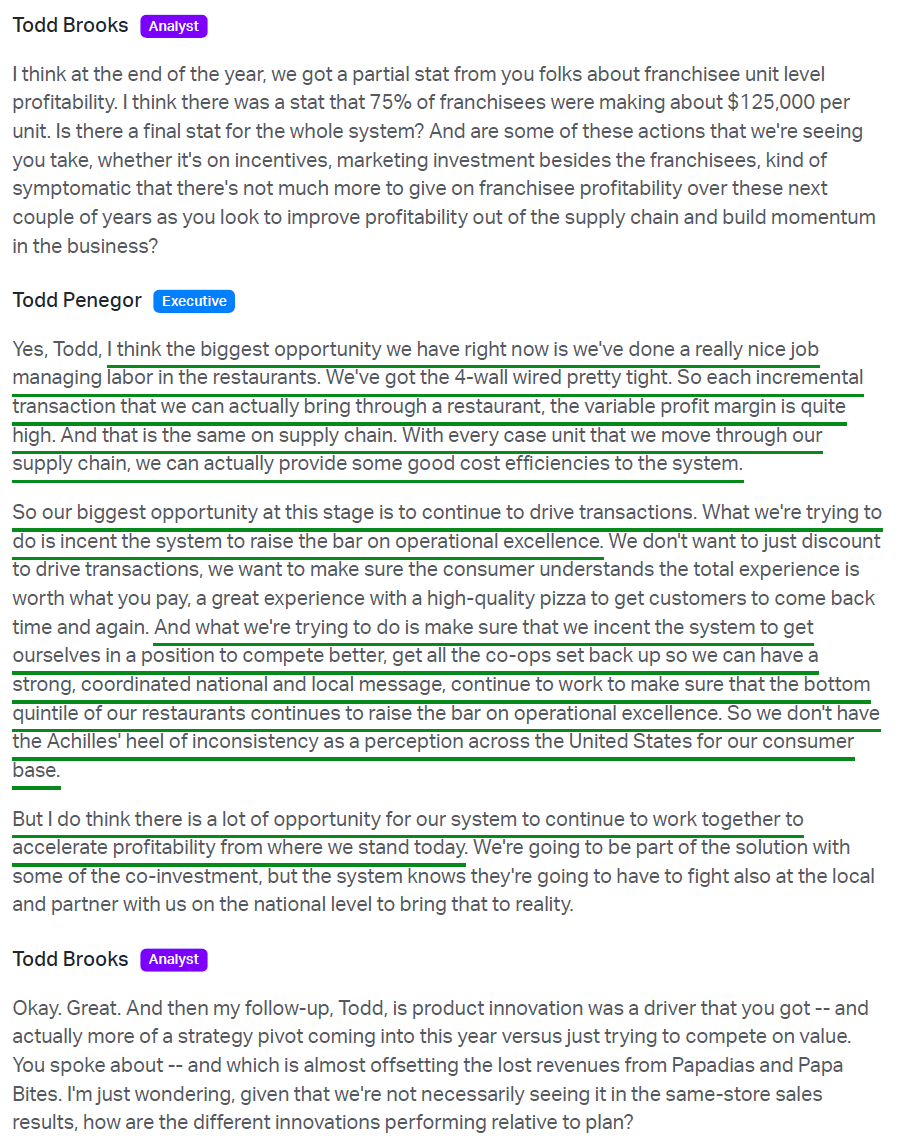
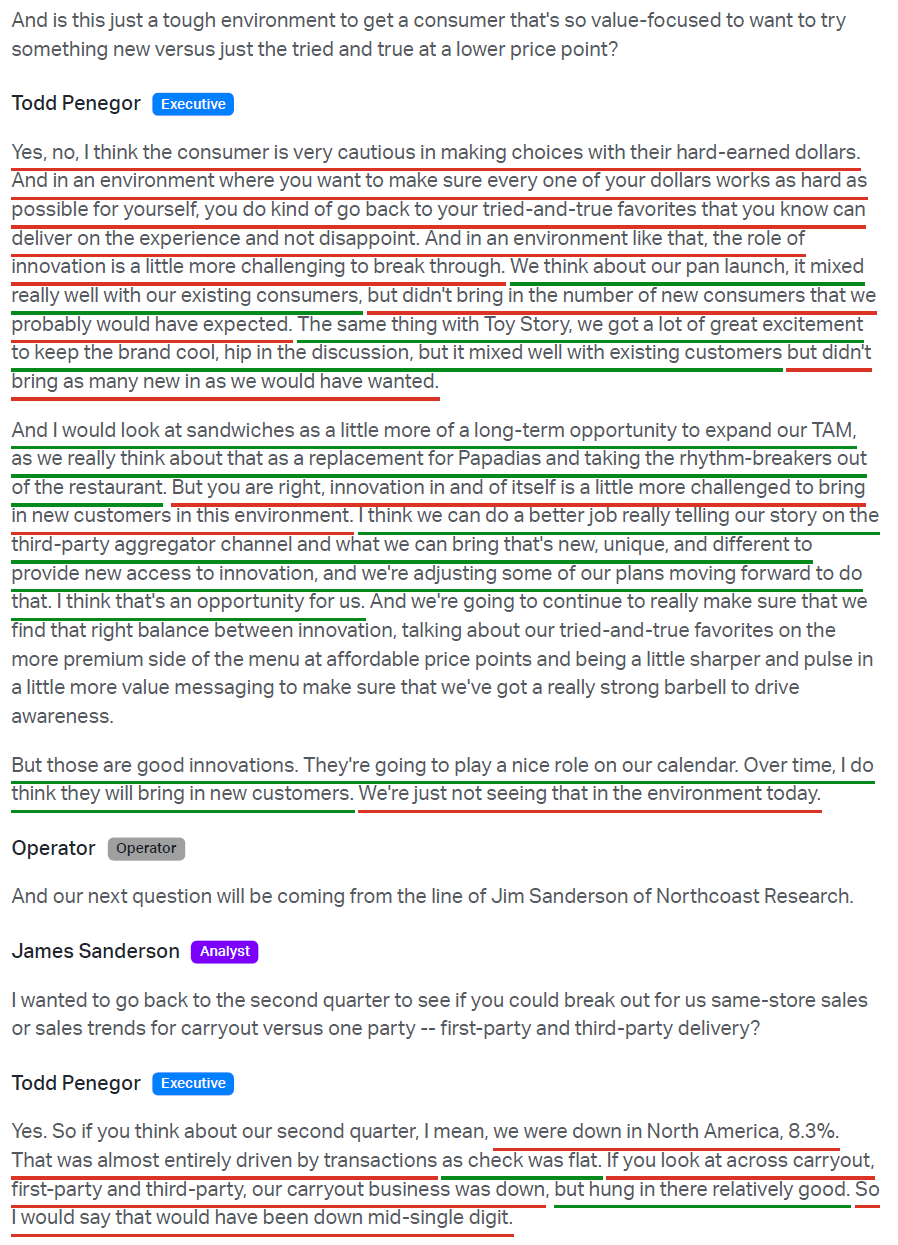
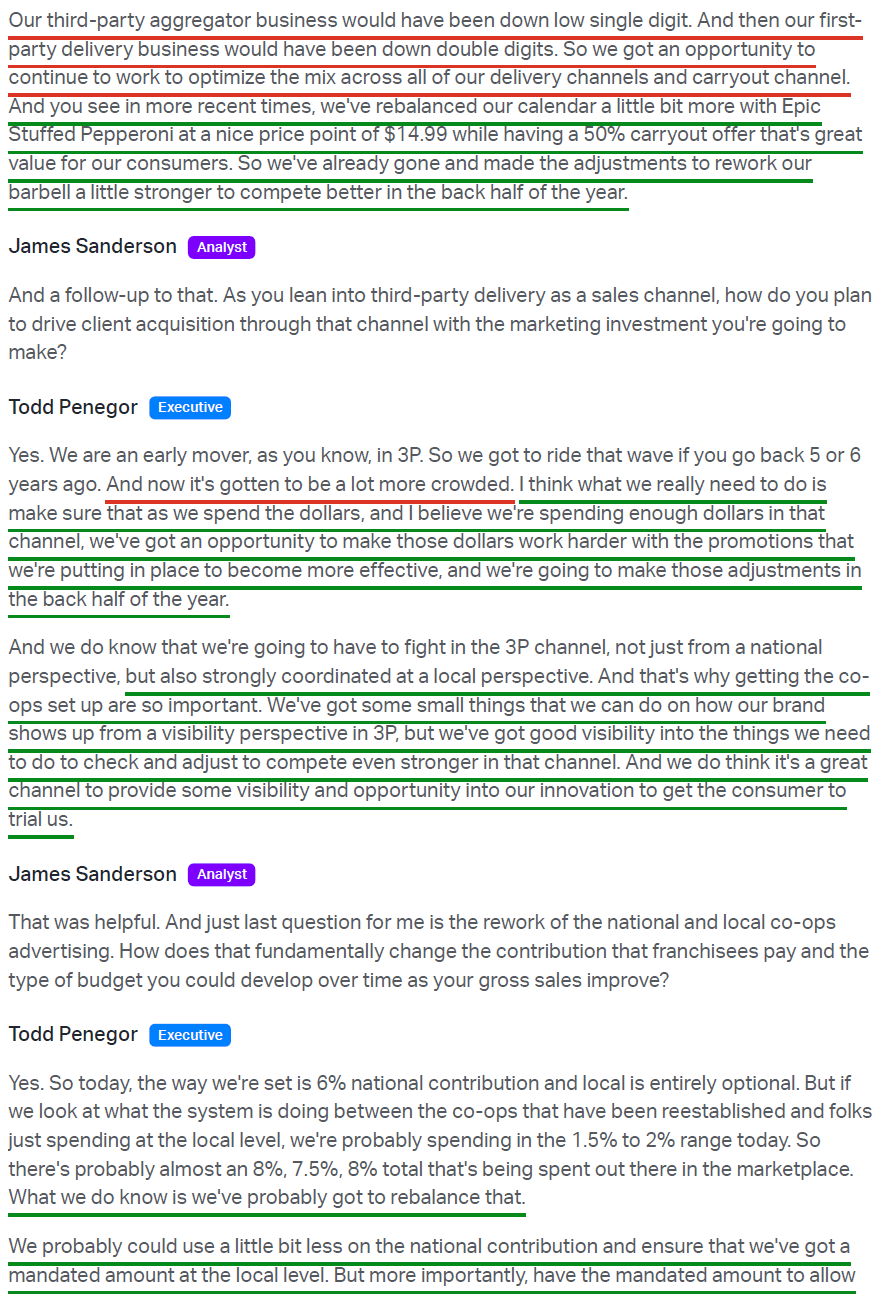
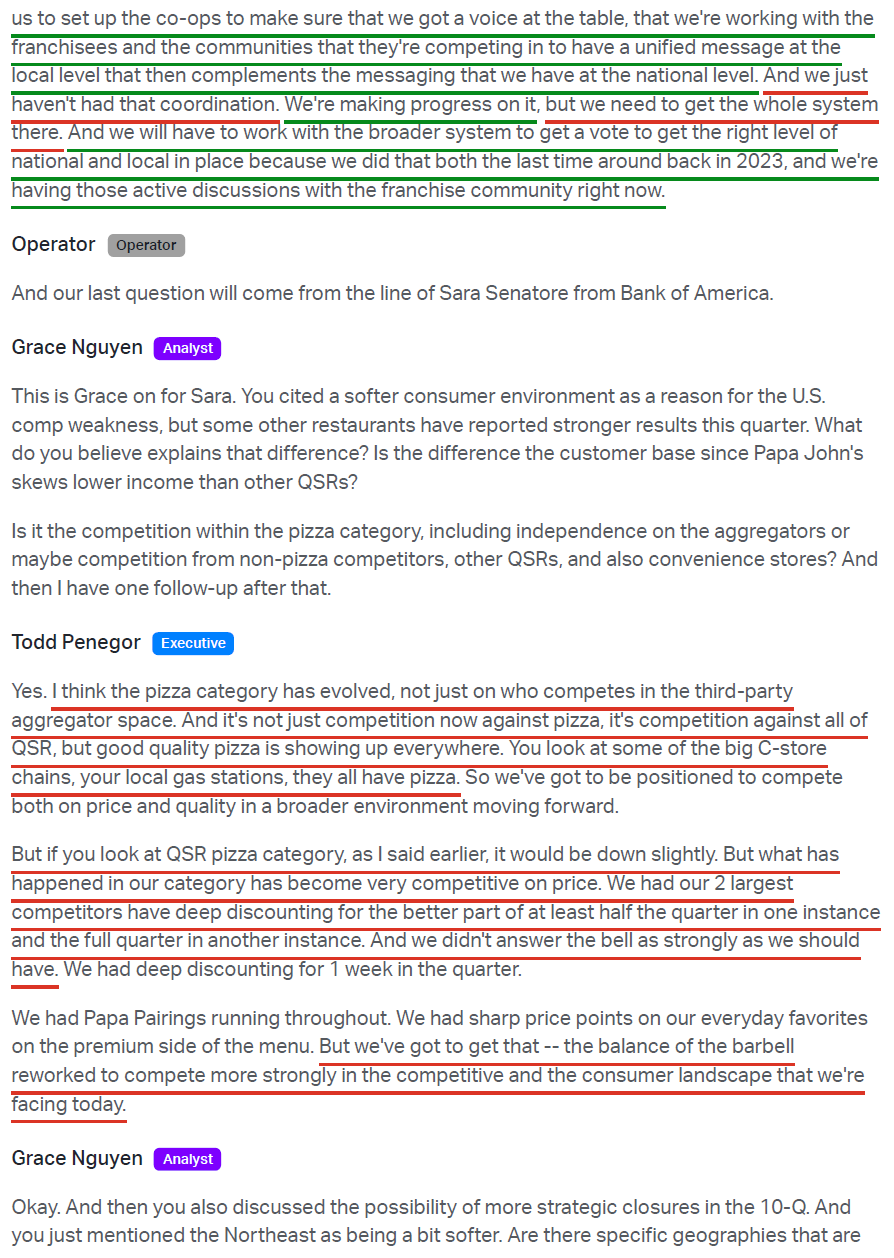
Earnings Call Highlights
General Market
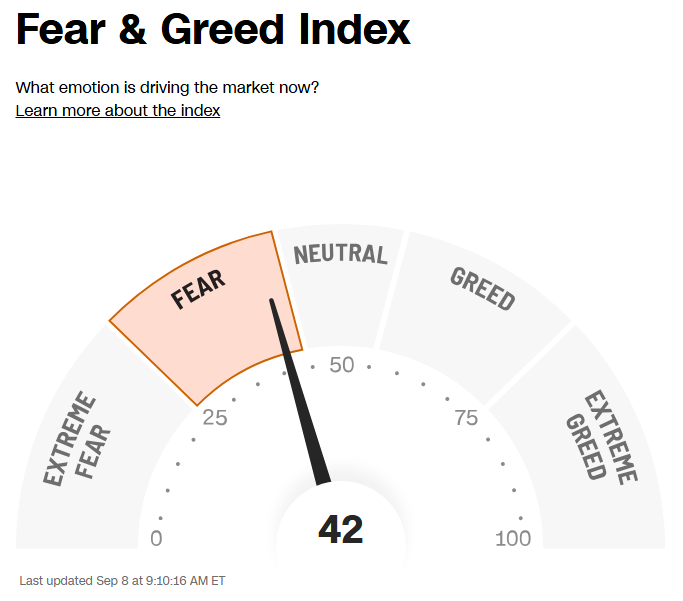
The CNN “Fear and Greed Index” ticked down to 42 this week from 45 last week. You can learn how this indicator is calculated and how it works here: (Video Explanation)
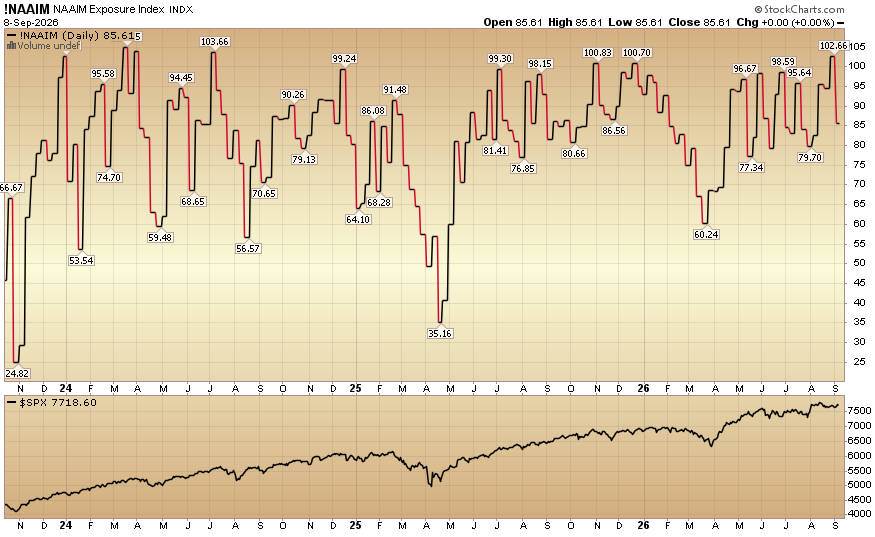
The NAAIM (National Association of Active Investment Managers Index) (Video Explanation) ticked down to 85.61% equity exposure this week from 102.66% last week.
Our podcast|videocast will be out sometime today. We have a lot of great data to cover this week. Each week, we have a segment called “Ask Me Anything (AMA)” where we answer questions sent in by our audience. If you have a question for this week’s episode, please send it in at the contact form here.

Comments
Log in or sign up to join the conversation.