

SPX Monitoring purposes; Long SPX on 3/25/22 at 4543.06.
Monitoring purposes GOLD: Long GDX on 10/9/20 at 40.78.
Long Term SPX monitor purposes; Neutral
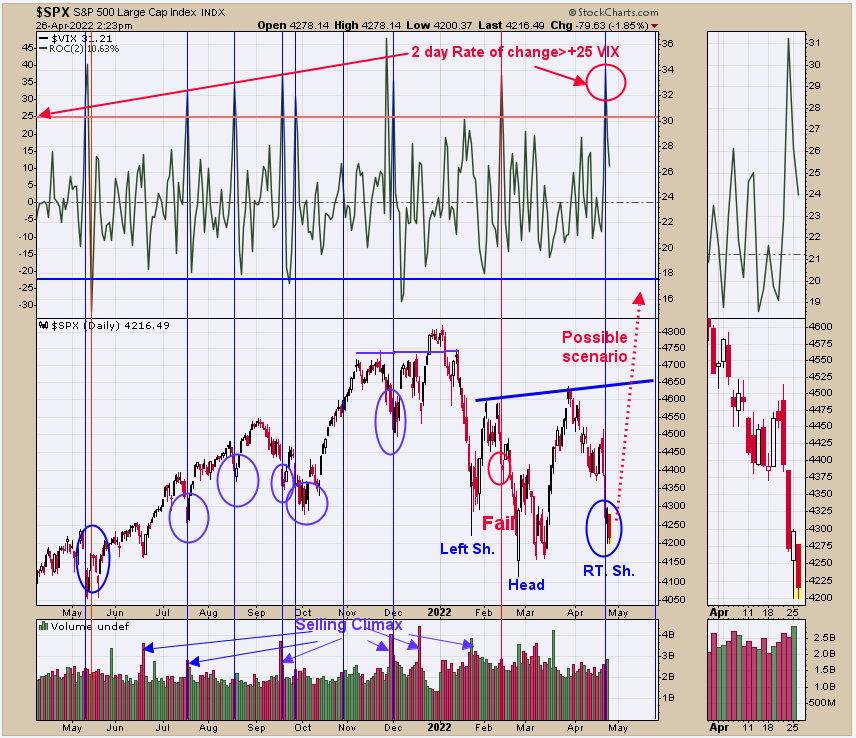
We updated this chart from yesterday. We said yesterday, “The top window is the 2 day (Rate of Change) for the VIX; readings above 25 on this indicator (current reading is 26) suggests a low is near; happed 8 times since last May with one failure which works out to 88% success rate. The pattern forming on SPX could be a Head and Shoulders bottom where the Right Shoulder is completing now. This potential Head and Shoulders bottom has an upside target to 5150 which would be a new high. Don’t have it shown but NYSE Summation index needs to see +1000 range near mid May for a bull market signal (on a previous report) for 2022 other wise sideways market at best this year.” Added to above, Today’s light volume test of Monday’s low is a bullish sign suggesting bottom is forming.

VIX measures the fear in a market and the VVIX is the VIX of the VIX. So the VIX/VVIX ratio is a good indicator that can define panic and panic only forms at bottoms in the market. The acceleration of the VIX/VVIX ratio helps to pin point where all the panic is occurring. The bottom window is the “Rate of Change” (ROC) of the VIX/VVIX ratio and high readings above +10 suggests panic (high came in yesterday +15). Next window up is the Percent B. The percent B shows when it above its upper Bollinger Band (>1) or below its lower Bollinger band (<0). Percent B of the VIX/VVIX reached above +1 a couple of days ago suggesting VIX/VVIX ratio has gone up to fast and is due to normalize. Top window is RSI for the VIX/VVIX ratio which also measures acceleration and shows excess with readings reach above +70 (current reading is 84). We marked with red lines the times when all three indicator for the VIX/VVIX ratio reached bullish levels. Will this time be different,? Ask for free 2 wk trial. Join us on twitter. @OrdOracle

The top window is the Inflation/Deflation ratio. Last week it closed above its previous 2020 high suggesting a breakout. Right after that high, it tumbled the next four days creating an “Up thrust” suggesting a consolidation is starting. If the Inflation/Deflation ratio starts a consolidation so will the XAU (GDX). As pointed out in yesterday’s report, the pattern that may be forming on XAU is a Head and Shoulders bottom where the Head is the October low. Head and Shoulders pattern have symmetry both in time and price. The Left Shoulder formed over 5 months and suggests the Right Shoulder may take as long and could complete in the October or November timeframe. Still a bull market but sideways action over the next 5 or 6 months is possible.



Comments
Log in or sign up to join the conversation.