

Housing sales, new and existing, have been comatose for over 3 years.
New Residential Construction Report
The New Residential Construction Report for July 2026 remains a broken record.
New Home Sales
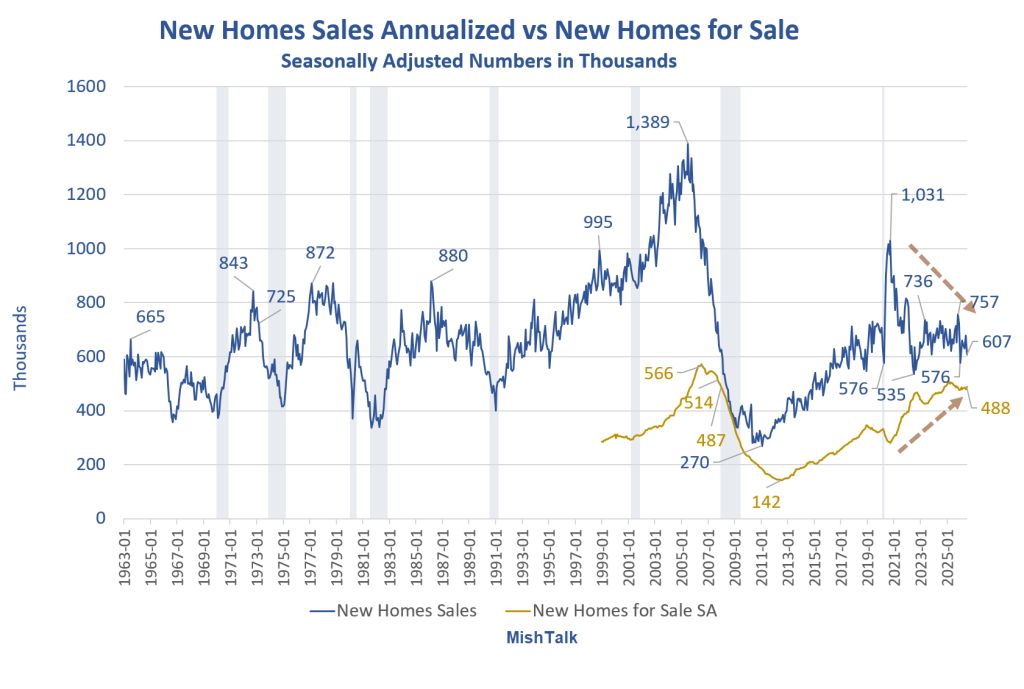
Sales of new single-family houses in July 2026 were at a seasonally-adjusted annual rate of 607,000.
This is 10.5 percent (±14.0 percent) below the June 2026 rate of 678,000, and is 6.3 percent (±19.6 percent) below the July 2025 rate of 648,000.
For Sale Inventory and Months’ Supply
The seasonally-adjusted estimate of new houses for sale at the end of July 2026 was 488,000. This is 1.9 percent (±1.2 percent) above the June 2026 estimate of 479,000, and is 1.6 percent (±4.0 percent) below the July 2025 estimate of 496,000.
This represents a supply of 9.6 months at the current sales rate. The months’ supply is 12.9 percent (±21.3 percent) above the June 2026 estimate of 8.5 months, and is 4.3 percent (±25.2 percent) above the July 2025 estimate of 9.2 months.
Sales Price
The median sales price of new houses sold in July 2026 was $393,800. This is 2.3 percent (±7.4 percent) below the June 2026 price of $403,100, and is 0.9 percent (±6.9 percent) below the July 2025 price of $397,300.
The average sales price of new houses sold in July 2026 was $508,800. This is 4.1 percent (±11.8 percent) above the June 2026 price of $488,900, and is 5.4 percent (±13.1 percent) above the July 2025 price of $482,800.
Note the huge margins of error on these stats, ±14.0 PP on monthly sales and ±19.6 PP on year-over-year sales.
New Home Sales Annualized vs Homes for Sale Detail
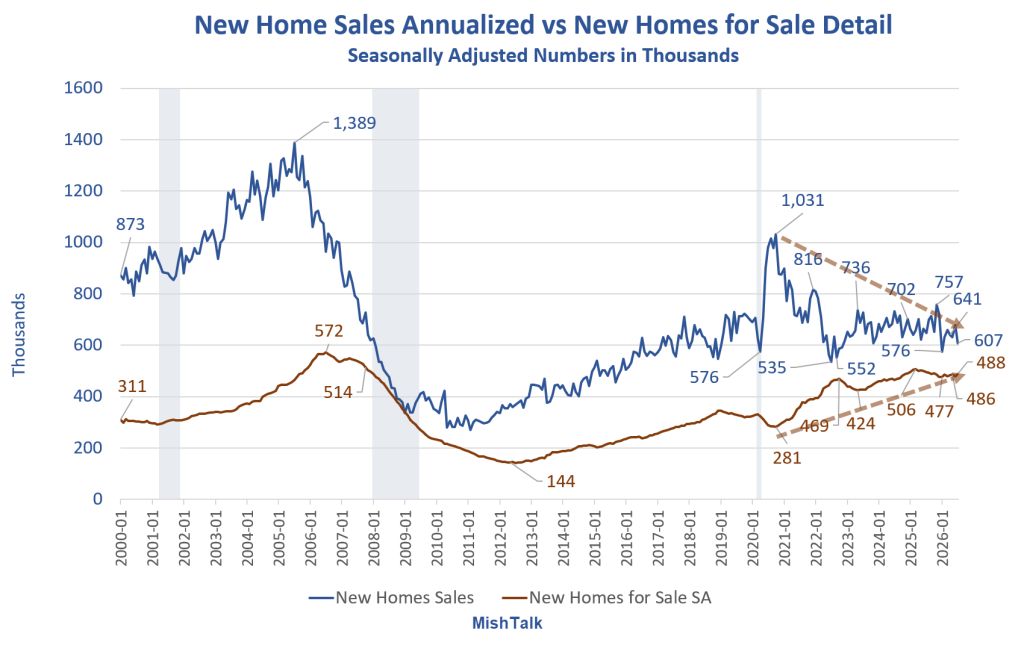
Supply of new homes for sale has generally been rising. Actual sales hvae generally been falling.
However, both measures appear to have stabilized.
New Homes For Sale by Stage of Construction
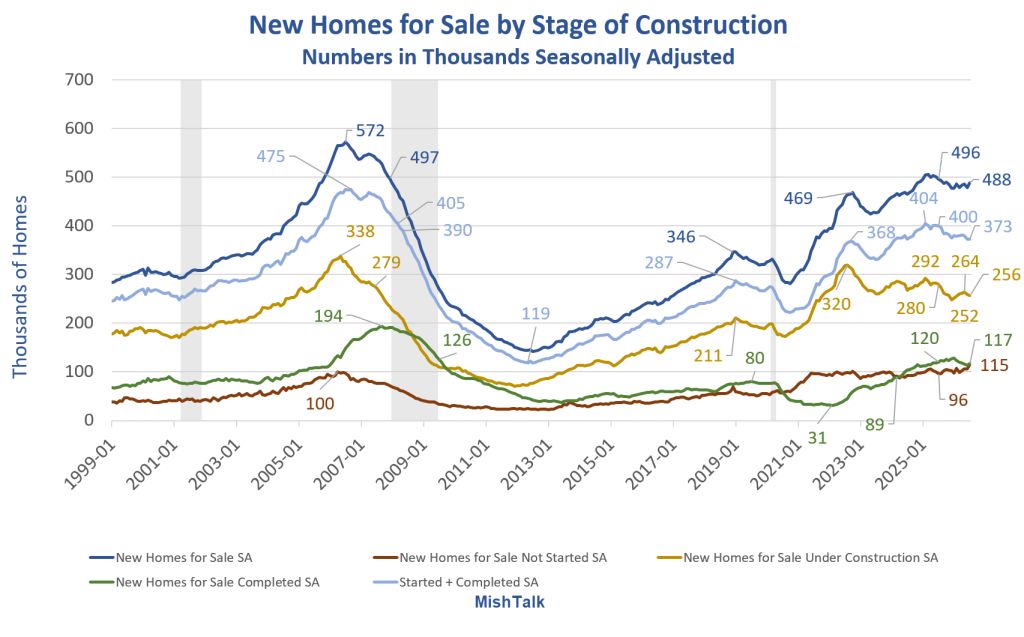
Stage of Construction Details
For Sale: 488,000
Not Started: 115,000
Under Construction: 256,000
Completed: 117,000
Under Construction Plus Completed: 373,000
Counting vacant lots as a home for sale strikes me as silly. But the Census Department includes not started homes in its measures of supply.
The important numbers are completed and started plus completed. Those homes represent builder commitments and carrying costs.
To sell these homes, builders are under pressure to lower prices, offer financing, or other incentives.
New Homes for Sale Supply in Months
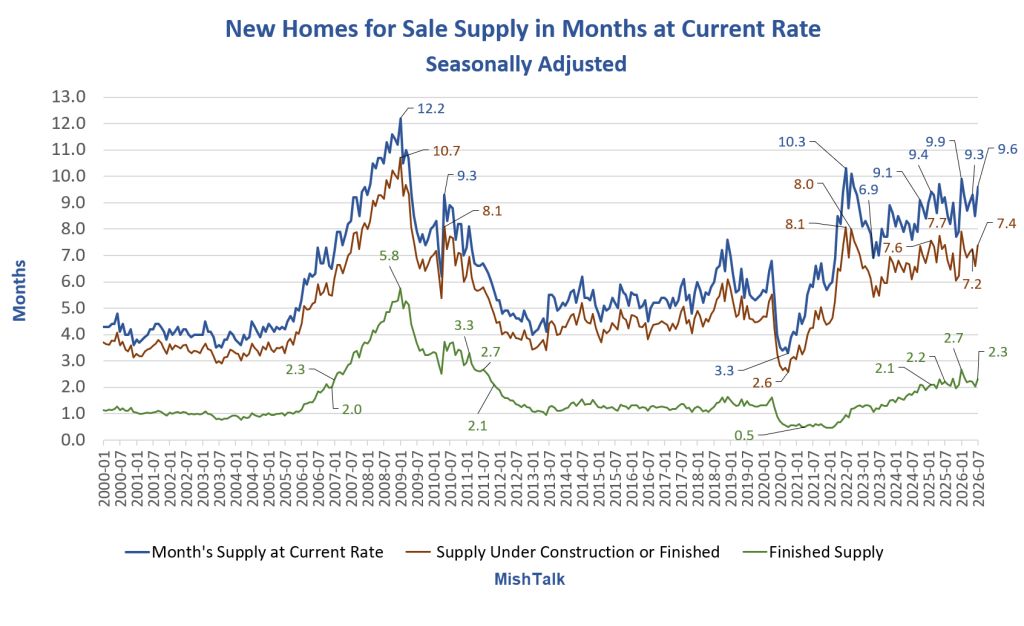
Supply in Months Detail
All Supply: 9.6 Months
Under Construction or Finished: 7.4 percent
Finished: 2.3 percent
All of these numbers are elevated.
New Home Sales vs Existing Home Sales
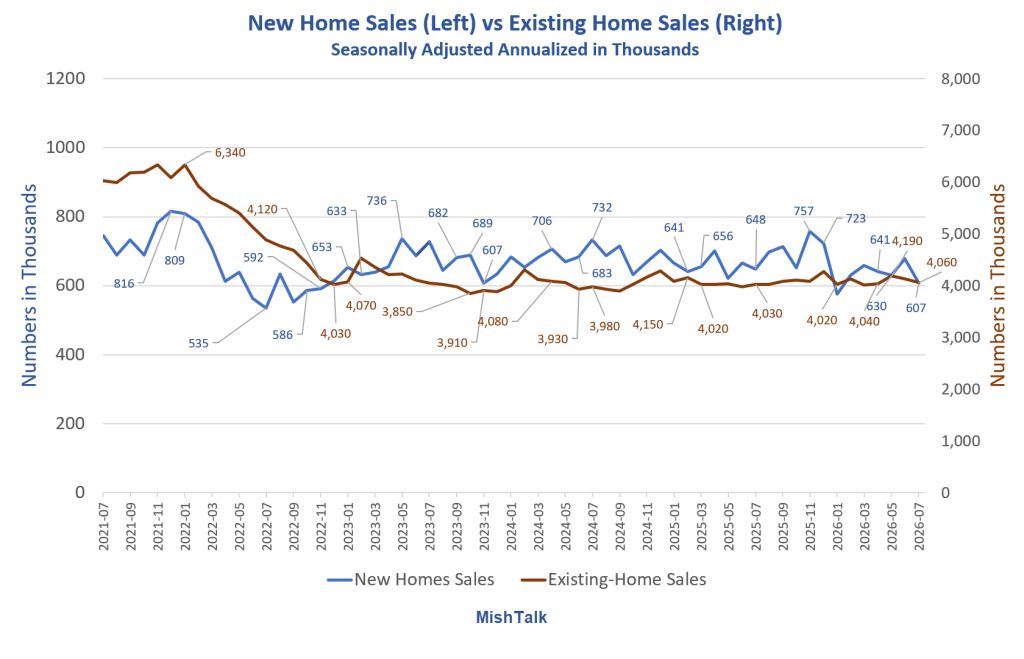
One Word – Comatose or Stagnant
New and existing homes have both been stagnant since January 2023.
This is despite significant interest rate moves in both directions.
30-Year Mortgage Rates
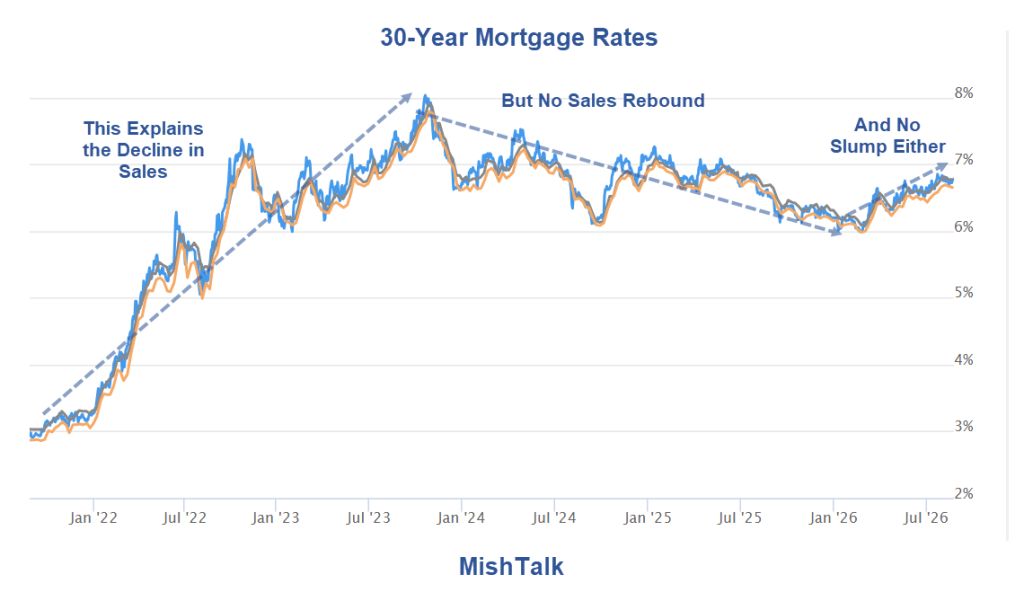
Mortgage News Daily 30-Year Mortgage Rates
Rates courtesy of Mortgage News Daily.
Pool of Price Insensitive Buyers
Taken together, the preceding two charts tell a story of price insensitive buyers.
This pool includes all cash buyers, those with huge stock market gains who are unconstrained by affordability measures, those with significant home equity who want to trade down, and speculators who believe the stock market or the Fed will bail them out.
Everyone else has been priced out of the market by a price-mortgage rate combination that is just too high.
Few existing-home owners want to trade a 3 percent mortgage rate for one again approaching 7 percent.
Related Posts
August 21, 2026: Pending Home Sales Decline 2.3 Percent, Housing Market Remains Stuck
August 21, 2026: Trump Threatens to Use the Military on the US Bond Market. What!?
Trump responds to a reporter’s question with an answer that makes no sense.
Comments
Log in or sign up to join the conversation.