


Week 43 | Outlook: 19–23 October 2026
The market finished the week once again asking hard questions of the AI boom. Strong demand for computing power is one thing; paying for the infrastructure needed to deliver it is another. Renewed scrutiny is being applied to OpenAI's revenue and the knock on effect to Oracle's balance sheet, as its data centre expansion borrowing costs are repriced to account for the added risk. This in turn has spurred a rout in the chip manufacturers globally, and pressured the technology index QQQ accordingly, as people ask if the demand for semiconductors will sustain.
The split between the major indices tells the story better than a single market average. The S&P 500 lost roughly 2% over the week and the Nasdaq Composite more than 4%, while the Dow gained 0.7%. Blue chips remain a popular target for those seeking long term relative safety in equities. On Friday itself, the S&P fell 1.09%, the Nasdaq 2.14% and the Dow 0.34%. Money has been looking beyond the companies that led the AI advance, but a rotation into other sectors doesn’t automatically guarantee a recovery in the broader market’s health.
Inflation makes the financing question more difficult. September consumer prices rose 0.6% from August, taking annual inflation to 3.7%. Core prices increased 0.3% monthly and 2.6% annually. Producer prices added another warning, with final demand prices rising 1.3% during September. Energy explains a substantial part of the pressure, but companies still have to decide how much they can absorb and how much customers will tolerate. We don’t think the evidence to date supports assuming that cheaper money will arrive quickly enough to resolve those choices.
One ray of sunshine in the semis decline was TSMC’s third-quarter revenue of $46.72 billion, which exceeded its earlier guidance, and its fourth-quarter revenue outlook was higher again. US industrial production rose 0.7% in September, although manufacturing’s increase was a more modest 0.3%. It would appear that a line in the sand is being drawn between businesses generating cash from current demand and businesses relying on continued access to financing to realise future growth.
Oil complicates both sides of that equation. Renewed supply concerns lifted crude on Friday, even as plans to accelerate emergency stock releases offered a potential cushion. Higher energy costs can squeeze margins while making an inflation-driven rise in interest rates more plausible. Yet Thursday’s Treasury buying showed that investors still seek government bonds when corporate financing risk rises. A bond rally in that setting needn’t mean the inflation problem has gone away.
Our Week 43 outlook covers Monday 19 to Friday 23 October. The Fed is in its communications blackout ahead of the 27–28 October meeting, so company guidance and incoming data will carry more of the immediate argument. Netflix reports on Tuesday, with Meta and Tesla following after Wednesday’s close. Housing starts and permits on Tuesday, Thursday’s jobless claims and Friday’s flash business surveys will help test whether activity can remain resilient without adding further price pressure. We expect a selective, unsettled week rather than a straightforward return to the earlier leadership.
US indices: earnings must answer the funding question
The latest futures positioning covers Tuesday 6 to Tuesday 13 October, before the final three sessions of the week. Leveraged funds added 8,181 S&P 500 longs and 1,820 shorts, improving their net position by 6,361 contracts. They nevertheless remained net short 408,726 contracts, compared with 415,087 a week earlier. That is cautious positioning, not an outright bullish turn. Its four year net percentile of 14.8 places it towards the weaker end of its own history, which leaves room for a rebound if bad news stops producing fresh selling.
The Nasdaq picture is different, but it also requires care. Leveraged funds reduced longs and covered more shorts, bringing their net short down to 11,593 contracts. Its 86.6th percentile describes where that signed position sits historically; it does not make it net long. The distinction matters because a relatively firm historical ranking can coexist with negative exposure and falling prices. These futures categories also include hedging and relative-value activity, so they aren’t a direct survey of investors’ cash/equity portfolios.
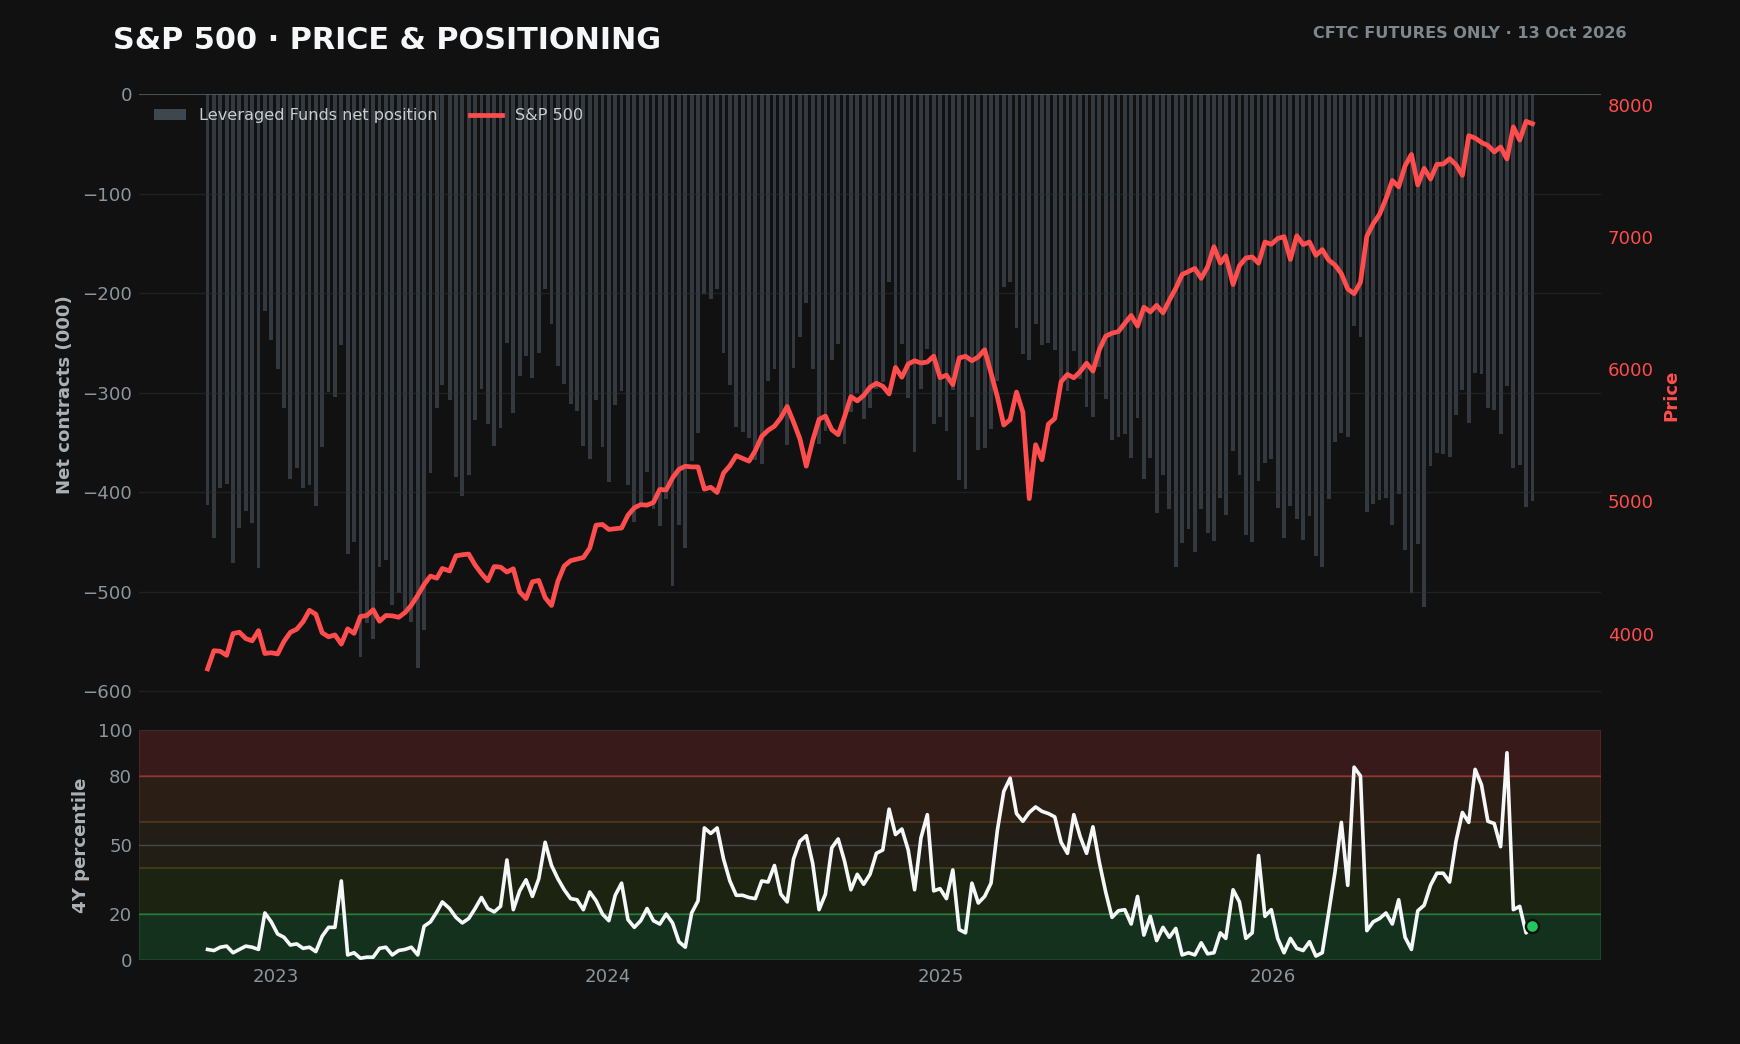
Wednesday–Friday inference: the sharp technology weakness and Friday’s reversal are consistent with renewed hedging or reduced risk exposure after Tuesday. Thursday’s recovery followed by Friday’s sharp sell off is likely to indicate an increase in the net short position.
Breadth gives a mixed answer. In the 16 October S&P constituent snapshot, about 45.6% of shares were above their 50-day moving average and 55% above their 200-day average. The breadth score was 50.5, classified as mixed, despite improvement over the preceding month. The sentiment score was neutral at 45.0, with deteriorating momentum. That combination supports the idea of rotation, but it doesn’t establish either broad strength or a washed-out market ready to rebound. Our macro dashboard/charts section is free to view on our website.
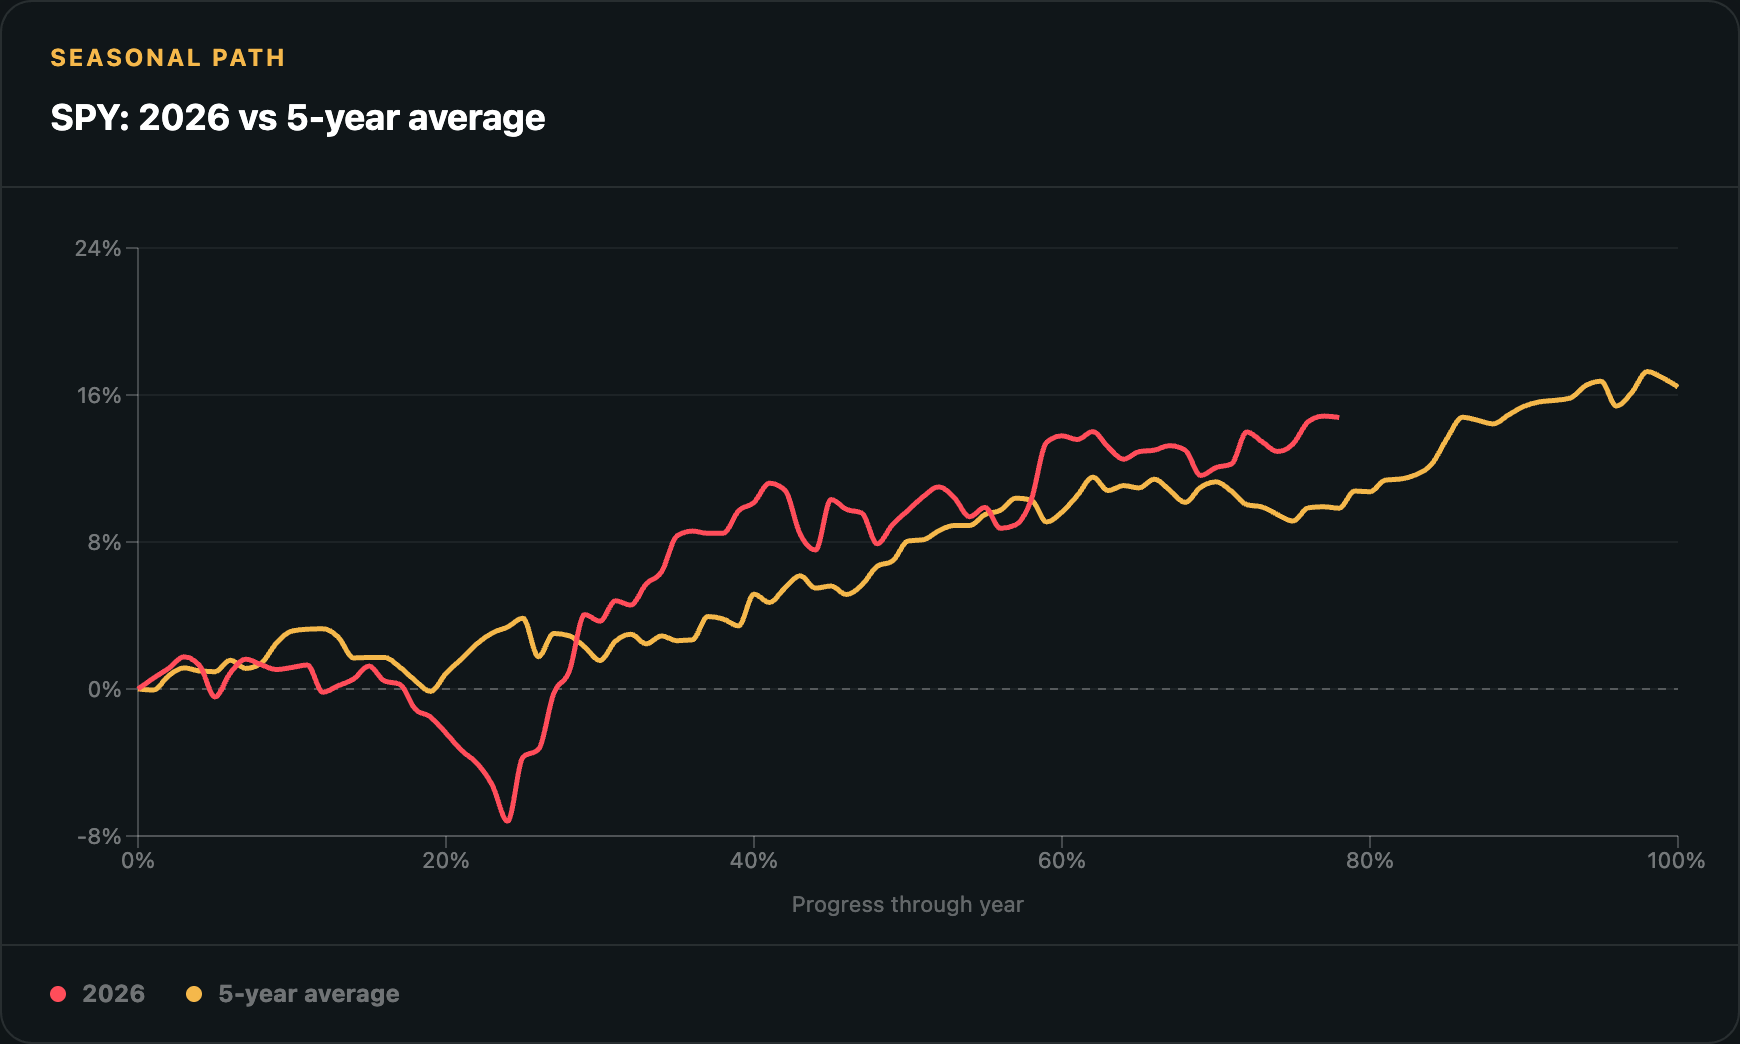
The 5 year seasonal average (0.76% in Week 43) is supportive of a swing low forming soon and a rally into year end, but there are many catalysts to watch for so we should tread carefully. The outsized spike in the VIX late Friday had Twitter ablaze with rumours of a fund liquidation. We think equities face a choppy week with a downside bias early on followed by a recovery rally into the weekend. In tech, Meta’s spending and cash-flow outlook is particularly relevant for the AI narrative.
Gold: support from uncertainty, with a seasonal headwind
Gold’s 6–13 October positioning showed reduced commitment. Managed money cut longs by 2,354 contracts and added 1,544 shorts, reducing the net long by 3,898 to 107,089 contracts. The previous Tuesday’s net long was 110,987. At the 55th percentile of its four-year signed-net history, positioning was around the middle of its range. We read this as fading conviction rather than an extreme bearish position that must reverse. Gold still has a substantial net long position overall.
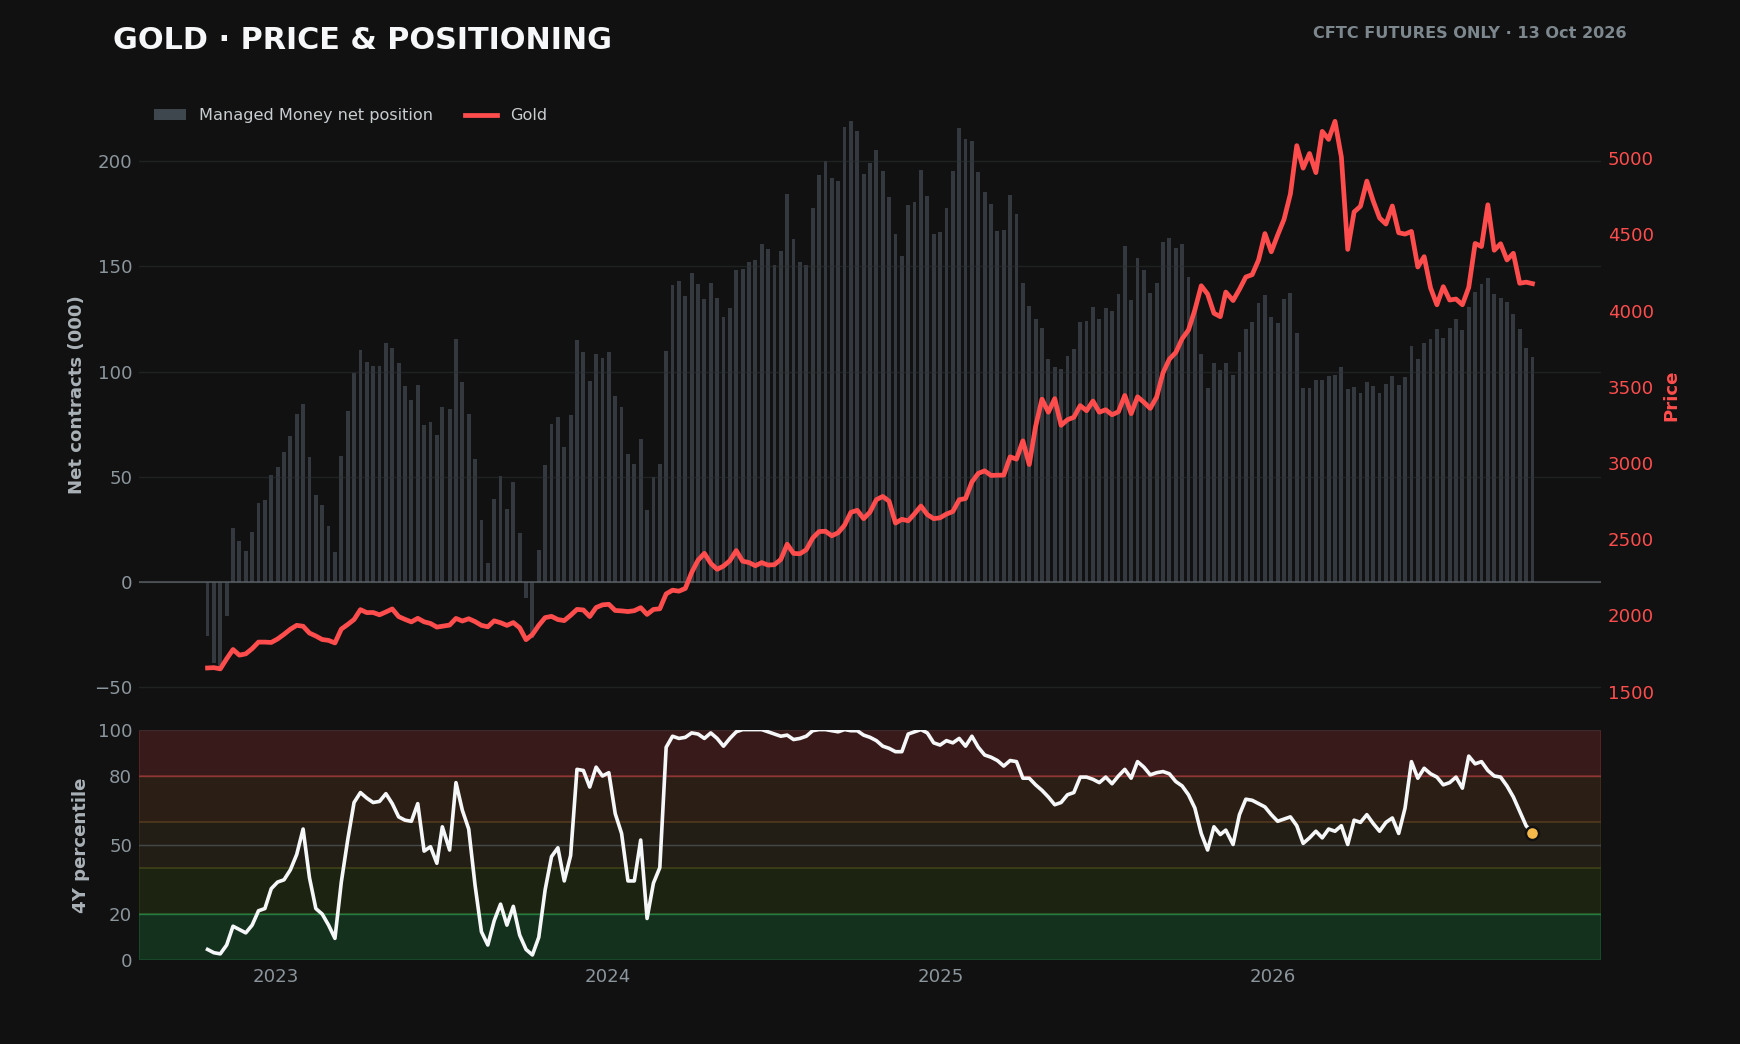
Wednesday–Friday inference: the later rebound described in gold trading, alongside Thursday’s Treasury rally and a softer dollar, is consistent with some defensive demand returning. The late Friday account nevertheless put both spot gold and gold futures down around 0.7% over the week, which was a great recovery after Wednesday's sharp decline, and means positioning likely changed very little assuming Monday & Tuesday stay steady.
Gold faces two competing effects from the same news. Concern about corporate financing and geopolitical disruption can increase demand, but higher real yields and dollar strength can dampen the fervour. Equity sentiment supplies useful context for defensive demand, but we think the behaviour of the dollar and inflation-adjusted yields is more informative, and we can't assume every technology decline must lift bullion.
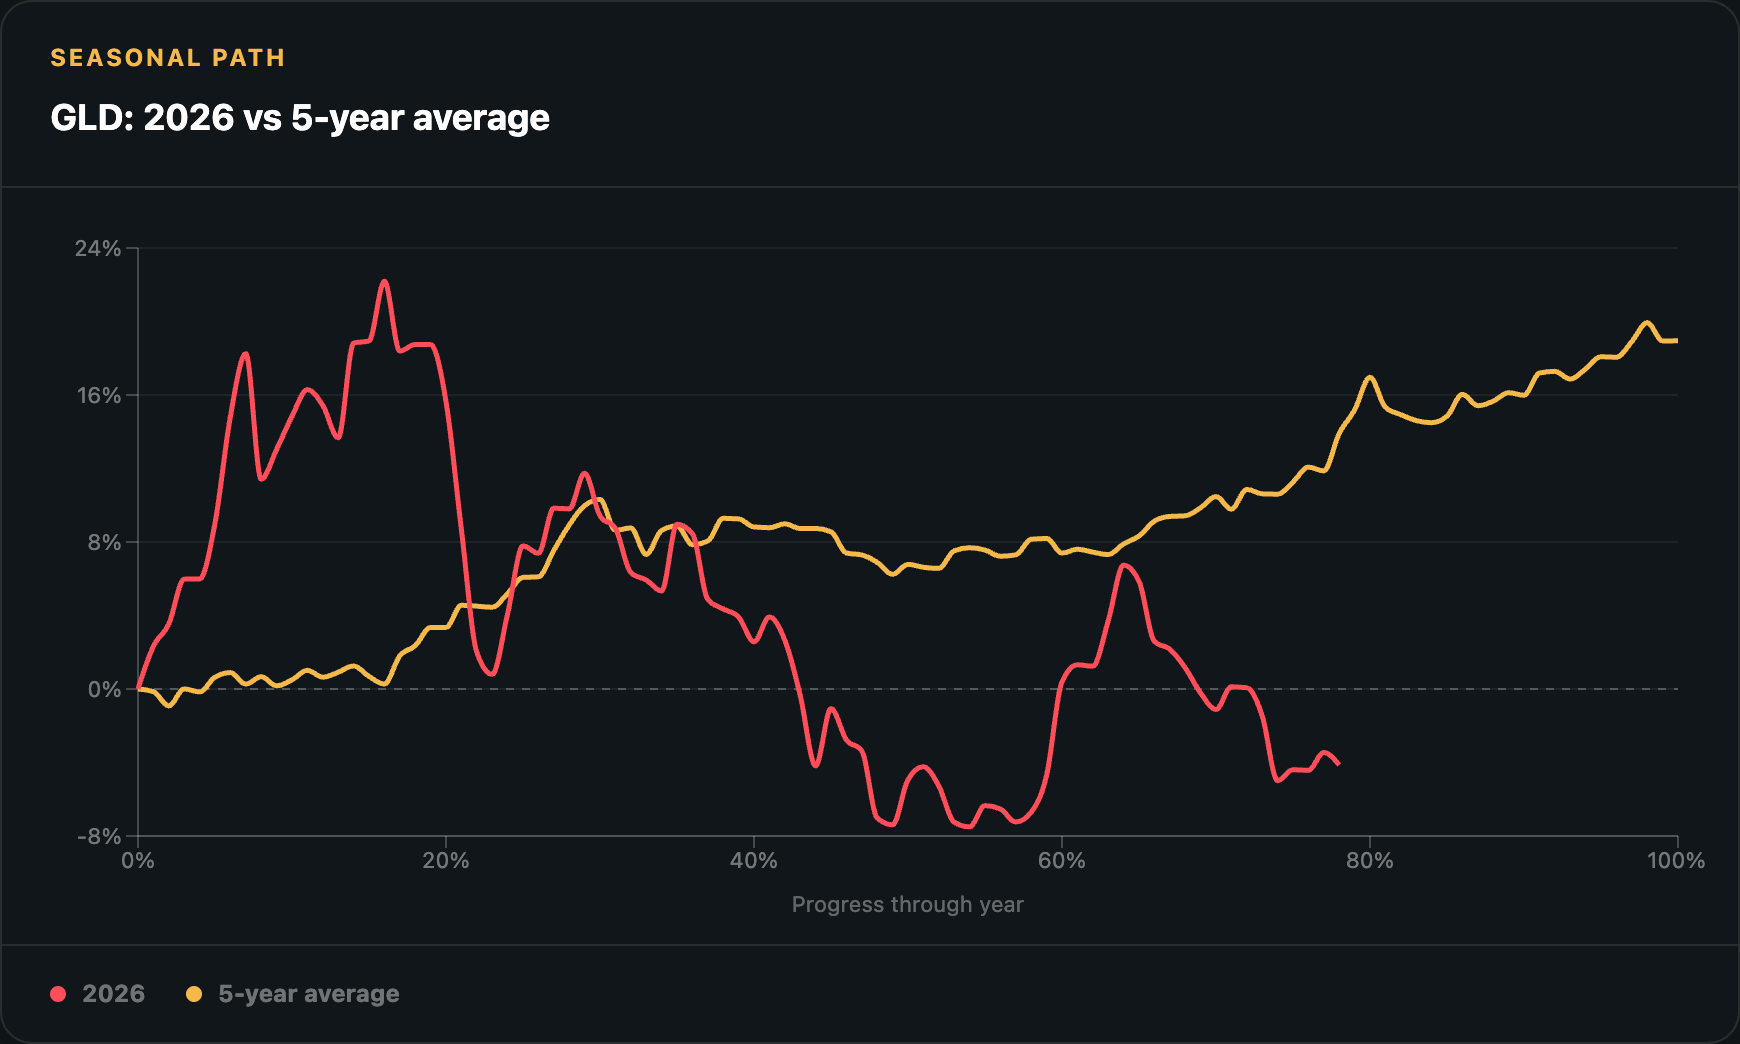
The 5 year GLD pattern argues for restraint, averaging a −0.41% loss in Week 43, and its seasonal path softens around this part of October. Last week we were looking for weakness early on and a rally after Wednesday, but we were expecting an overall gain on the week. Half right. This week we favour a modest upward bias early in the week if equity markets do continue to fall, followed by a pullback to support towards the weekend. Friday’s business surveys will be useful: weaker activity without a fresh acceleration in prices would be more favourable than an inflationary resilience story that pushes rate expectations higher.
Oil: supply relief has to reach the market
WTI positioning became less optimistic during 6–13 October, even though later price action was strong. Managed money reduced longs by 6,380 contracts and added 6,644 shorts. The net long fell by 13,024, from 53,598 to 40,574 contracts. Its four-year percentile was only 10.5, placing the position near the lower end of its history. That is a small net long relative to its own past, and leaves scope for investors to increase exposure as supply fears intensify, that is if they manage to catch the rally this time.
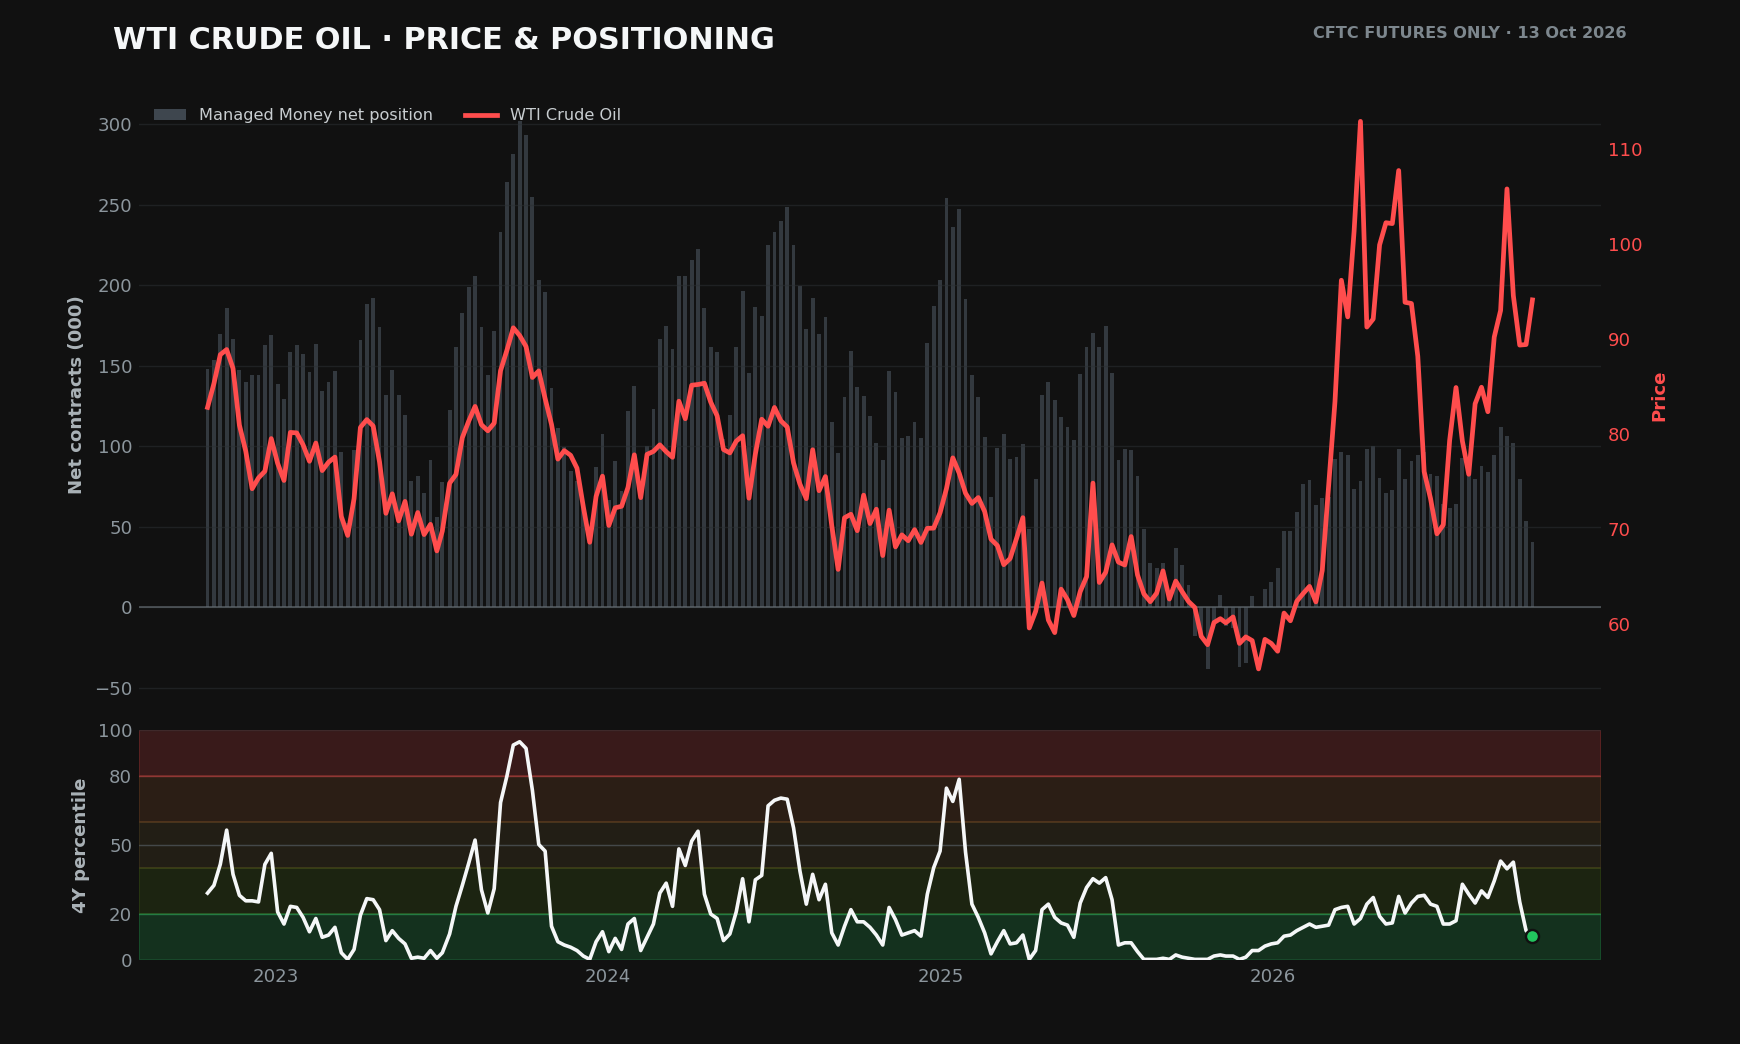
Wednesday–Friday inference: the late-week oil surge could reflect fresh risk taking, short covering or a higher price demanded for immediate supply risk, but either way we can expect to see a build to the net long position assuming Monday and Tuesday don’t give it all back. Friday’s settlement reporting showed a strong rise in both WTI and Brent, with WTI gaining more than 10% over the week and Brent nearly 5%. European governments are surely praying for a mild winter.
There is a real supply response to weigh against disruption. The agreed acceleration of remaining emergency stock releases includes more than 20 million barrels of diesel as soon as possible. A reported US waiver of Russia-related sanctions also offers a possible route to easing supply pressure, although implementation and actual deliveries remain unverified, and Zelensky seems eager to spoil that party. Given the news from the Middle East and the rising cost of shipping, there is increasing disbelief that fuel will arrive where it is needed at the right time.
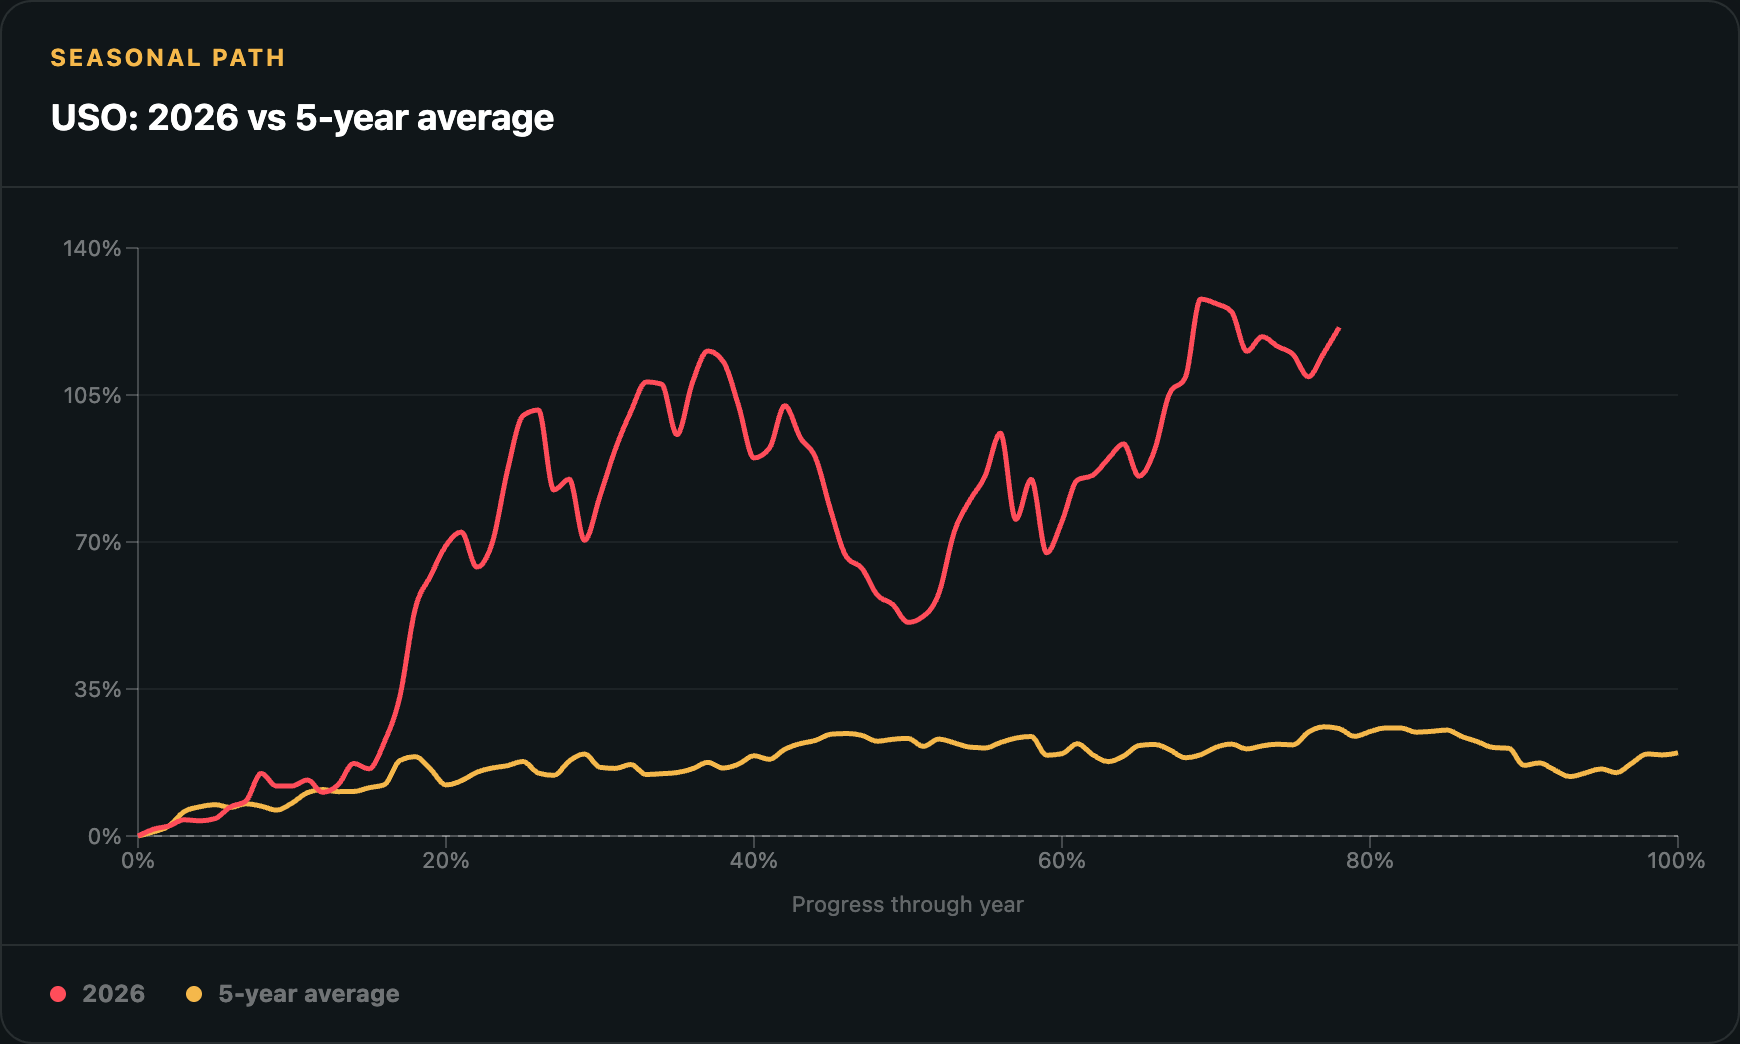
USO’s 5 year Week 43 average was approximately +2.08%, giving the oil outlook a positive historical backdrop. Last week we had a firm upward bias, and this week we expect volatile trading with an upside bias to start the week while shipping risks remain unresolved, and perhaps a pullback to support into the weekend.
US bonds: a haven bid meets crowded positioning
10 year Treasury futures tell a different positioning story from equities and oil. Between 6 and 13 October, asset managers added 70,647 longs and 224 shorts, increasing their net long by 70,423 contracts to 2,898,562. The preceding net long was 2,828,139. The latest position sits at the 100th percentile of its four-year history. This is the asset-manager category, not leveraged funds, and futures holdings can serve portfolio and hedging purposes. Still, it tells us that substantial participation is already in place and short term bullishness may meet short term sellers as managers look to pare losses.
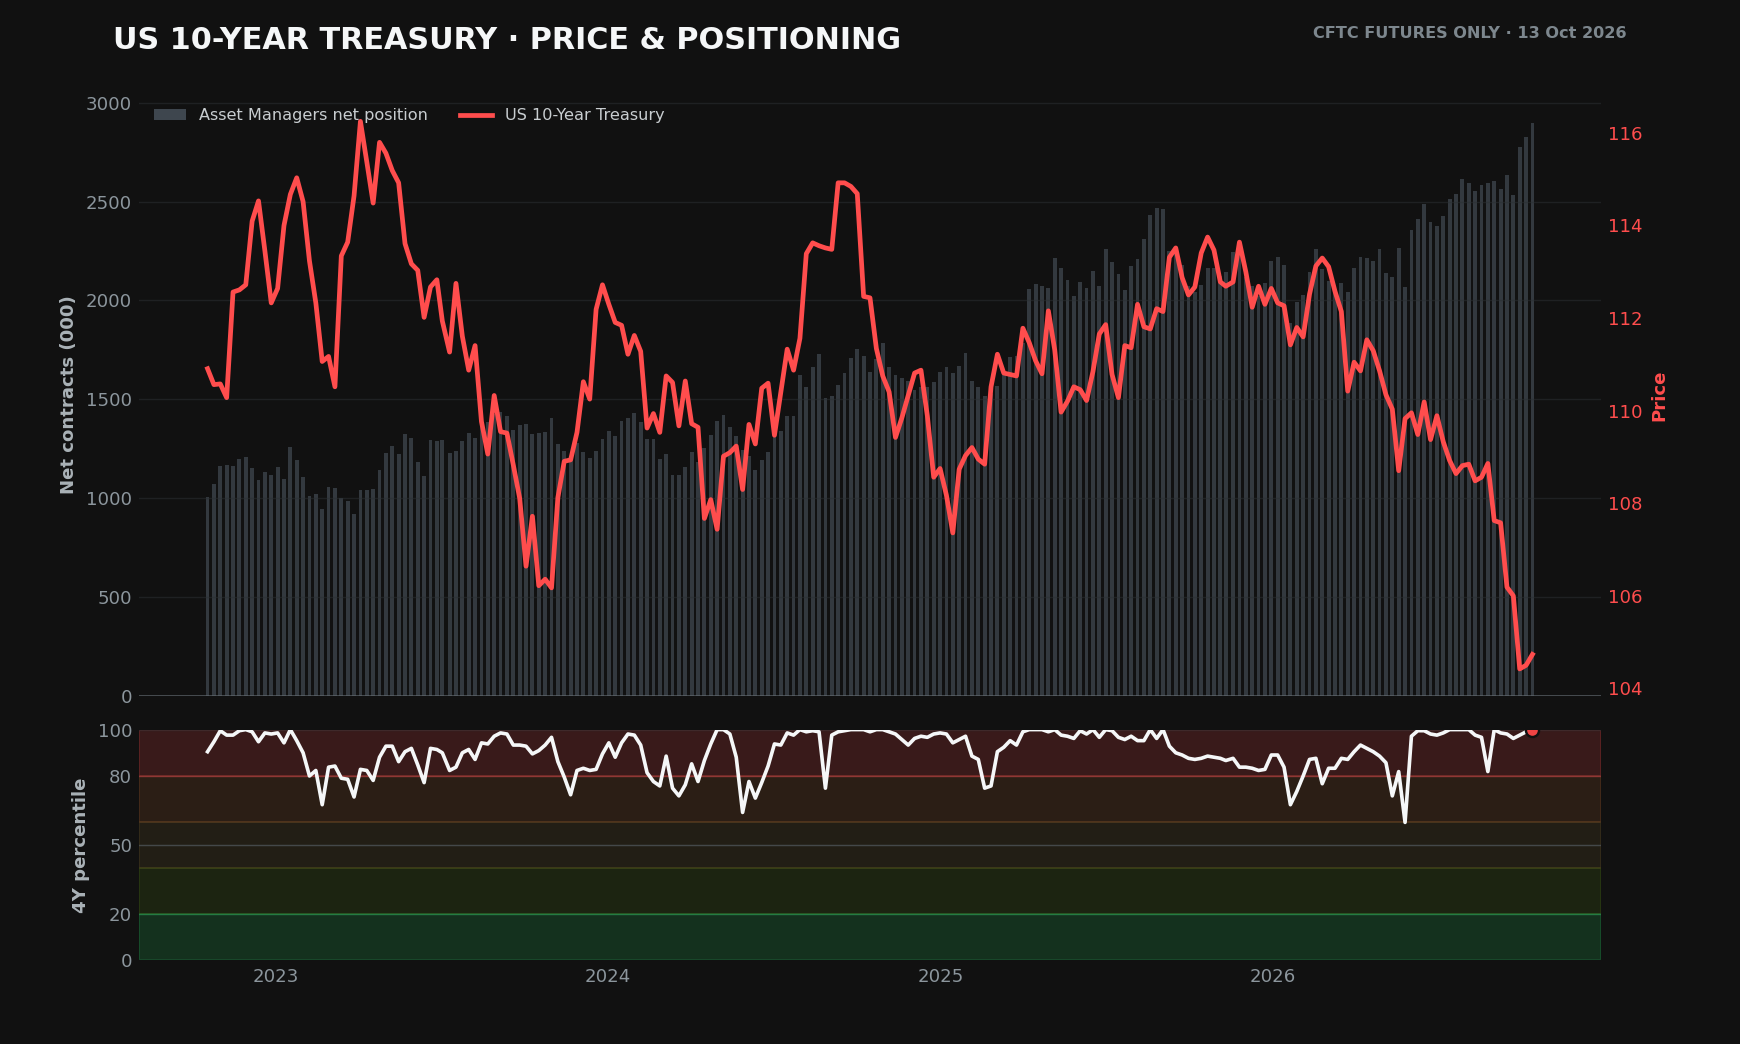
Wednesday–Friday inference: Late week Treasury buying is consistent with investors seeking government duration as technology and corporate funding concerns intensified. We think we will see a modest reduction in the net long position as this bounce plays out, and that may make the rally to 83 in TLT choppy. September’s inflation releases remain uncomfortable, while industrial production does not describe an economy already in a broad contraction. We think Treasuries can benefit short term from equity market weakness, but longer term bonds will continue to sell off.
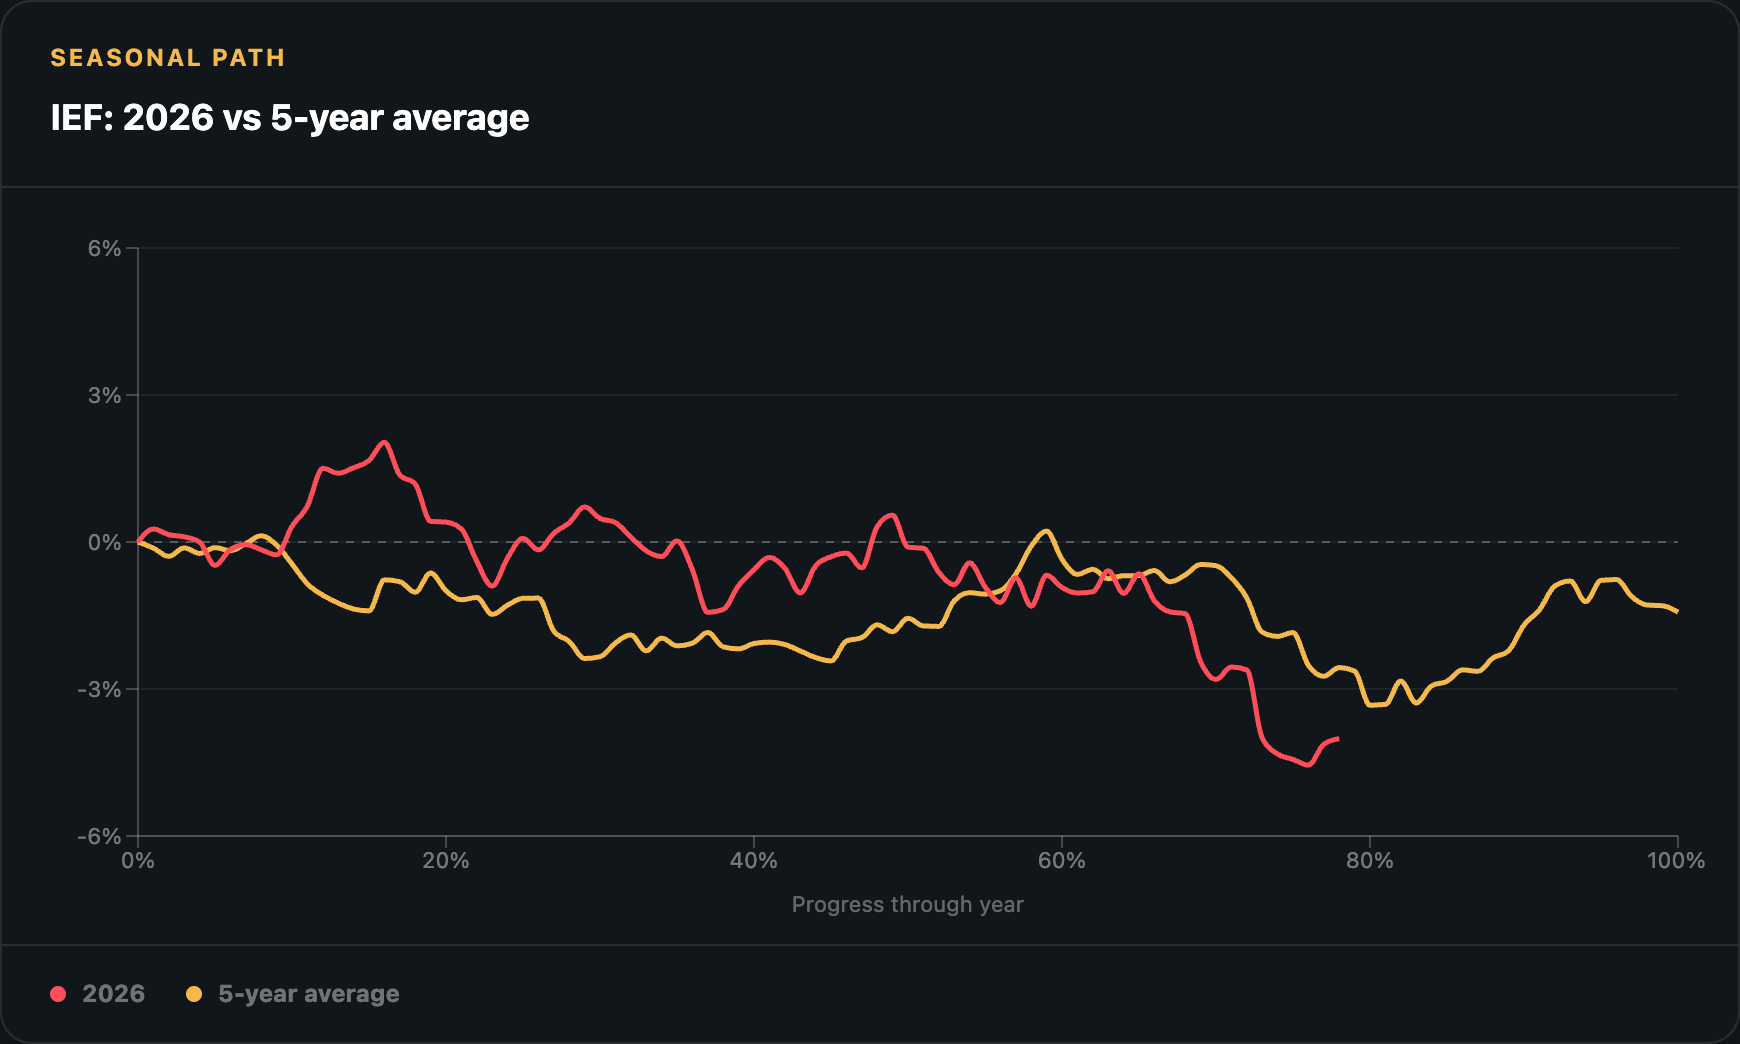
IEF, the 7-10 Year US Treasury ETF, averaged approximately +0.42% in Week 43 over the last 5 years. We favour modestly firmer Treasury prices in the early part of the week, followed by a pullback into the weekend if equities find firmer footing. If we are wrong and the equity sell off deepens, the move higher in Treasuries should be more direct. Either way there seems to be scope for traders buying a pullback for a rally over the next week or two.
Our next article will be published on Sunday. Until then, we wish you well for the week ahead. If you have any questions about anything covered here, please get in touch. We’re always happy to hear from you.


Comments
Log in or sign up to join the conversation.