

Image Source: Unsplash
Discover why one critical support zone could determine whether we see continued accumulation or a fast acceleration to lower levels, and learn the specific volatility pattern that separates healthy consolidation from dangerous distribution before most traders even notice the change.
Watch the video from the WLGC session on 10 Feb 2026 to find out the following:
- How to recognize the four-segment volatility pattern that precedes major breakouts, and why missing this setup costs traders thousands in missed opportunities.
- The specific characteristics that separate a healthy “change of character” from a dangerous trend reversal, including the volume and spread clues professionals watch for.
- The critical difference between constructive consolidation that leads to higher prices versus distribution patterns that result in fast, painful selloffs to lower support levels.
- And a lot more…
Video Length: 00:09:43
Market Environment
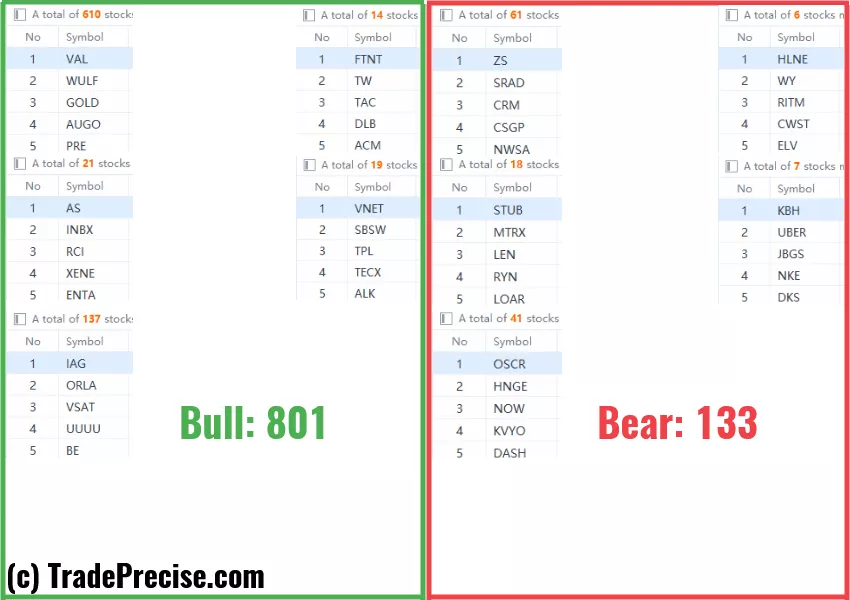
The bullish vs. bearish setup is 801 to 133 from the screenshot of my stock screener below.
(Click on image to enlarge)
Trade Setups
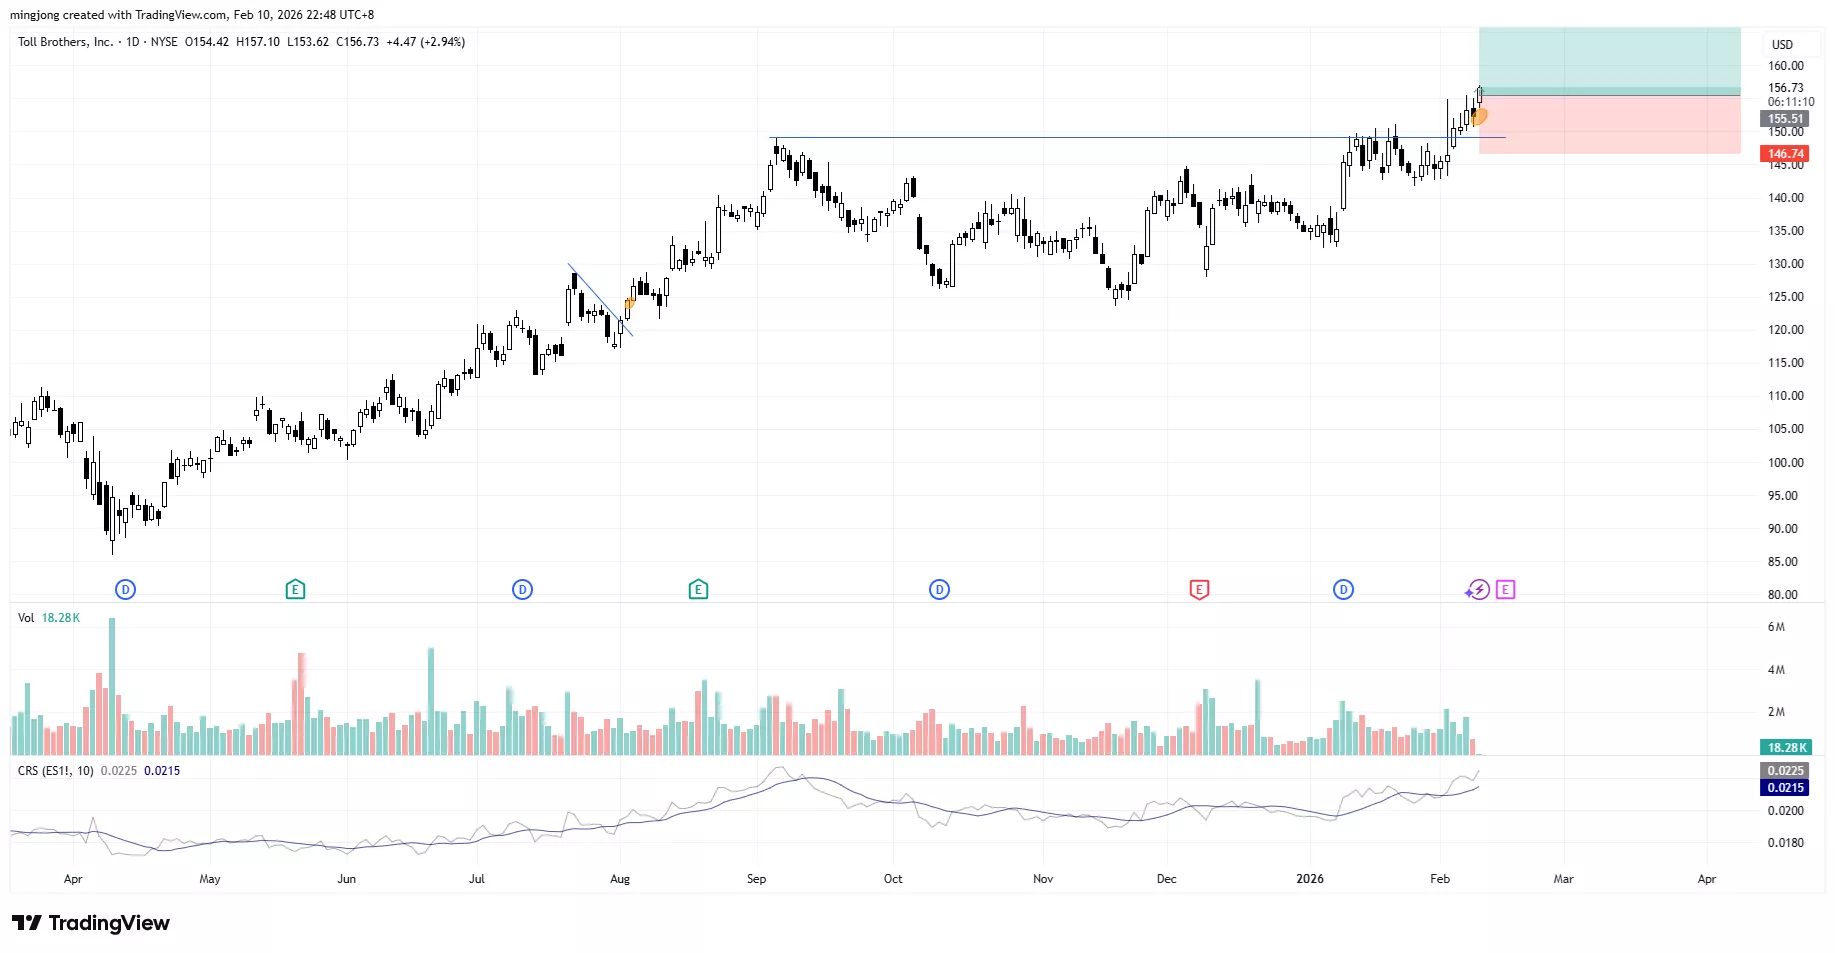
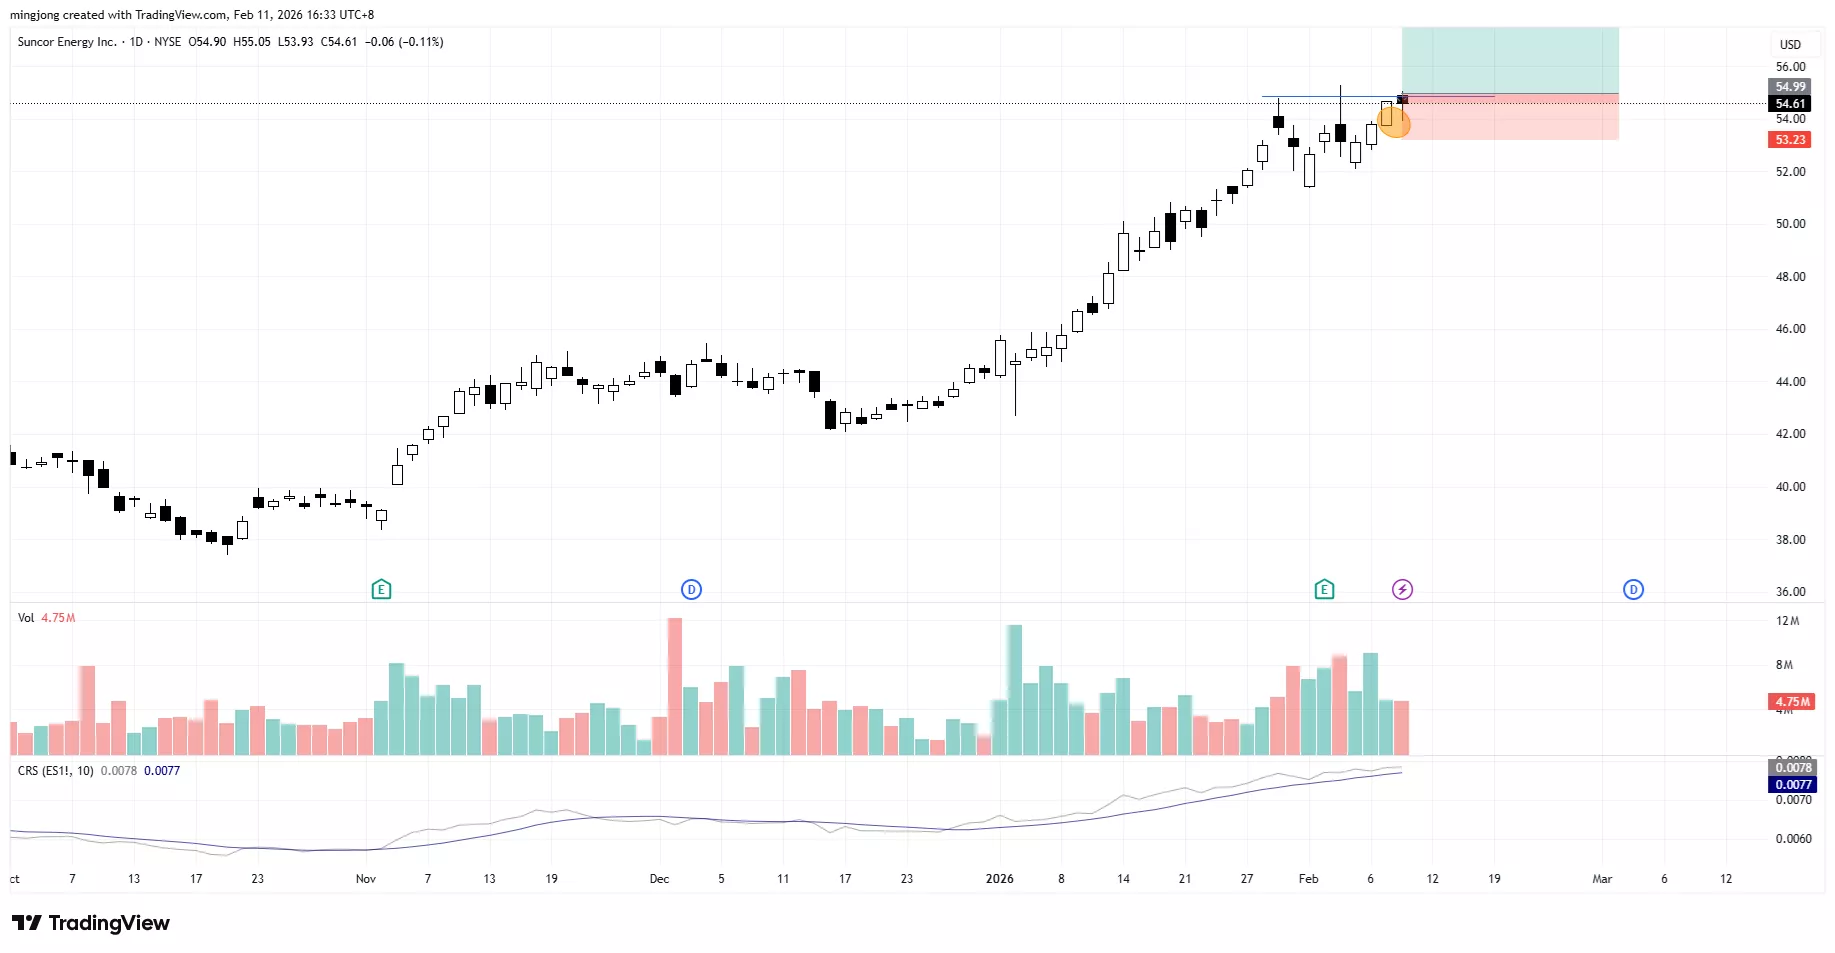
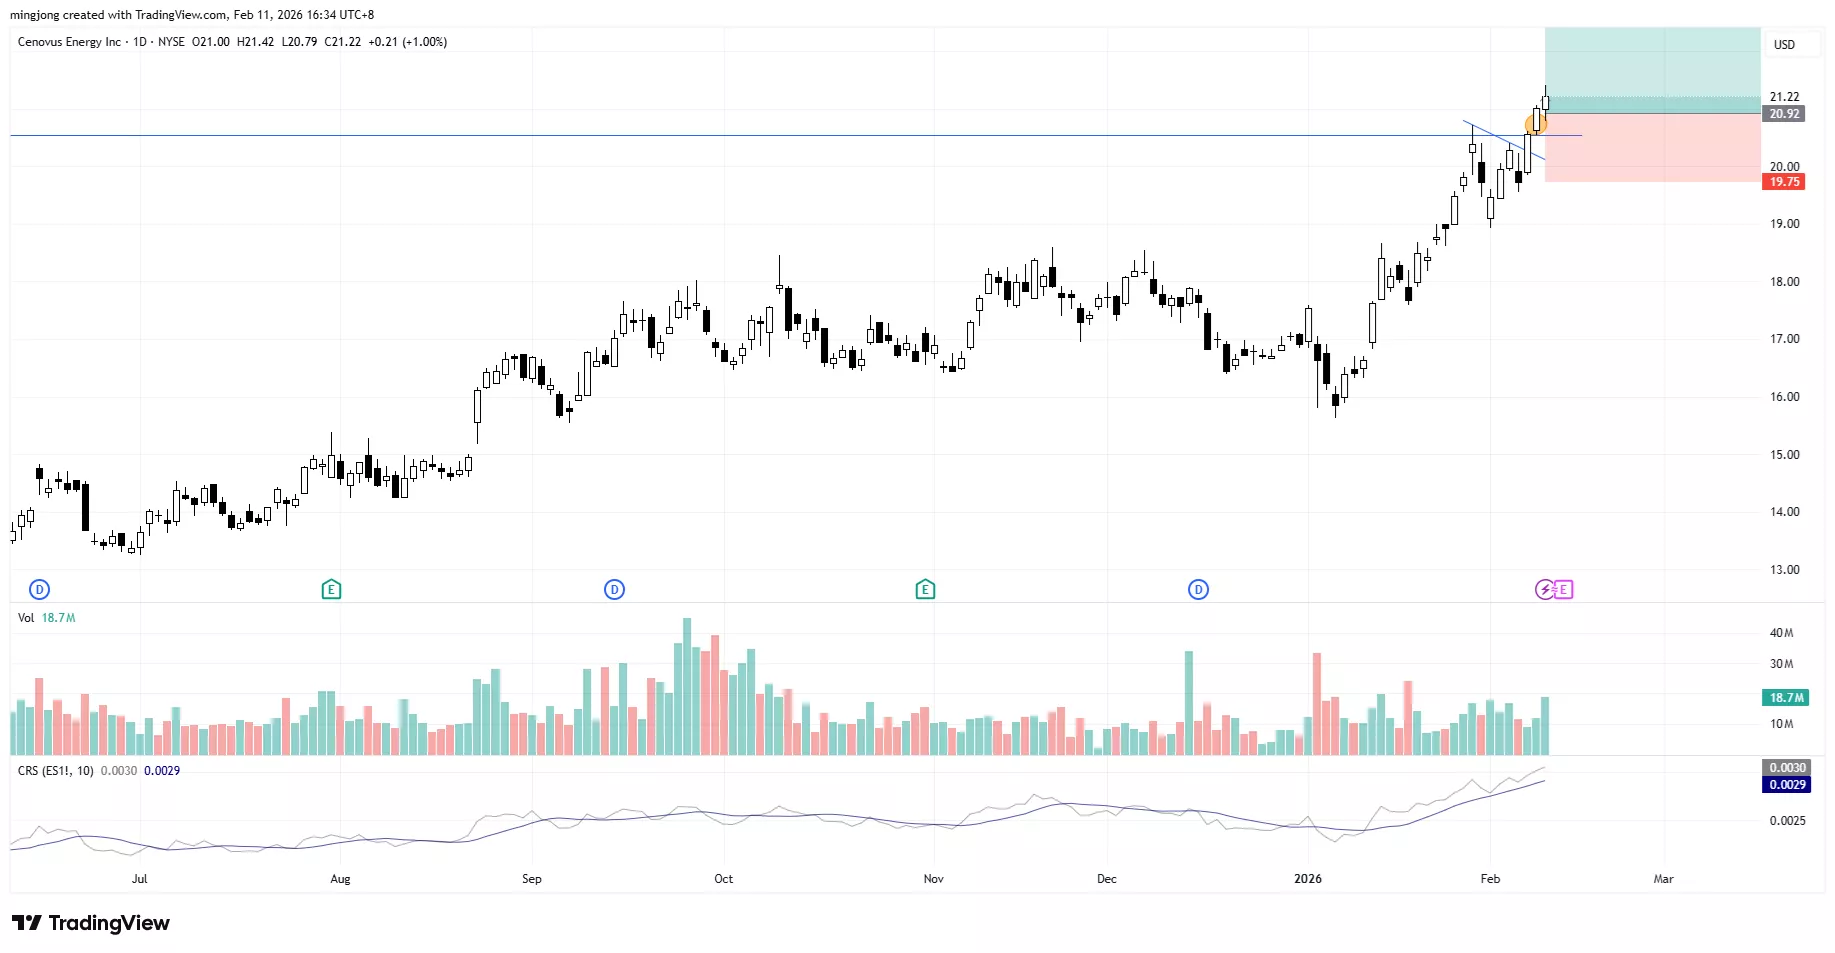
19 actionable setups such as TOL, SU, CVE were discussed during the live session on 10 Feb 2026 before the market open (BMO).
(Click on image to enlarge)
(Click on image to enlarge)
(Click on image to enlarge)
More By This Author:
This Price Zone Has Saved The S&P 500 4 Times In A Row (Here's Why)
The S&P 500 "Spring Trap" That Fooled 90% Of Traders
S&P 500 Just Flashed This Rare Signal — Here's What Smart Traders Do Next


Comments
Log in or sign up to join the conversation.