
SPX Monitoring purposes; Long SPX 6/21/23 at 4365.69.
Long SPX on 2/6/23 at 4110.98; Sold 6/16/23 at 4409.59 = gain of 7.26%.
Monitoring purposes GOLD: Long GDX on 10/9/20 at 40.78.
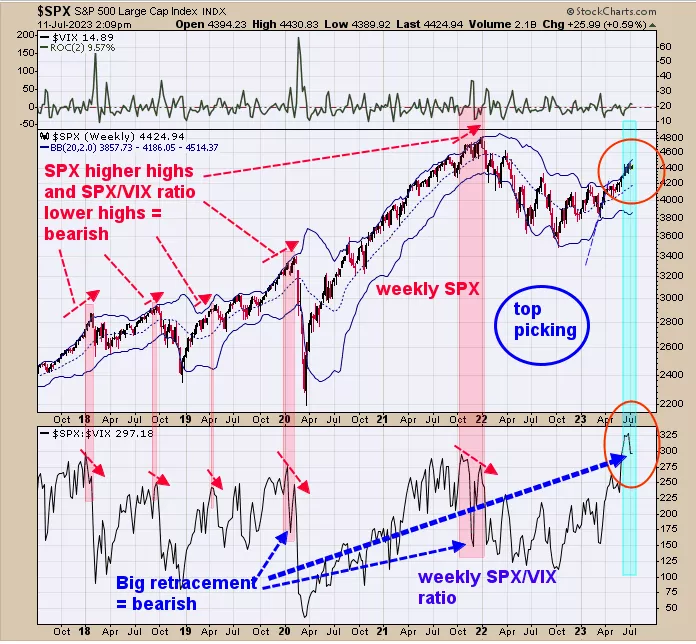
The bottom window is the weekly SPX/VIX ratio and the next higher window is the weekly SPX. We pointed out the times when the SPX weekly has a minor retracement and the SPX/VIX ratio has a large retracement. This doesn’t happen all the time but when it does is a good warning that the market may be near a high. The SPY was up five days in a row going into Monday (July 3) which predicts the market will be higher within five days 85% of the time. If the market does make a higher high this week or next week and the SPX/VIX ratio makes a lower high a divergence will show up. We noted the previous divergences shaded light pink on the chart above and all came near highs in the SPX. Evidence is growing that a high in the SPX may not be far off.
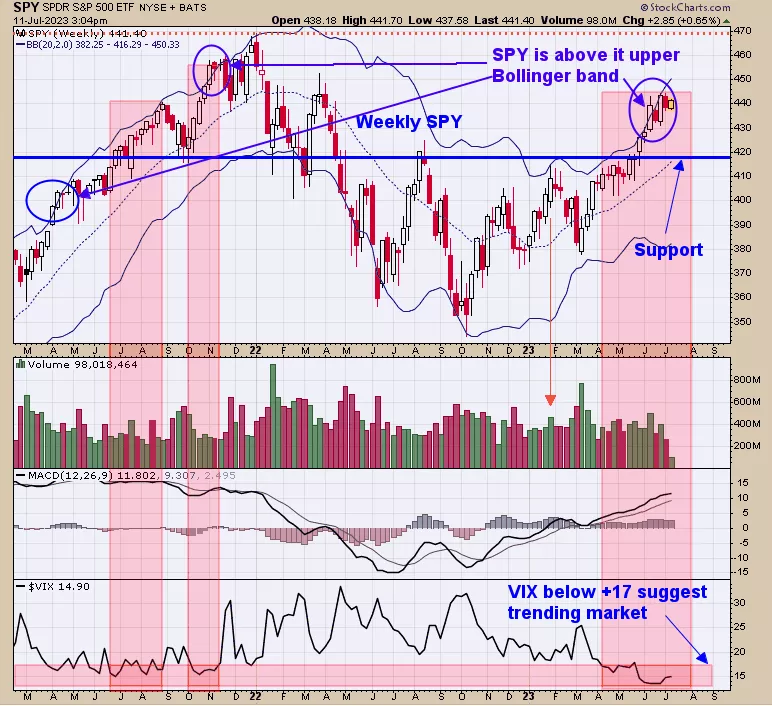
Above is the weekly SPY (top window) with its Bollinger Band. SPY is usually near a stall area when half of the trading range closes above the weekly upper Bollinger band. We noted those times with a blue circle on the chart above. The bottom window is the weekly VIX; readings below 17 suggest a trending market is in force and the current close is 14.90. A close above 17 on the VIX will suggests a pull back in the market is nearing. SPY Uptrend is in tact but signs are present that a pull back is not far off.
More By This Author:
An Extended Rally
Upward Trend Remains Intact
“Surge Pattern”


Comments
Log in or sign up to join the conversation.