
SPX Monitoring purposes; Long SPX on 2/6/23 at 4110.98
Monitoring purposes GOLD: Long GDX on 10/9/20 at 40.78.
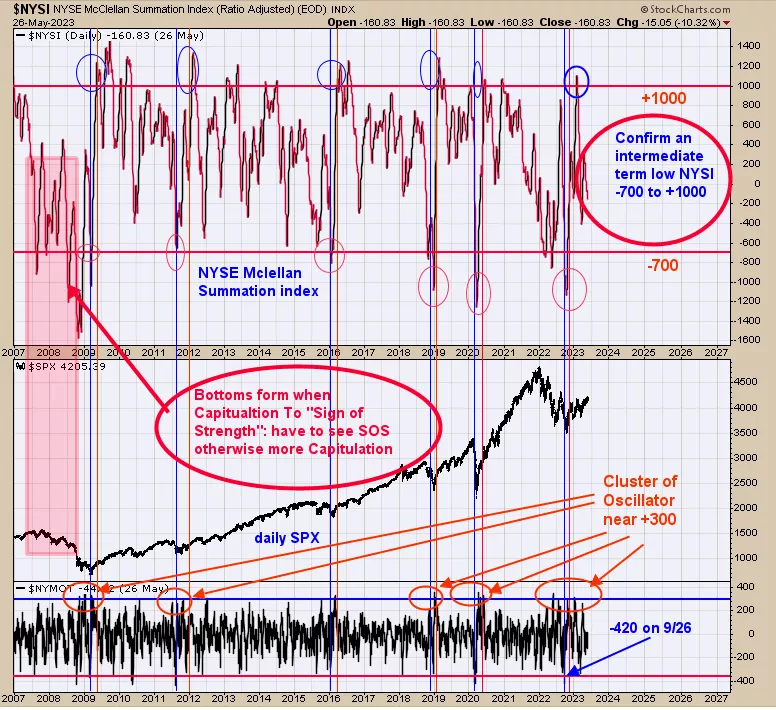
Short term picture is a little messy. There is an open gap for May 5 near 407 SPY that still could be tested. But the bigger picture looks fine. Above is the NYSE McClellan Summation index going back to 2007. Capitulation happens when the Summation index falls below -700 (marked with blue lines). Capitulation must be followed with a “Sign of Strength” to confirm a bottom in the market. A “Sign of Strength” is a Summation index reading above +1000 (marked with red lines). As you can see capitulation in the Summation index below -700 appeared in October of last year and a “Sign of Strength” with a Summation index above +1000 came in January of this year confirming a market bottom. Bottoms form when capitulation to “Sign of Strength” forms. Have to see “Sign of Strength” of capitulation otherwise more capitulation which what happen in 2008 decline.
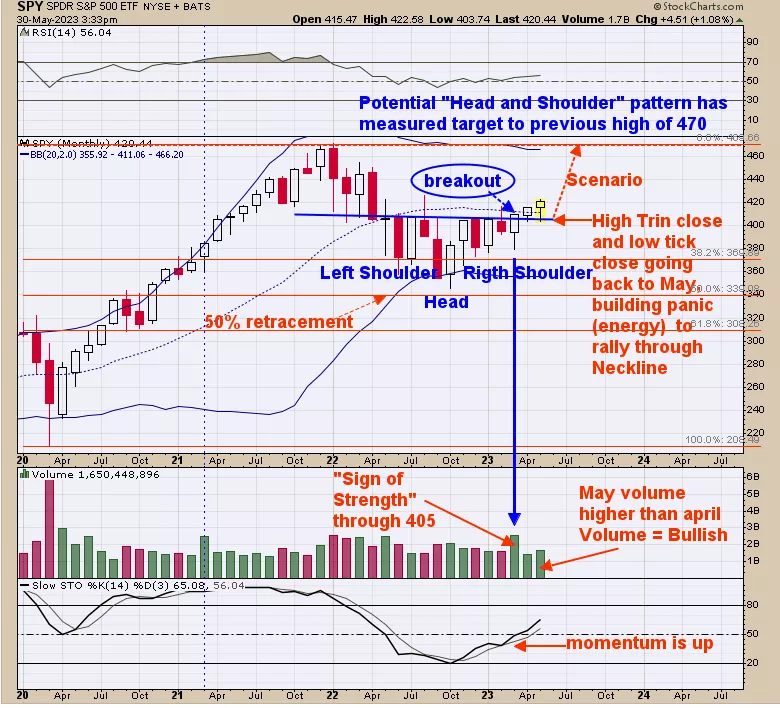
Last Thursday we said, “Above is the monthly SPY going back to 2020. The retracement from the March 2020 low to January 2022 came in a little less than 50%. A 50% retracement suggests at least a test of the previous high (near the 470 SPY) or the half way point of the move up (which gives target to 610 SPY). A “Sign of Strength” was performed in March and closed above the Neckline of a Head and Shoulders bottom confirm this pattern. This Head and Shoulders pattern has measured target to 460 range and not far from the January 2022 high near 470. The bottom window is the monthly Slow Stochastic (momentum indicator) which turned up last October. Momentum rules all indicators and momentum is up for the SPY.” Added to above; notice that May volume is higher than April volume and a bullish sign.
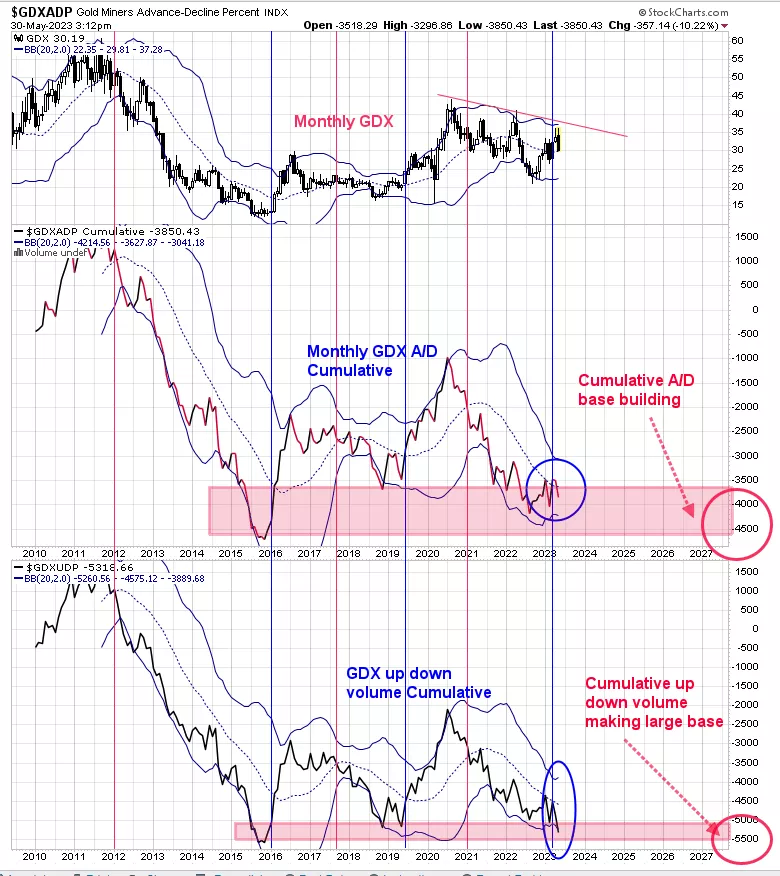
Above is the monthly Cumulative up down volume and advance/decline for GDX. We took a closer look on the monthly GDX over the last week. What appears to be developing is a basing period for both indicators going back to 2016. The bottom window is the GDX monthly Cumulative Up Down volume. This indicator is near matching the low of 2016 and below the 2019 low and a support area. The next higher window is the GDX monthly cumulative Advance/Decline. This indicator is below the 2019 lows and above the 2016 low. Both indicators closed above their mid-Bollinger bands back in March of this year and both closed below their mid-Bollinger since negating March buy signal. We wished these two indicators went back more it time as that would have gleaned more information. GDX appears to be building a very large base that could produce an extended rally.
More By This Author:
Upward Trend Remains Intact“Surge Pattern”
SPX/VIX Ratio


Comments
Log in or sign up to join the conversation.