


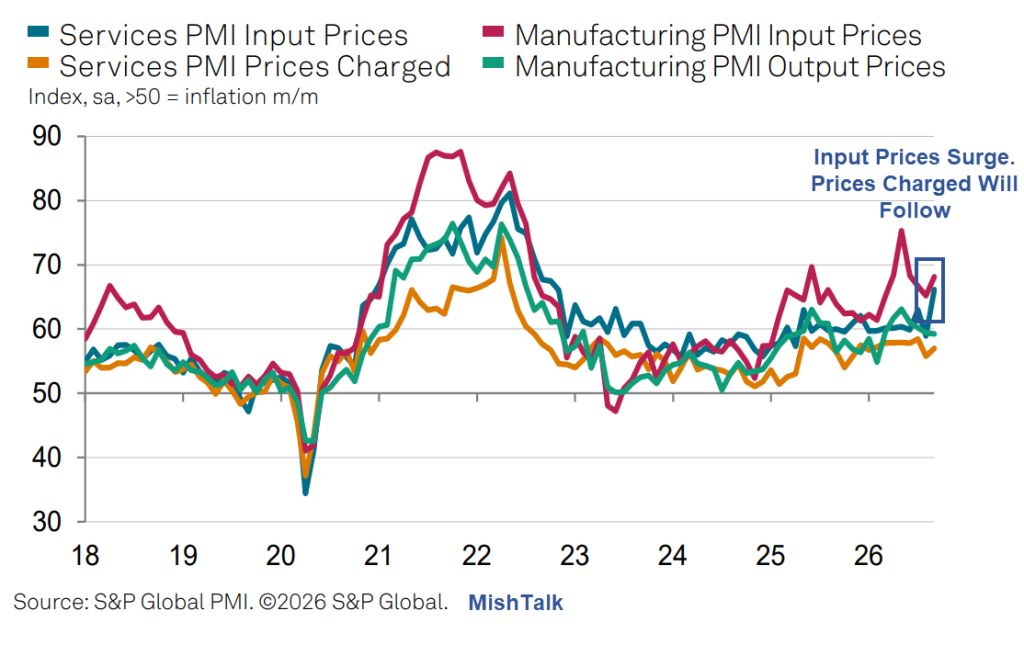
The S&P Services PMI is the trigger. Prices leap, and shortages are noted.
S&P Global US Flash PMI
Please consider the S&P Global US Flash PMI®
US business activity growth accelerated for a fourth successive month in September to reach the fastest rate for over five years. A further surge in service sector business activity was accompanied by a renewed improvement in manufacturing output growth. Employment also rose sharply, with jobs added at a pace not seen for over four years, as firms sought to meet rising demand. However, backlogs of work continued to rise at an increased rate and supply chain delays intensified, pointing to a lack of operating capacity which fed through to higher prices. Input costs meanwhile surged higher on the back of the recent spike in energy prices, adding to a worsening inflation picture.
Output and Demand
The headline flash S&P Global US PMI Composite Output Index rose from 56.0 in August to 58.4 in September, registering the fastest expansion since July 2021 and an acceleration of growth for a fourth successive month. Growth was driven by the service sector, which reported the steepest rise in output for over five years, but a welcome development in September was an accompanying acceleration of manufacturing output growth to the fastest since April 2022.
Price Pressures
Price pressures intensified in September. Average input costs measured across both goods and services surged higher, the overall rate of inflation hitting the highest since October 2022. The increase was blamed widely on higher fuel and transport costs, though wage pressures were also noted to have picked up in many cases. In manufacturing, high raw materials prices were also often linked to supply shortages; suppliers’ delivery times lengthened markedly again in September on average, with the incidence of supply chain delays the most widespread since July 2022. Input cost inflation in manufacturing nonetheless remained below the peaks seen earlier in the year, during the initial months of the war in the Middle East. Service sector input cost inflation hit the highest since November 2022. Selling price inflation also picked up in September, though was muted by competition in some instances, notably in the service sector. While above that seen in August, September’s overall selling price rise was below the rates seen between March and July.
Chris Williamson, Chief Business Economist at S&P Global Market Intelligence
Chris Williamson, Chief Business Economist at S&P Global Market Intelligence: “US business continues to boom, with output growing at the fastest rate for over five years in September. Historical comparisons suggest that the latest survey data point to annualized growth of around 5% with a 4% gain now signalled for the third quarter as a whole.
“To put the growth surge in context, barring the spike in demand following the opening up of the economy after the COVID-19 lockdowns, the latest improvement in business activity is the greatest recorded since early 2015. Business is clearly booming now in both manufacturing and services.
“However, this growth is being accompanied by some of the most severe supply chain bottlenecks seen in the near-two-decade survey history if the pandemic is excluded, with companies also reporting increasing problems finding suitable staff. Backlogs of work are consequently rising sharply.
While this accumulation of uncompleted orders bodes well for the further expansion of output and capacity in the coming months, it also indicates that companies are developing more pricing power, and hence is a worry for the inflation outlook.
“Firms’ input costs have meanwhile jumped in September at the steepest rate for four years, with fuel and transport costs spiking higher thanks to the rise in oil prices seen during the month, which will add further to the upward pressure on selling prices and inflation in the coming months.”
Bond Market Reaction
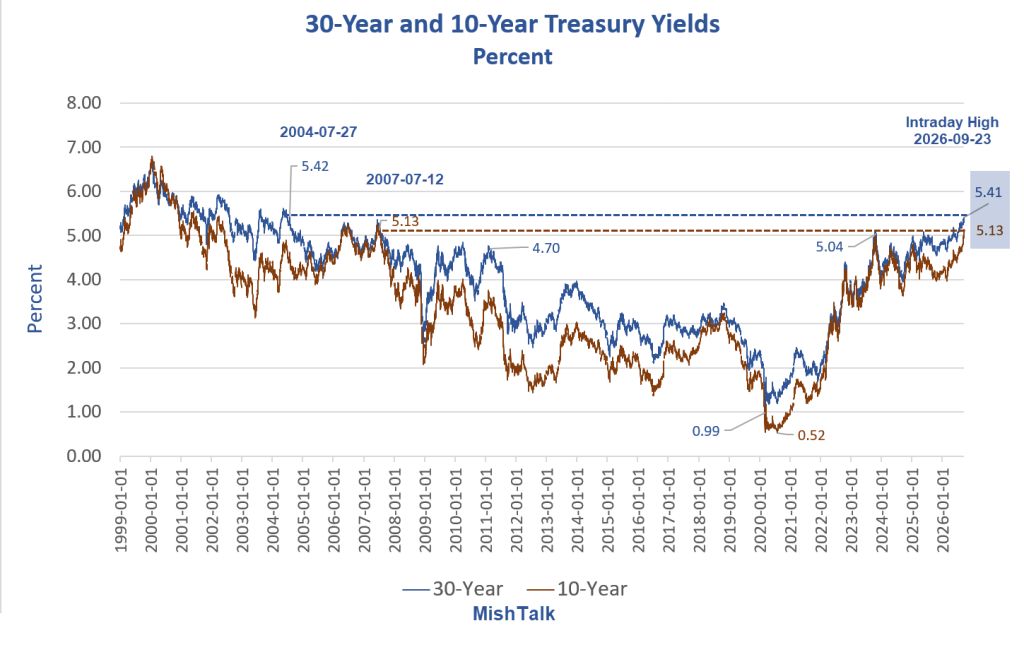
30-year and 10-year yields from the US Treasury Department, except current yield.
30-year and 10-year Yield Notes
30-year: 5.41 percent – the highest since July 27, 2024, over 22 years.
10-year: 5.13 percent – the highest since July 12, 2007, over 19 years.
When Does Yield Surge End?
A recession severely reduces demand
The AI boom ends
The war in Iran ends, and supply chains return to normal
It will take some combination of the above, perhaps all three.
Related Posts
September 22, 2026: The Average Supertanker Cost Is $1.2 Million per Day, Up from $29,900
High earnings for the biggest oil carriers spread to smaller vessels.
September 23, 2026: Energy Secretary Discusses a Voluntary Cap on Diesel Exports, Not a Ban
The idea is sure to annoy everyone for being too much or not enough.



Comments
Log in or sign up to join the conversation.