

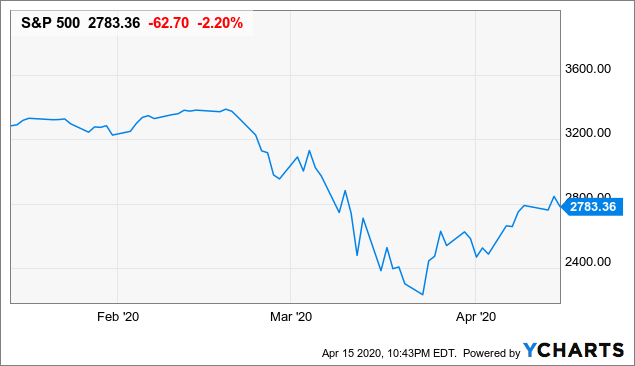
We are living through unprecedented times in the market. After the sharpest decline in history, meaning the fastest decline of 30% or more from the highs, markets made a spectacular recovery in just a couple of weeks.
As of the time of this writing, the S&P 500 is down by 18% from its highs of the year, and it is also up by 27% from the lows, which shows how violent and abrupt the market fluctuations have been.
The kinds of moves that generally take several months or even more than a year to play out are currently happening over a few weeks, which is obviously nerve-wracking and a major source of uncertainty for investors.
(Click on image to enlarge)
Data by YCharts
The bearish argument is that all we have seen is just a dead cat bounce, which is something that tends to happen very frequently during long-term bear markets. The economic data remains horrendous, so the macro fundamentals provide support to the idea that the worst is yet to come.

Source: TrustedTrading
The bulls, on the other hand, argue that massive monetary and fiscal stimuli, combined with better than expected COVID-19 data in New York are triggering a new bull market. After all, the stock market is an anticipatory mechanism, so price movements depend on forward-looking expectations and not on past data.
The cold hard truth is that nobody knows for certain what the future will bring. However, we don't need a crystal ball to do well in the market over the long term. Having a solid and consistent plan based on time-proven indicators is a much more effective and realistic approach.
The Right Mindset To Understand The Game
Every time a so-called "market pundit" makes a big market prediction with exuberant confidence and leaving no room for error in the prediction, this makes me cringe. Those who make those kinds of deterministic market calls are either trying to sell you something or they don't understand the nature of the game at all.
Making overconfident predictions in the stock market is a very dangerous proposition. Better said, it can be very lucrative for the so-called guru, but quite detrimental to those who put their money behind the predictions.
We are not in the business of divination, our job is to analyze the weight of the evidence and make risk-management decisions based on the data and what this means in terms of probabilities going forward.
A game of Poker can be a good analogy. When you are playing Poker, you look at every new card on the table and you assess what the probabilities are based on the incoming information. You manage your risk exposure - betting big or betting small - depending on what those probabilities are.
It is crucial to understand two key concepts here. First, you are always dealing with probabilities, you don't have any certainties. You can still lose with a strong hand and vice-versa. Second, the probabilities are dynamic as opposed to static, meaning that these probabilities change with every new piece of information.
In the words of Martin Zweig:
“I measure what's going on, and I adapt to it. I try to get my ego out of the way"
The Roadmap For Bear Markets
Every bear market is different to some degree, but human emotions tend to produce some consistent behaviors over time. The roadmap for these kinds of markets generally follows a recurrent pattern.
- A shocking decline and a panic bottom.
- A relief rally after the decline, which typically recovers something like 30%-40% of the initial losses.
- A disappointment phase with plenty of sideways volatility and frustration for both the bulls and the bears.
We already had a shocking decline and a massive counter-trend rally. Both phase 1 and phase 2 happened at unprecedented speed, but chances are that we are now in the disappointment phase of the bear market.
The historical evidence shows that many times the market makes a retest of the lows during this phase. This retest doesn't need to necessarily happen, but it has happened more often than not through the history of bear markets.
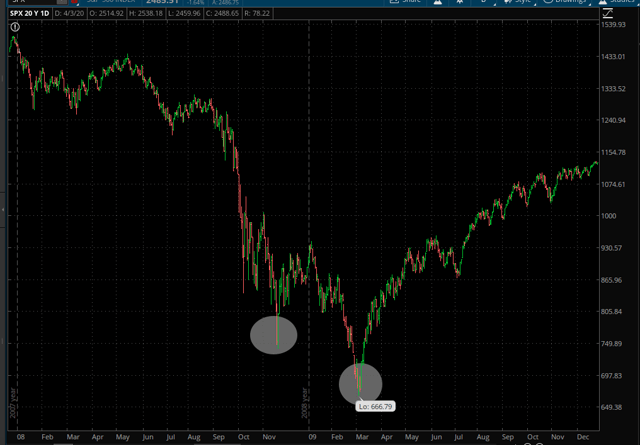
The worst-case scenario is that the market can break down during the retest. This is what happened during the Great Financial Crisis in 2008 and 2009, for example. The market first made an intermediate low in November of 2008 and then the final low came in March of 2009 at substantially lower prices.
(Click on image to enlarge)
Source: TOS
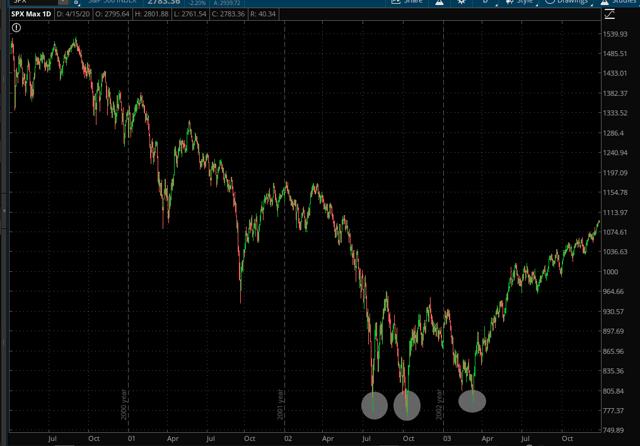
Through the dot com bubble in 2000-2003, we had several dead cat bounces in the context of a long-term downtrend. Then the markets bottomed in July and successfully retested those levels in October of 2002. Prices made a higher low in March of 2003, which triggered a huge long-term rally from there.
(Click on image to enlarge)
Source: TOS
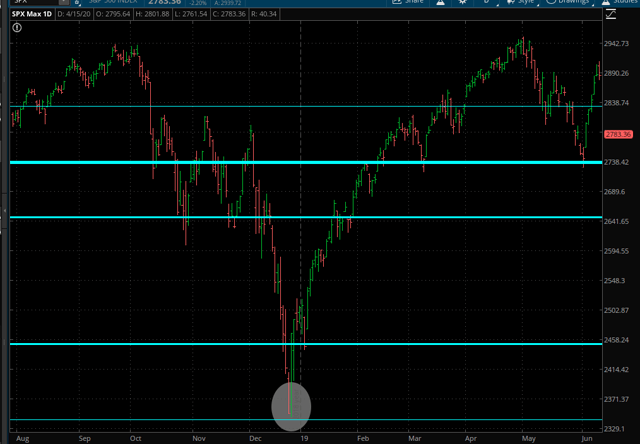
The big exception is the fourth quarter of 2018 when the market made a bottom and then a V-shaped recovery with no disappointment phase or retest of the lows whatsoever.
(Click on image to enlarge)
Source: ToS.
None of these 3 historical cases can tell us exactly what will happen in the future, but they can provide a framework to understand the different potential scenarios going forward.
My Plan For Risk Management
Back in January, we raised lots of cash in the portfolio because there was too much optimism in the market. Corrections and other bad things tend to happen when markets are complacent, so we raised cash levels to 50%.
I was expecting a correction at the time, and we got much more than that. The market produced the sharpest decline ever in history, with prices reaching deeply oversold levels. In such a context, we increased stock exposure to 70% of the portfolio as prices declined.
Importantly, the market environment changed during this period. We are now in a bear market and in the midst of a recession, this is very different from having a correction during a bull market and in a growing economy.
As markets strongly rebounded after March 23, we took some chips off the table to reduce risk, and now we have 45% in cash again, so the portfolio is quite protected once again.
Moving forward, there are 3 key positive signs in the market.
1. The Fed is making unprecedented moves to provide massive amounts of liquidity, substantially reducing the probabilities of the recession turning into a full-blown financial crisis. This is very important because it reduces a major risk factor in the market.
2. The COVID-19 data is clearly evolving well, with key variables such as new contagions and hospitalizations moving in the right direction in New York. There is always the possibility that we could see a turn for the worse in different regions and a new wave of contagions once the economy goes back to work is a particularly concerning risk. But it is what it is right now, the situation is improving and there are increasingly active talks about jumpstarting the economy sooner rather than later.
3. The market itself has provided some encouraging signs, with market leaders like Amazon (AMZN) and Microsoft (MSFT) leading prices higher for growth stocks and some breadth metrics showing improvements under the surface.
These 3 factors are probably putting some kind of floor in the market. As long as the Fed is being aggressive, the COVID-19 data keeps improving, and the market leaders continue leading higher, chances are that the damage will be contained.
I am not saying that we won't have another leg lower, on the contrary, this is actually quite likely. We are in the midst of earnings season during terribly challenging times for most businesses on a global scale. Besides, there is little visibility on the future until the economy reopens, so guidance is cloudy and uncertain, and the market hates uncertainty. There is a considerable chance that we will face substantial volatility in the short term, and we need to be prepared for that.
However, as long as the three main drivers - the Fed, the COVID-19 data, and the market leadership - remain strong, it makes sense to consider adding to positions on short term pullbacks.
The Bottom Line
Again, this is not about making any predictions, but rather about assessing the probabilities based on the evidence and then managing portfolio exposure based on those probabilities. Investors should rather be thinking about how much risk they want to have right now and how they are planning to manage that risk in the near term as opposed to trying to guess the direction of the market.
I was personally 50% in stocks and 50% in cash when this bear market started, then I increased my exposure to 70% in stocks and 30% in cash as markets declined. After that, I sold some positions and went to 45% in cash with the sharp market rebound from the lows.
If the Fed, the COVID-19 data, and the price action under the surface remain strong, then I am planning to increase my exposure during pullbacks. This is based on the idea that the March 23 lows should not break down as long as these 3 market tailwinds remain in place. If the evidence changes then the probabilities change too, so the risk management plan needs to change in order to adapt to the new evidence.
Importantly, this plan is not perfect or infallible, and it doesn't intend to be so. The key point is that the plan is consistent and it is the right plan for me when considering my time horizon, risk tolerance levels, and overall investment strategy.


Comments
Log in or sign up to join the conversation.