

After a rough first half of the year, precious metals and mining stocks are booming again and have emerged as some of the best-performing assets in recent weeks, while the former market leaders, AI stocks, are now experiencing a rough patch of their own.
The latest precious metals rally began on July 21, and that very day I showed that they were breaking out and that the bottom was likely in (read it here). Few people believed it at the time, however. Pessimism abounded, and I faced considerable vitriol and a wave of unsubscriptions since the start of the year because of my unwavering message that the precious metals correction that began in late January was just a temporary cooling-off period and not at all the end of the long-term bull market that had begun a mere two years earlier.
It feels very good to be winning again and to see my bullish outlook vindicated, while those who doubted precious metals and threw in the towel too early are being left in the dust. I have no doubt they will be kicking themselves over the next decade as this bull market soars to astounding heights. I see gold hitting at least $15,000 an ounce and silver at least $300 to $500 an ounce, with mining stocks rising by an even greater percentage along the way. Read my report to learn more.
During this early-stage rebound in precious metals over the past few weeks, gold and gold miners have been the star performers, while silver and its miners have taken more of a backseat when adjusting for differences in volatility.
This behavior is not surprising, as gold is viewed as a more conservative asset than silver and therefore typically begins to rally first during the early stages of a precious metals rally or bull market. Then, as the bull market heats up and investor sentiment becomes increasingly bullish, the baton is passed to silver, which begins to outperform gold. Platinum group metals typically follow silver as the rally broadens even further.
As of today (Thursday), I am starting to see signs that silver is about to take the lead in this precious metals rebound, and assuming it does, that would be a very positive harbinger for the overall precious metals complex. Because of this, I decided to publish a report examining the fascinating and encouraging signs I am now seeing in silver and silver miners, along with the different ways to capitalize on what I believe is coming next.
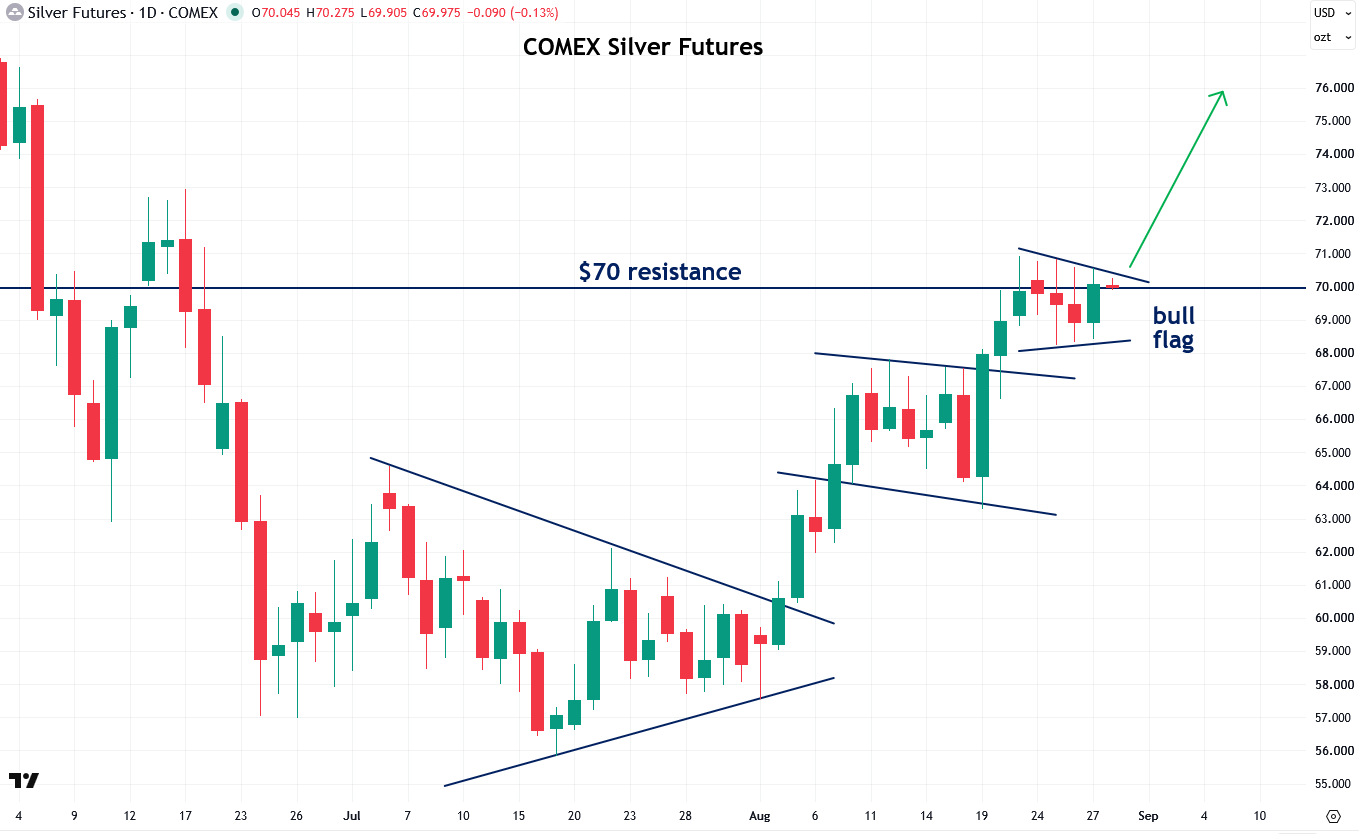
To start, let’s look at the daily chart of silver using COMEX silver futures. You’ll notice that during the rebound over the past month, silver has formed a series of consolidation patterns, including the triangle in July, with each subsequent breakout leading to further gains.
This consolidation-and-rally pattern is healthy behavior because it allows silver to digest its gains without becoming overheated too quickly. You can think of it as silver climbing a staircase, pausing periodically before taking the next step higher.
Interestingly, over the past week or so, while gold was getting most of the attention, silver has been trading sideways, and I noticed some investors growing impatient with it for not moving more aggressively. But the fact is that silver has been forming a pattern known as a bull flag, a bullish continuation pattern that typically leads to further gains upon a successful breakout.
What makes this bull flag even more significant is that it is forming just below silver’s key $70 resistance level, which has played a major role over the past year and helps explain exactly why silver paused for breath where it did. What I am watching for now is a decisive breakout from the bull flag on strong volume for confirmation that the next leg higher is underway. Read my tutorial to learn more about the importance of strong volume during breakouts.
Friday marks the Federal Reserve’s annual meeting in Jackson Hole, Wyoming, which is always a heavily anticipated event, but even more so this year because it will be new Fed Chair Kevin Warsh’s first time there. Practically the entire financial world will be awaiting his speech and any clues about how he plans to tackle the country’s stubborn inflation problem. There is strong potential for the event to serve as a major catalyst that causes silver to break out from its bull flag, though this is just a theory and not a hard prediction.
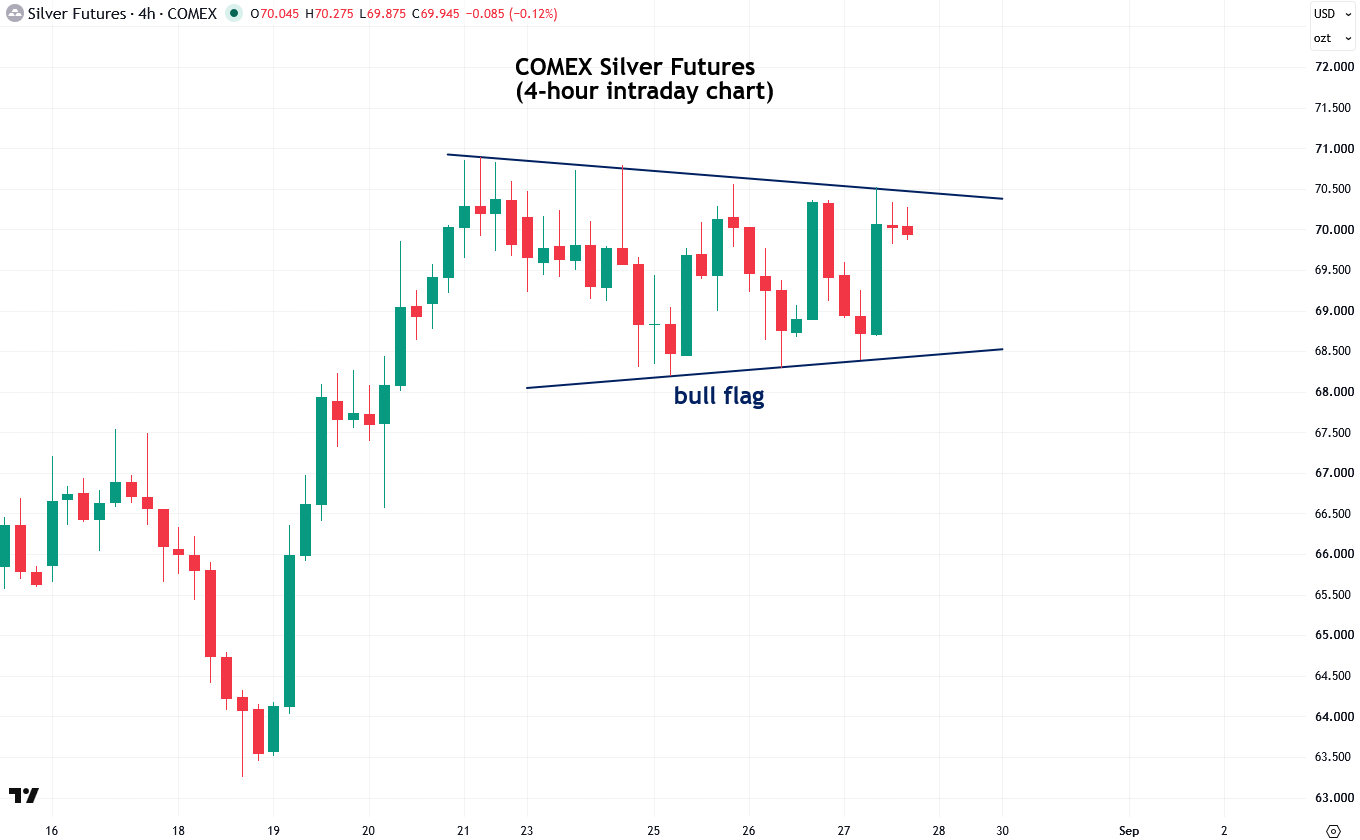
Silver’s four-hour intraday chart shows this bull flag even more clearly. This is definitely a pattern indicating that something big is brewing, but as always, it needs to be confirmed by a decisive upside breakout on strong volume.
Because the trend leading into this pattern was bullish, the odds favor an upside breakout, as a bull flag is a continuation pattern. However, if it were to break down instead for whatever reason, such as Kevin Warsh taking a much more hawkish tone than anticipated, I would respect that signal rather than fight the trend.
I see the odds of a breakdown as lower than those of an upside breakout, but everything in trading is ultimately a matter of probability. You have to remain aware of all potential outcomes and be prepared to act accordingly.
The next chart, which is the same one I’ve been showing in my regular updates, puts the bull flag that has formed over the past week into the broader context of silver’s key support and resistance zones.
Earlier in this report, I mentioned the significance of silver’s $70 resistance level, and now we can see exactly why it is so important. It represents the upper boundary of the key $60 to $70 resistance zone that formed at the major lows between December and June.

Comments
Log in or sign up to join the conversation.