


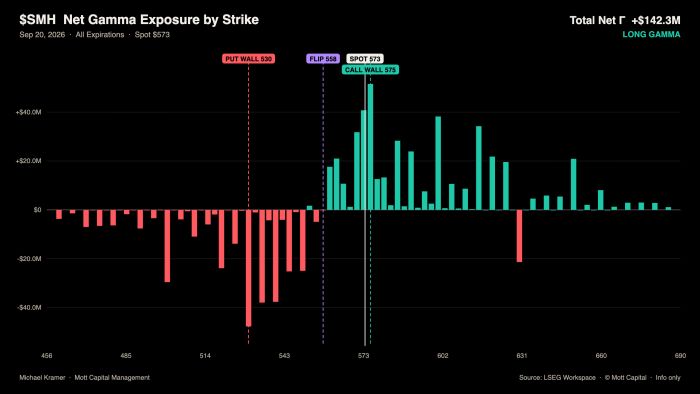
Options expiration is now behind us, so the pinning effects we have been seeing should begin to ease. The big sector to watch will, of course, be the semiconductors. While we have seen breadth deteriorating across the market and weakness in the equal-weight S&P 500, the semis have managed to hold together, largely because the put wall in the SMH has been solid.
The put wall in the SMH appears to be at $530 for Monday’s trading session, with the call wall at $575. So there is an opportunity for the semis to roll lower this week. This has been the one group helping to hold the S&P 500 together while everything else looks weak.
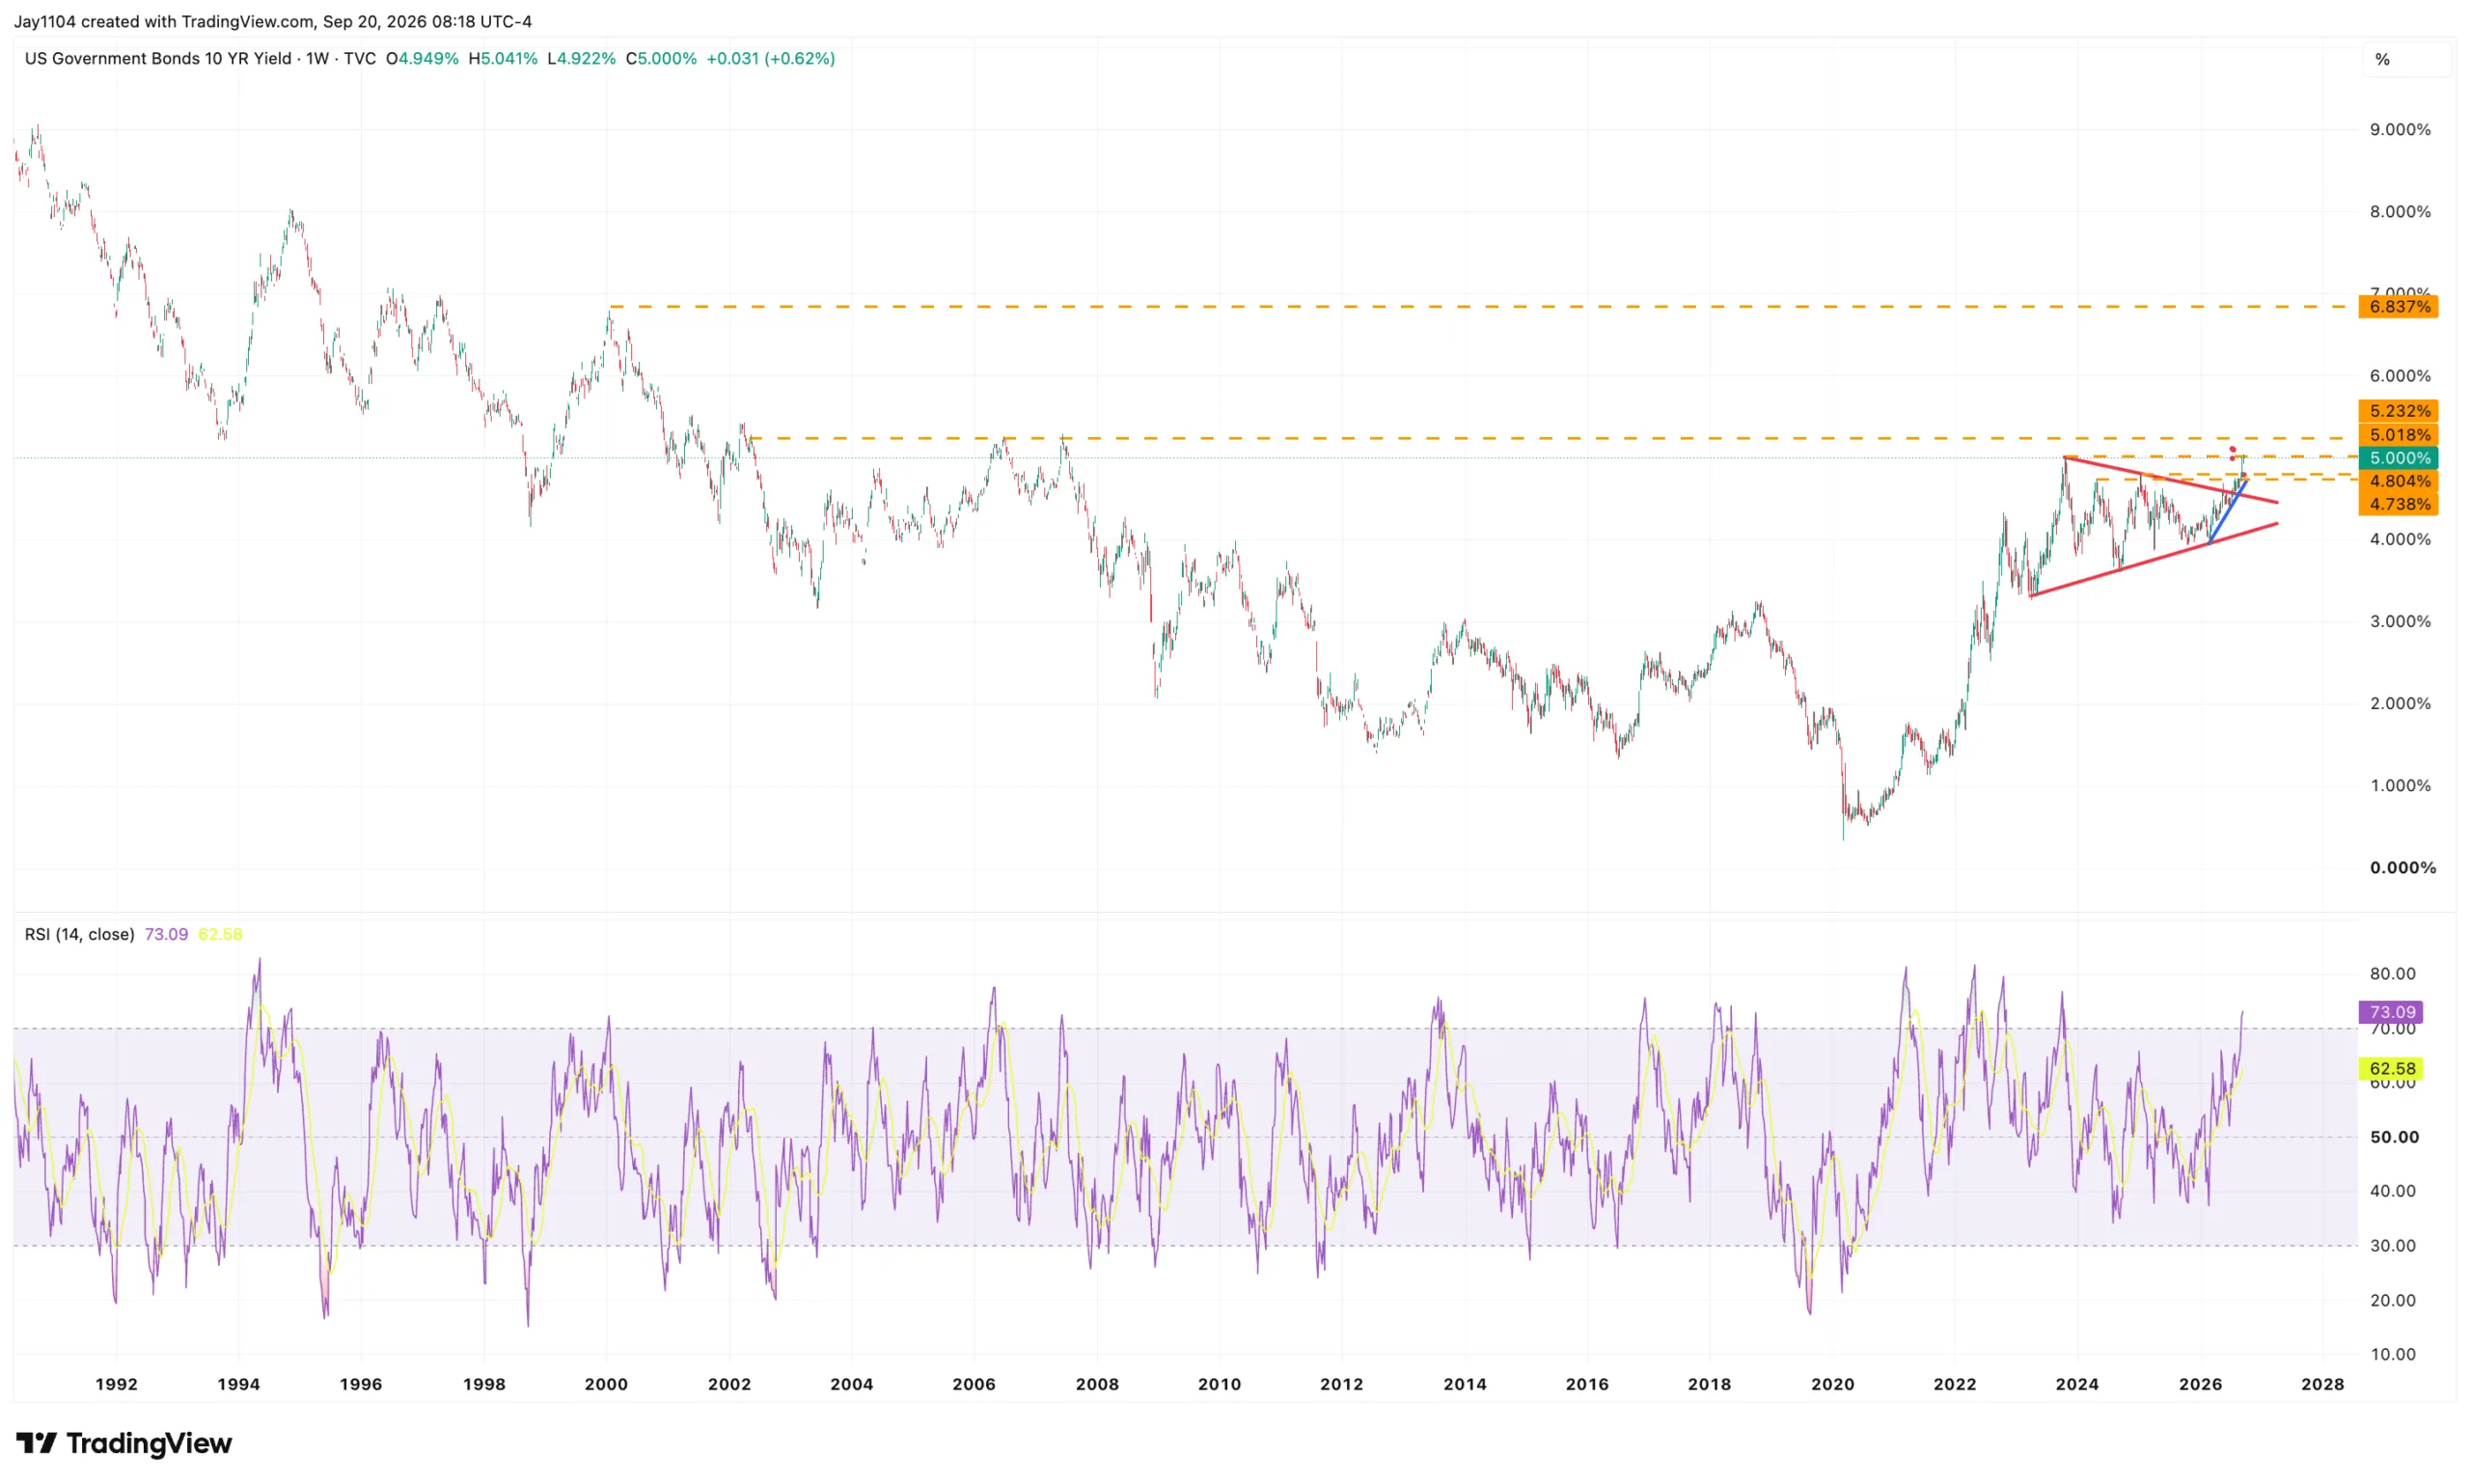
Meanwhile, when we turn to bonds, yields moved higher on Friday, with the 10-year rising to and closing at 5%. As a major round-number threshold that the 10-year has rarely traded above in more than two decades, 5% is an important psychological level, so some consolidation here is not surprising. If yields begin to pull away from 5%, the next area of resistance lies around 5.25%, a region that dates back to May 2002.
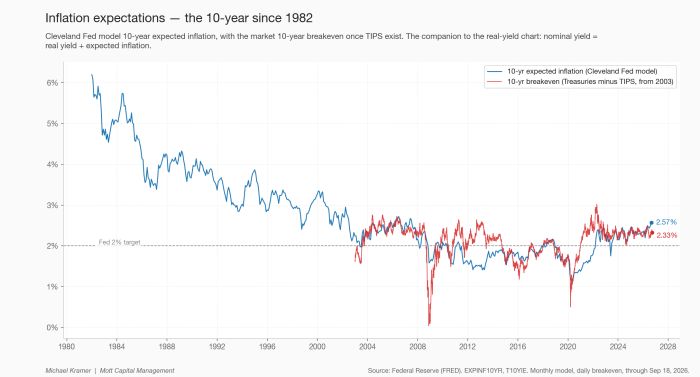
One interesting thing is the divergence we are starting to see between what the Cleveland Fed models and what the market is pricing in for inflation expectations. The Cleveland Fed’s 10-year inflation expectations model has been steadily rising in recent months, while the 10-year breakeven rate has remained consistently flat.
What makes this divergence particularly interesting is that it runs counter to what we normally see. In both 2012 and 2021–2022, the market moved first, and the Cleveland Fed model followed. This time, the model is rising to 2.57%, while the 10-year breakeven sits flat around 2.33%. The model is now above the market, which has mostly happened in the past when breakevens were collapsing, as in 2008 and 2020, not when the model was climbing. So, in this case, the market may be becoming too complacent about inflation expectations.
If breakevens eventually begin to catch up with the Cleveland Fed model, it could add another source of upward pressure on nominal Treasury yields. That would matter for equities because stocks are already dealing with higher real yields. A rise in inflation expectations that pushes nominal yields even higher would tighten financial conditions further and put additional pressure on equity valuations, particularly in the higher-multiple parts of the market.
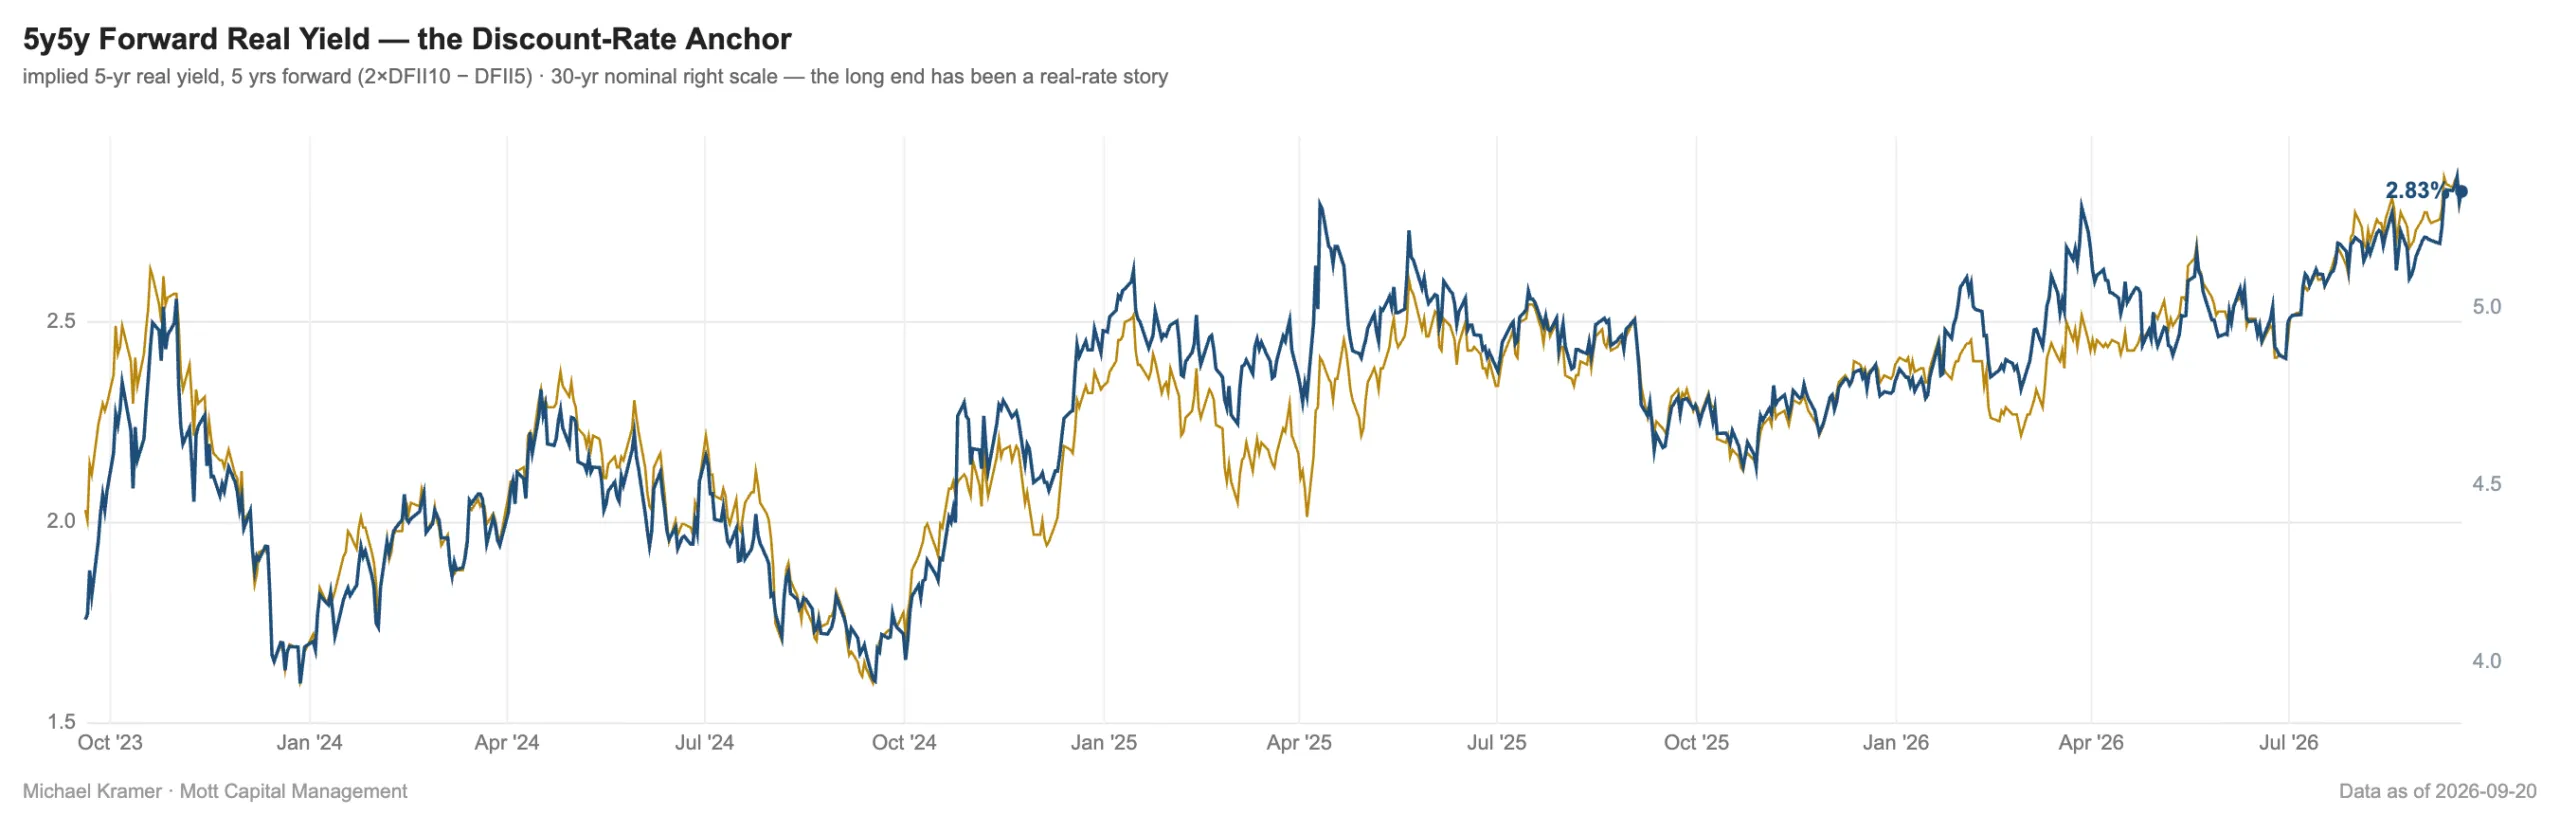
The one thing that has been consistently rising, and helps explain why long-term rates continue to move higher, is the market’s estimate of the future neutral real rate. The 5Y5Y forward real yield has now reached 2.83%, suggesting the market continues to price in a higher neutral rate further out.
That matters because the 30-year Treasury yield and the 5Y5Y forward real yield have historically moved closely together. So as the market continues to reprice the longer-term neutral rate higher, it is pulling long-term Treasury yields higher.
More importantly, this suggests the move in long-term rates is not simply about inflation expectations or near-term Fed policy. The market appears to be repricing the real interest rate level the economy can sustain over the longer term. If that repricing continues, it could keep upward pressure on long-term Treasury yields even if inflation expectations remain relatively contained. That would also mean financial conditions could continue to tighten through higher real rates, creating an increasingly difficult backdrop for equity valuation.
So the rise we are seeing in yields right now is happening for fundamental reasons and is unlikely to reverse sharply unless we see a meaningful change in the data. At least based on Kalshi data, headline CPI is expected to rise 0.6% m/m in September. Based on those estimates, that change does not appear to be coming in the September data.
Meanwhile, why is the Fed raising rates, and how much of the inflation problem is just energy? I built a crude model with Claude’s help and haven’t finished running all the checks. But even after stripping out food and energy, 63% of core PCE spending is in categories where prices are rising faster than 3% y/y (the orange line). From 2000 to 2019, that averaged about 35%. So this is not just an energy story. Warsh pointed to this same broad persistence in his Jackson Hole speech.
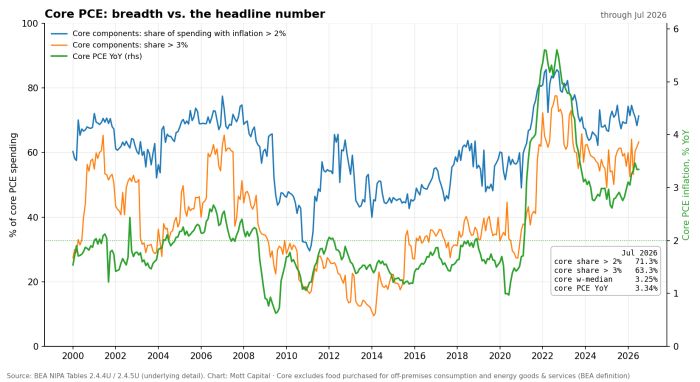
So if you are in the camp that the Fed is making a mistake, or that rates are about to come back down sharply, the market and the data are telling a very different story. For now, both suggest that rates are likely to remain higher unless something meaningfully changes.


Comments
Log in or sign up to join the conversation.