

In this report, I’m going to discuss my current thoughts on the energy sector and some interesting opportunities I am seeing to take advantage of what I expect will be a major energy supercycle in the years ahead. While I expect a powerful commodities supercycle over the next decade, including in energy, I have nevertheless been reluctant to get involved in energy investments since the U.S.-Iran war began due to the extreme geopolitical uncertainty and risk.
The erratic, on-again, off-again nature of peace deal discussions in recent months has caused wild gyrations in energy prices, making the sector virtually impossible to read. However, it is now becoming increasingly apparent that there will be no peace deal anytime soon, and I am seeing some very interesting setups in the energy sector, so I decided to write this report to share them with you.
That said, I must emphasize the extreme risk associated with this sector right now. These opportunities are highly speculative and headline-driven and are not necessarily straightforward buy-and-hold investments. However, those who are more comfortable taking risks, like myself, may find these ideas interesting, while those who are not can still learn from the analysis in this report.
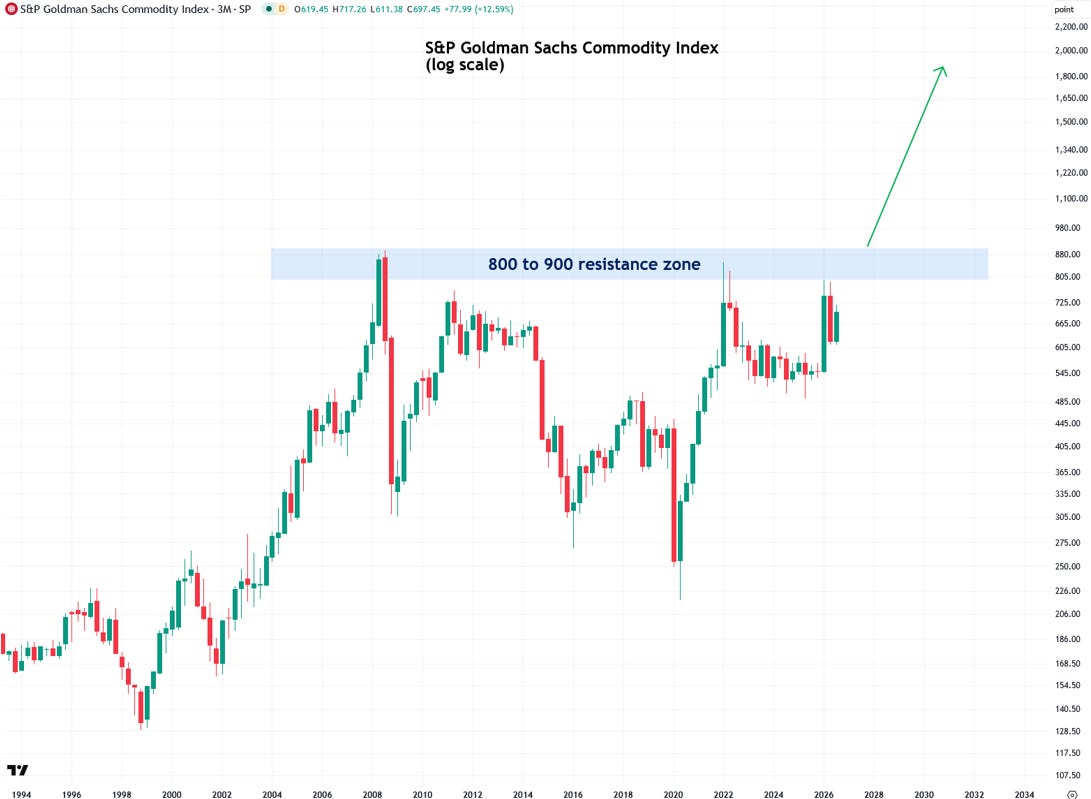
To start, I first want to show you the long-term chart of the GSCI Commodity Index, which can be thought of as the Dow or S&P 500 of commodity prices, over the past several decades. As the chart below shows, commodity prices have essentially treaded water since their 2008 peak, even as a tremendous amount of inflation has occurred during that time.
As a result, real, or inflation-adjusted, commodity prices have declined significantly and are now arguably the cheapest asset class in existence. I expect them to soon enter another powerful bull market, as I explained in detail in this report.
From a technical perspective, there is a clear resistance zone from 800 to 900 in the GSCI Commodity Index, formed by the major peaks in 2008, 2011, 2022, and early 2026. When the index finally breaks decisively above that resistance zone, which I believe will happen quite soon, I expect it to kick off another powerful commodities supercycle like those of the 1970s and 2000s.
To learn more about support and resistance zones, I recommend reading my two-part tutorial on the topic (Part 1 and Part 2).
I see this supercycle lasting at least a decade, as these cycles typically do, and driving prices dramatically higher across practically every commodity, including precious metals, industrial metals, energy, and agricultural commodities, as well as natural resources stocks. The result will be tremendous inflation that will be highly punishing to stocks and bonds.
While I’m bullish on commodities and natural resources across the board, this report focuses specifically on energy, so I next want to examine the technical setup in crude oil, starting with the U.S. benchmark, WTI, or light sweet crude oil. I will discuss the fundamentals shortly.
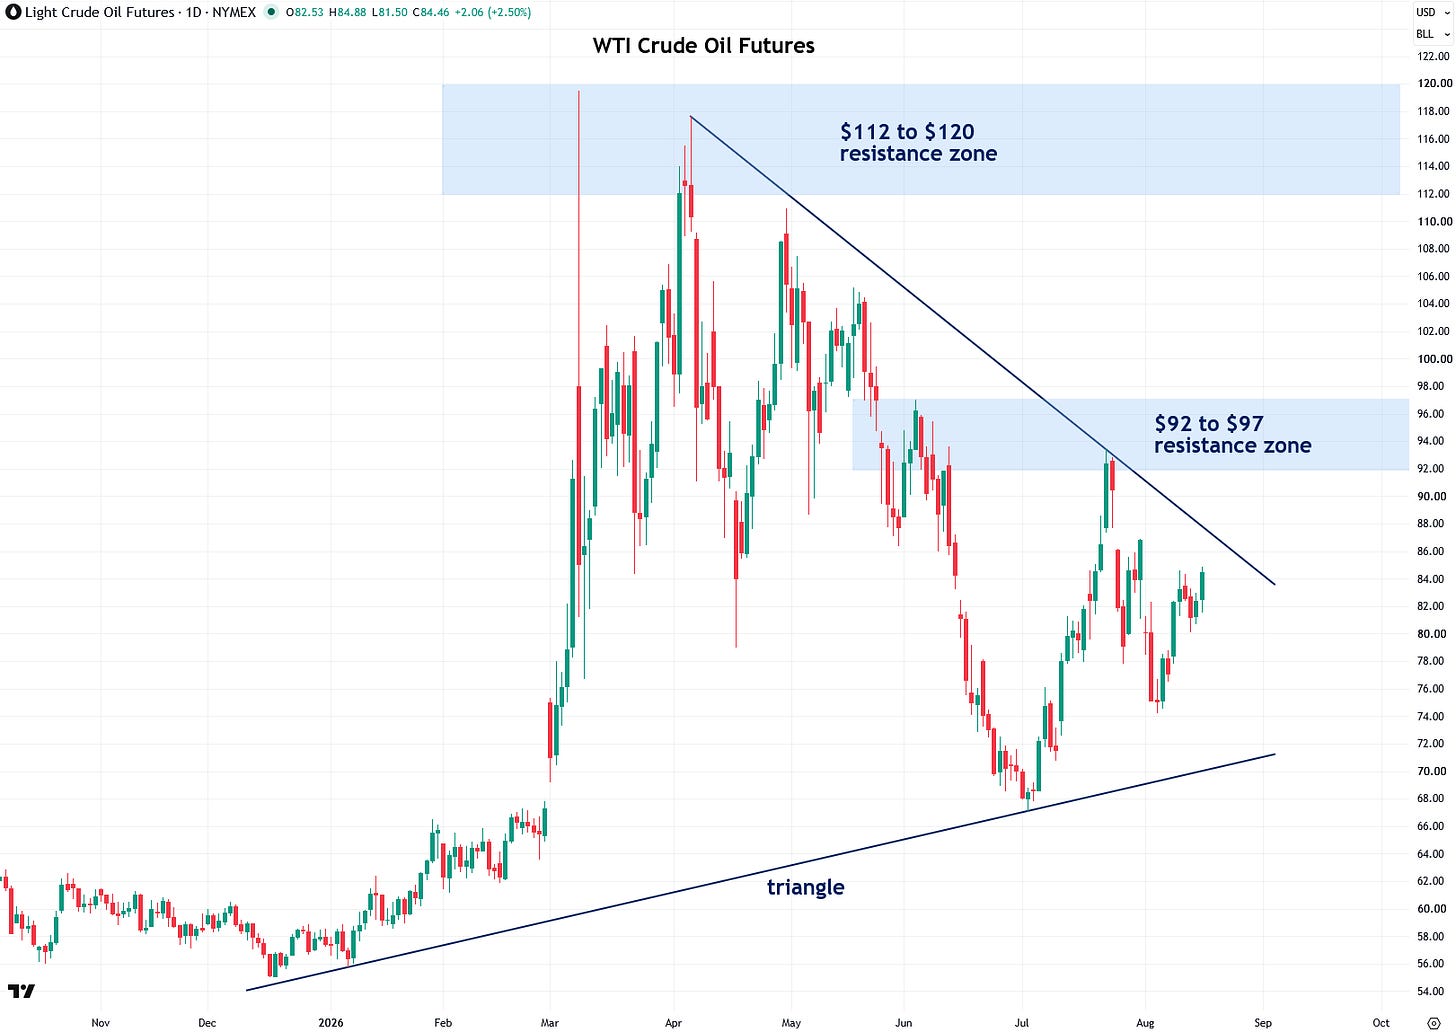
After the initial U.S.-Iran war-related surge in March that sent crude oil to nearly $120 per barrel, prices have since plunged from those highs due to optimism about, and promises from the U.S. government of, an imminent peace deal, heavy releases of oil from the U.S. Strategic Petroleum Reserve and other countries’ equivalent reserves, likely government efforts to suppress prices (as I’ll discuss in a bit), and demand destruction.
From a technical perspective, WTI crude oil has been forming a tightening triangle pattern over the past six months. These patterns often precede sharp moves once a breakout occurs and can be thought of as a compressed spring that ultimately releases with tremendous energy.
The scenario I am watching for is a decisive upside breakout from WTI crude oil’s triangle, potentially in conjunction with a serious negative turn in the Iran war, such as the United States and/or Israel dramatically escalating kinetic attacks against Iran or even launching a ground invasion, heaven forbid. Alternatively, the catalyst could simply be global oil inventories reaching dangerously low levels and crude oil subsequently repricing much higher.
Assuming a breakout from the triangle occurs, I would look for additional confirmation in the form of a breakout above the $92 to $97 resistance zone, followed ultimately by the $112 to $120 resistance zone formed by the major peaks in March and April. Breakouts above horizontal resistance zones are generally much more reliable than breakouts above diagonal resistance lines, such as the upper boundary of the triangle.
There are several different ways to play this potential scenario, assuming it occurs. The most straightforward would be through either full-size 1,000-barrel NYMEX crude oil futures or the smaller 100-barrel NYMEX crude oil futures. For those who do not trade futures or are not comfortable doing so, there is also the United States Oil Fund (USO), an oil-tracking ETF that can be purchased through any standard brokerage account, as well as the United States Gasoline Fund (UGA), though UGA is much more thinly traded and volatile than USO.
Again, I must emphasize that trading oil in any form right now is extremely speculative and high-risk, with prices highly sensitive to both bullish and bearish headlines, including developments that can occur overnight or over the weekend when you may be unable to trade or cut your losses. This is not for beginners, mom-and-pop investors, or anyone uncomfortable with substantial risk and volatility. I am certainly not advocating that anyone trade this setup, but simply sharing ideas for those who are more experienced with trading and understand the risks involved.
The way I would approach this oil triangle breakout setup is by scaling into my intended position in stages: first upon a high-volume breakout (learn more) above the triangle pattern, then adding to the position upon a breakout above the $92 to $97 resistance zone, and finally scaling in further upon a breakout above the $112 to $120 resistance zone. I would also use a stop-loss order placed a few percent below my initial entry price.
You can track WTI crude oil prices on Finviz.com.
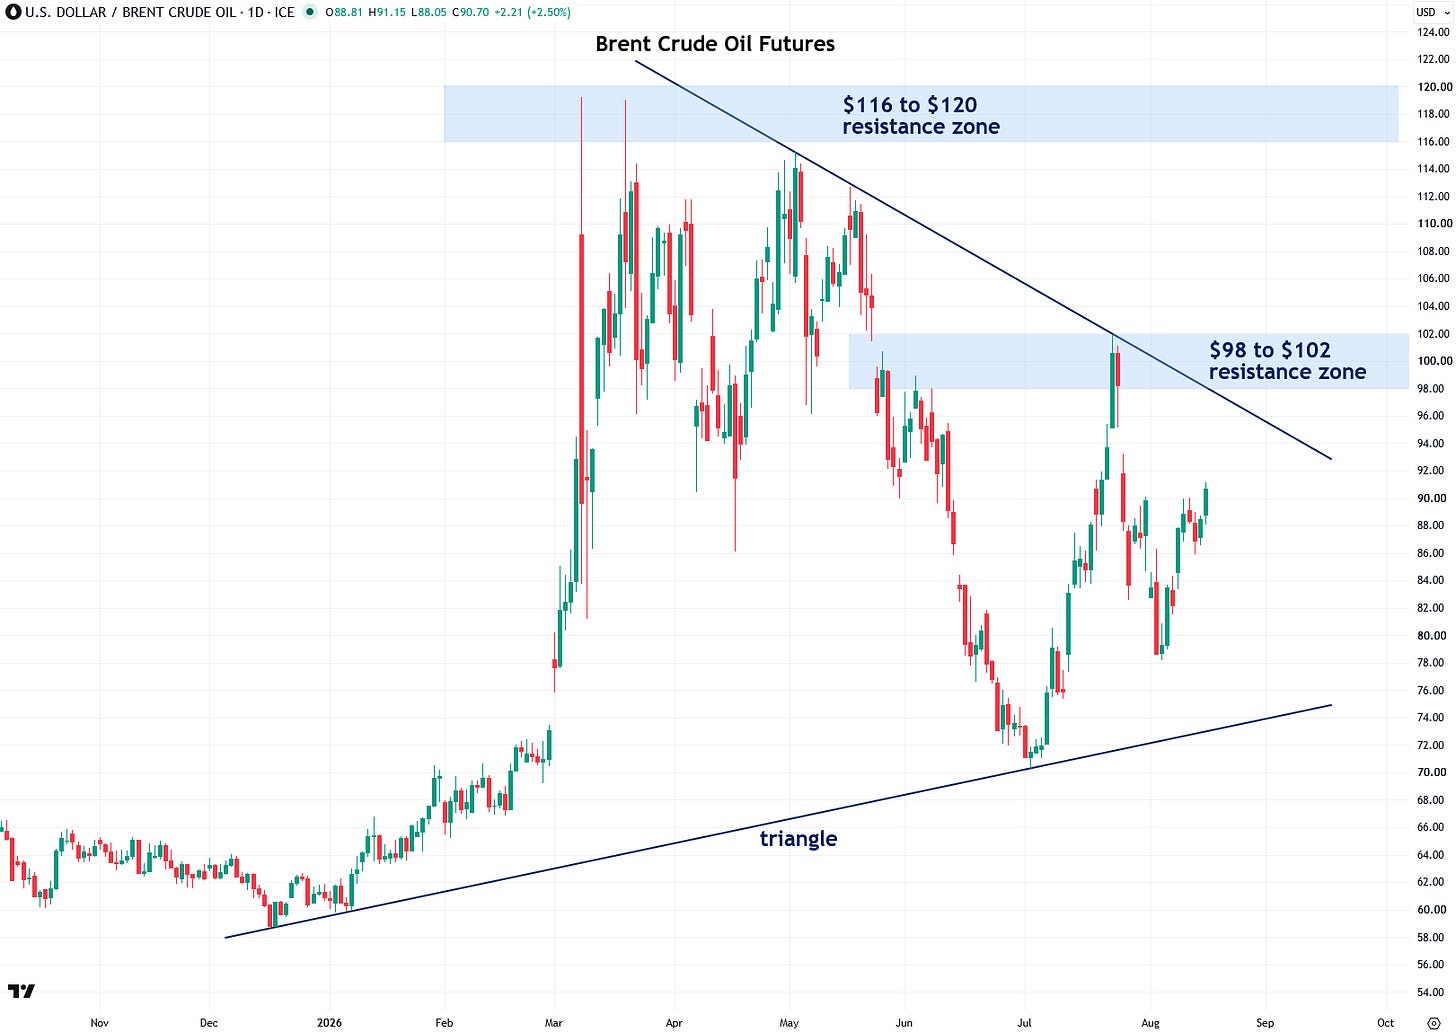
Next, let’s look at the setup in Brent crude oil, which is the global oil benchmark. Like WTI crude oil, Brent has also been forming a tightening triangle pattern over the past six months as it compresses ahead of a potentially powerful breakout.
My playbook for Brent crude oil is similar to that for WTI: I’m looking for an initial breakout from the triangle pattern, followed by breakouts above the $98 to $102 resistance zone and then the $116 to $120 resistance zone formed by the major peaks from March through May. Each successive breakout would provide an opportunity to scale further into the position.
As far as how to play this potential breakout, Brent-related financial products are less common and generally more thinly traded in the United States, so it is easier to simply use the WTI crude oil futures or USO ETF I mentioned previously. That said, there are also ICE-traded Brent crude oil futures, as well as the United States Brent Oil Fund (BNO) ETF, which can be purchased through any standard brokerage account.
You can track Brent crude oil prices on Finviz.com.
Regarding potential catalysts that could trigger another surge in oil prices, the most obvious is the recent breakdown in peace talks between the United States and Iran, with the 60-day MoU (Memorandum of Understanding) expiring today, Monday, August 17.



Comments
Log in or sign up to join the conversation.