

This week, we will look at an interesting chart of Median Home Prices in the United States and another of Gold/Median Home Prices. Both seem to show that we're now at a critical inflection point in the Gold bull market and their resolution will factor prominently in whether we see another big leg up in the Yellow Metal.
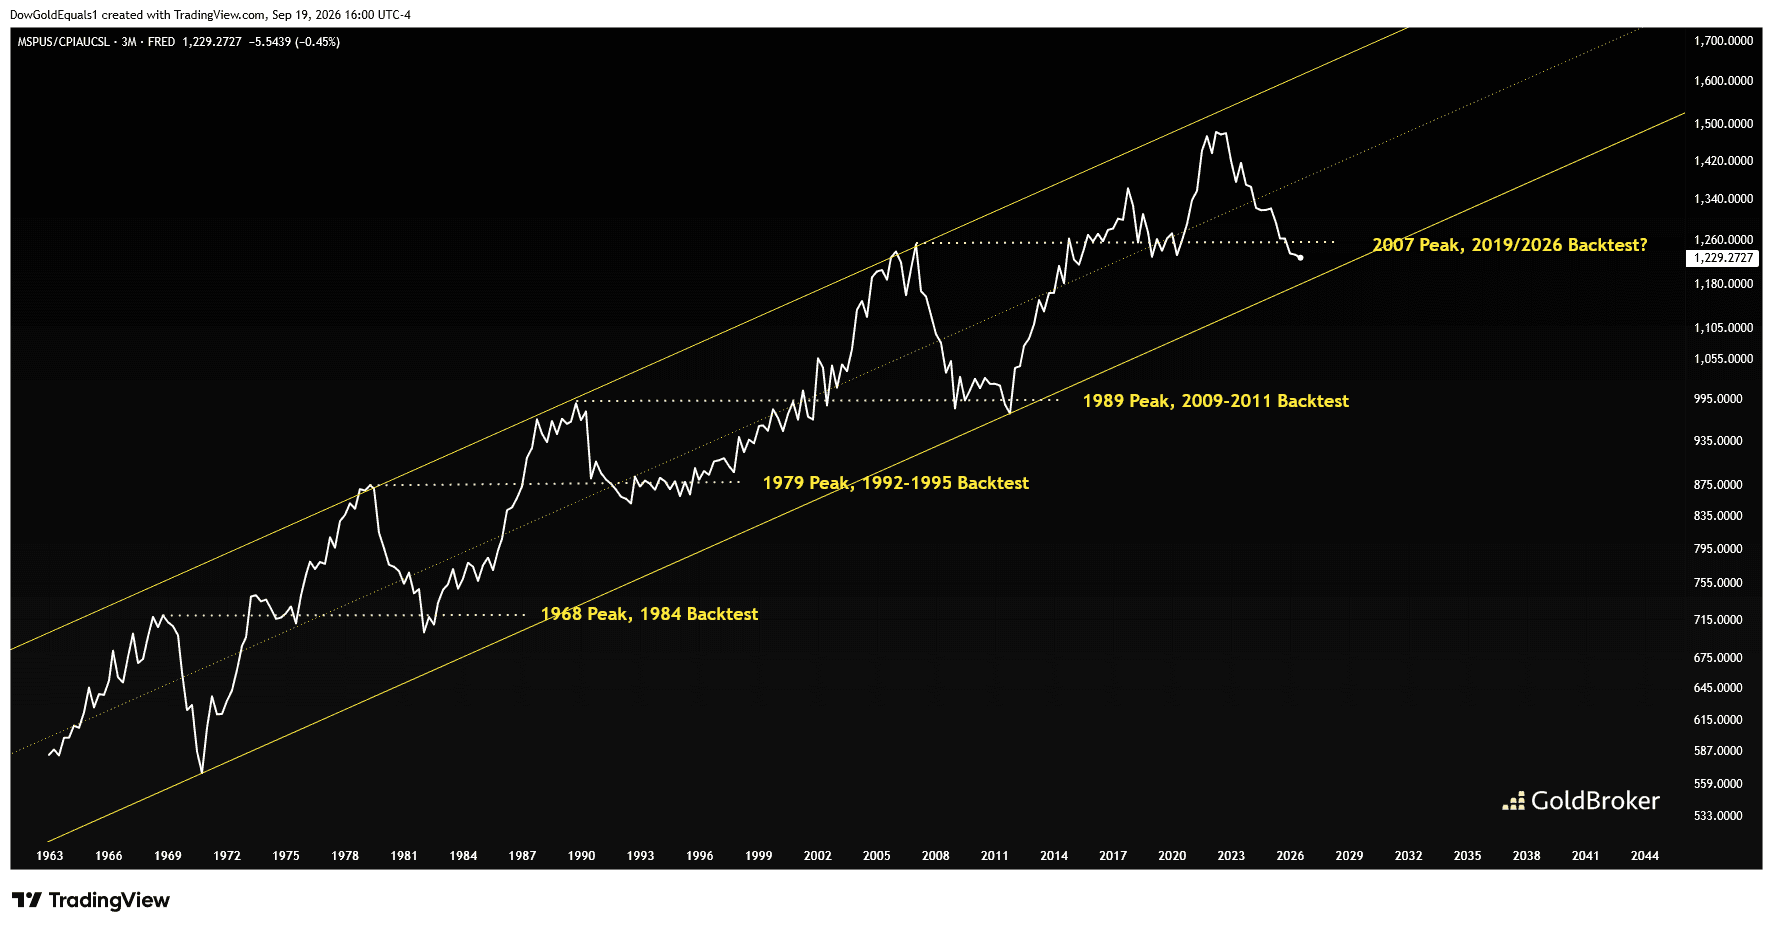
The first chart shows the Median Home Price in the United States adjusted for the US Consumer Price Index. I have always found this chart to be extremely illuminating. The chart goes back to the 1960s and clearly demonstrates that past major highs in the chart later became backtest lows and represented fantastic times for buyers to later experience strong home appreciation in real terms.
Price currently is below its 2007 peak, similar to the undercut lows seen in the past three backtests. If the pattern holds, 2027 might be the year for buyers to purchase a home in the US to hold for the next 10-20 years.
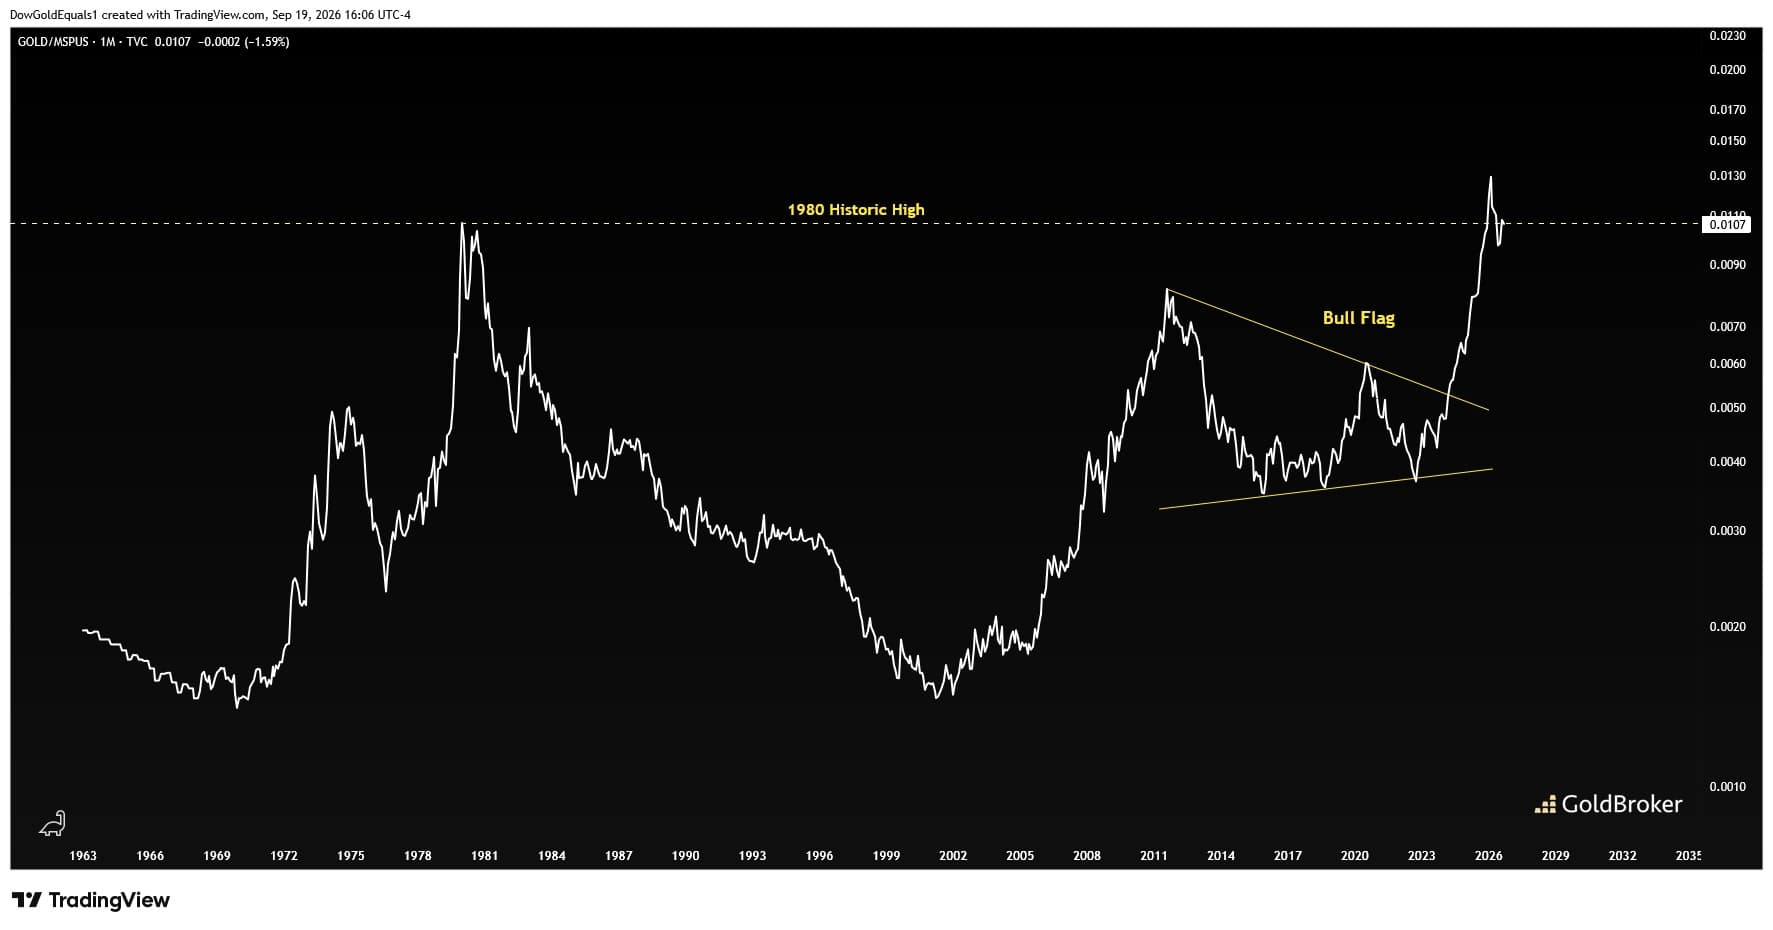
The next chart is that of Gold/Median Home Price. If Gold remains in a bonafide bull market, we would like to see it outperform US Median Home Prices. Again, we see a chart at a critical inflection point.
Price recently spiked above the 1980 historic high before reflexively bouncing back below it. Price has since crept back to the 1980 high and is currently sitting right at resistance. The next move is extremely important.
If price can break through the 1980 high, gold should indeed experience a new powerful leg higher. Failure would mean Gold would lag US home prices going forward. My base expectation is the former, but like most gold-related charts these days, requires close watching.



Comments
Log in or sign up to join the conversation.