


Key Market Outlook(s) and Pick(s)
On Monday, I joined the great David Asman on Fox Business’ Varney & Co. to discuss markets, the economy, outlook, banks, rotation, IPOs, Crown Castle (CCI) ($CCI), SpaceX ($SPCX), and more. Thanks to Stuart Varney, Maggie Edwards, Nick Palazzo, and David for having me on:
On Tuesday, I joined David Lin on his show “The David Lin Report” to discuss markets, the economy, positioning, rotation, AI, tech, defensives, bonds, China, housing, small caps, QXO (QXO) ($QXO), Alibaba (BABA) ($BABA), Comstock Resources (CRK) ($CRK), and a lot more. Thanks to David for having me on:
Bank of America (BAC) Fund Manager Survey Update
On Tuesday, we put out a summary of the monthly Bank of America Global Fund Manager Survey. This month, they surveyed 161 institutional managers with ~$453B in AUM:
Here were the 5 key points:
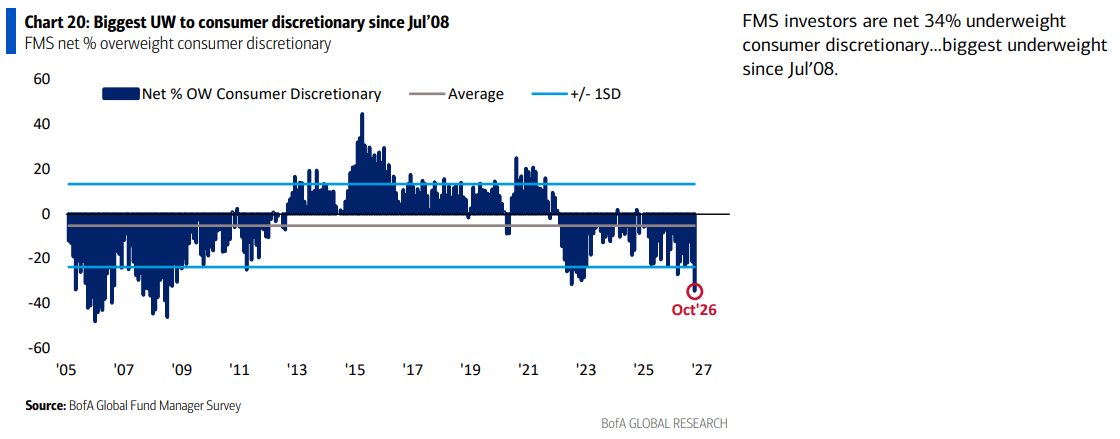
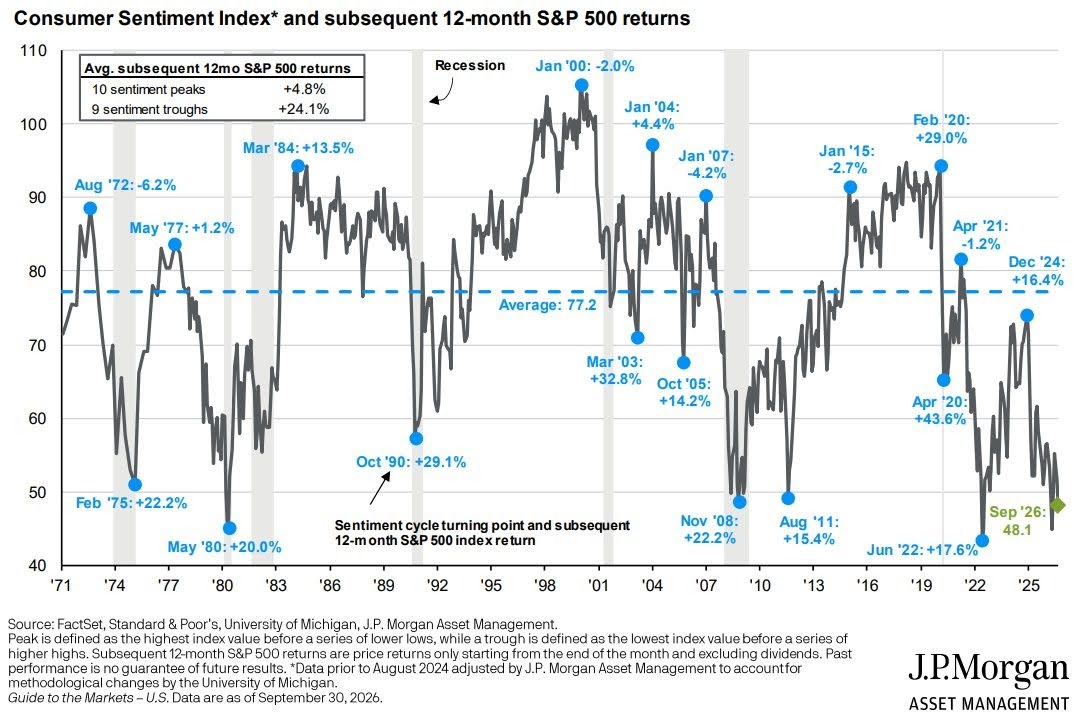
1) Fund managers are now net 34% underweight consumer discretionary, down from a net 21% underweight last month, marking the biggest underweight since July 2008 (1.5 standard deviations below its long-term average). Managers are every bit as downbeat as consumers themselves, with UMich consumer sentiment sliding to 46.3 in October, within striking distance of May’s record low of 44.8. Time and time again, extremes like these have rewarded buyers over sellers, with the S&P 500 averaging +24.1% in the 12 months following the last nine sentiment troughs, versus just +4.8% following peaks.
It also pays to watch what consumers do rather than what they say. Earnings from JPMorgan (JPM), Citi (C), and Wells Fargo (WFC) all pointed to a resilient consumer, with spending holding up far better than feared while delinquencies and net charge-offs remain healthy. This comes on the back of BofA’s September consumer data, which showed card spending per household up 6.2% Y/Y (+5.1% ex-gas), the third-strongest pace in four years, with gains broad-based across 86% of discretionary categories.
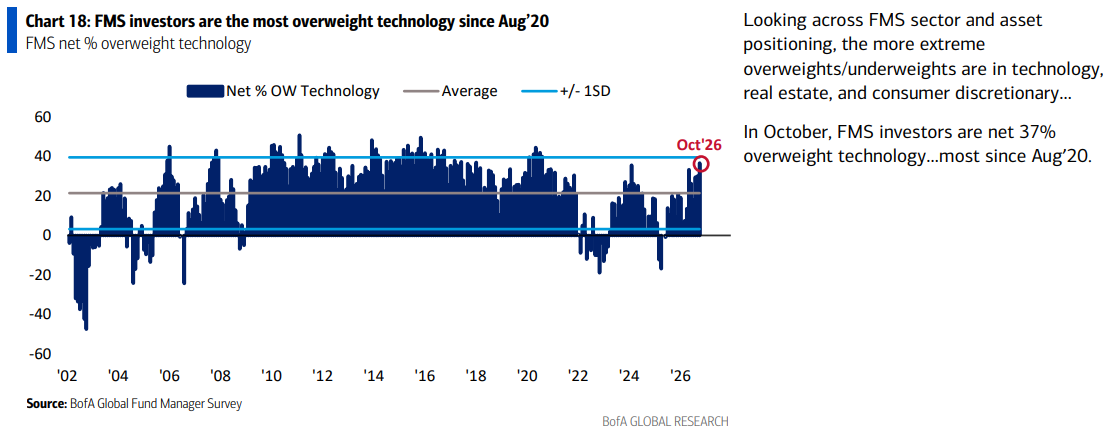
2) Fund managers are now net 37% overweight technology, up from a net 30% overweight last month, marking the biggest overweight since August 2020 (0.8 standard deviations above its long-term average). Managers keep piling in even as more now expect an AI bubble in 2027 than not (45% vs. 42%).
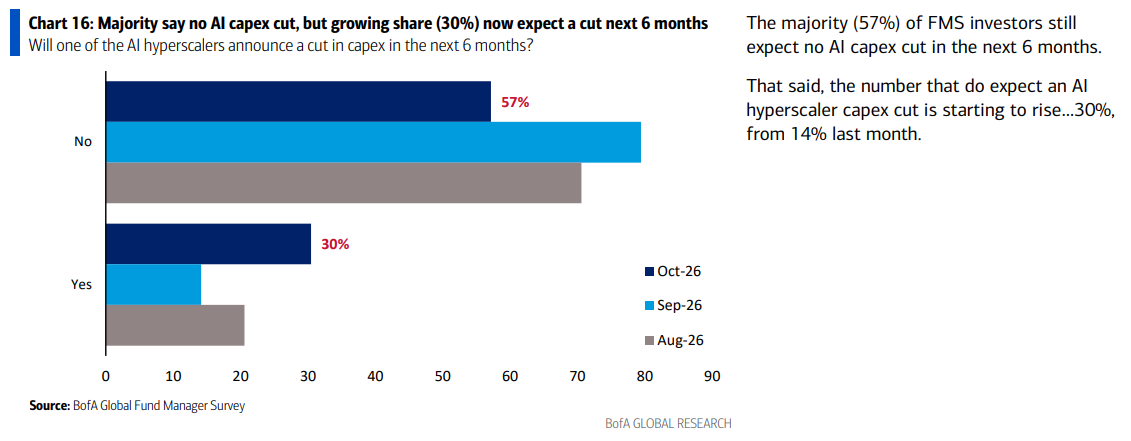
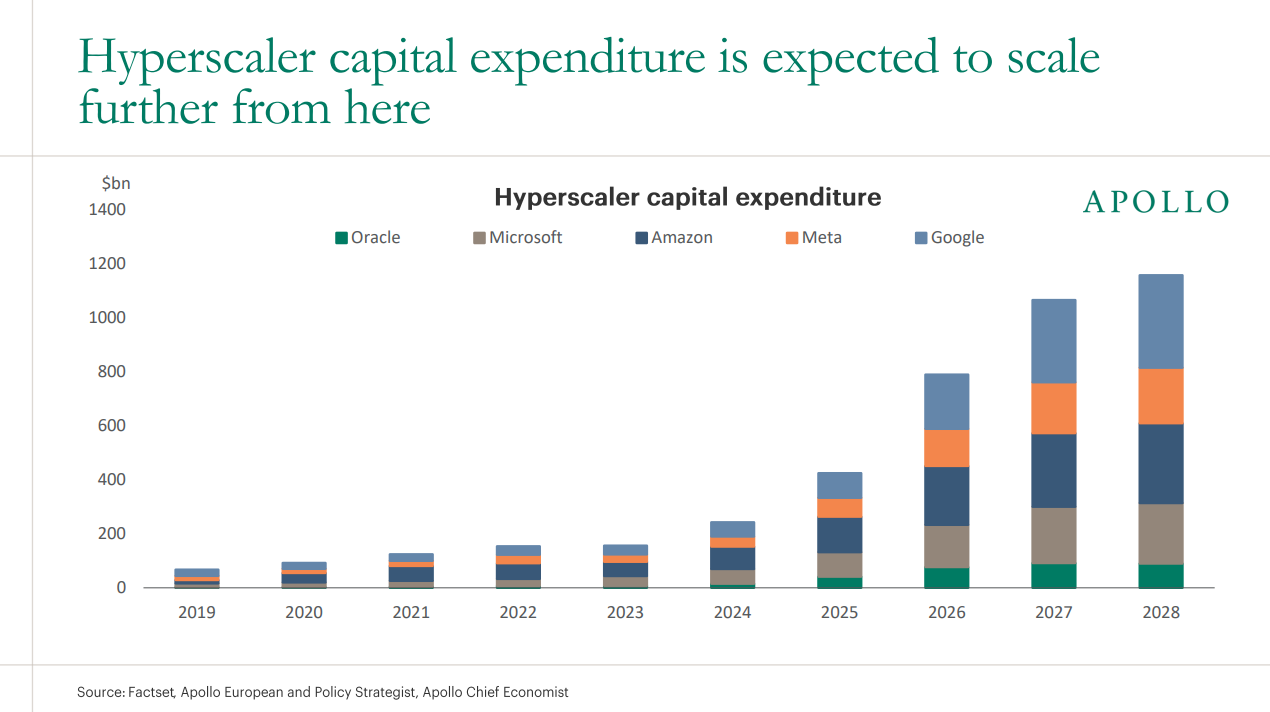
3) While a majority of fund managers (57%) still expect no AI capex cuts over the next six months, the share expecting one of the hyperscalers to announce a cut has more than doubled to 30% from 14% last month. Managers also see hyperscaler capex as the most likely source of a systemic credit event (39%), with spending expected to keep scaling from here (consensus of $792B in 2026 and $1.08T in 2027, >100% of operating cash flow in back-to-back years). Spending at that level becomes difficult to justify as investors look for the R in ROIC. In fact, Goldman found that while 50% of S&P 500 companies touted AI’s eventual margin benefits on their Q2 earnings calls, just 2% have actually quantified the earnings impact. Unless that number starts moving higher, the question will increasingly become who blinks first in the multi-trillion-dollar arms race.
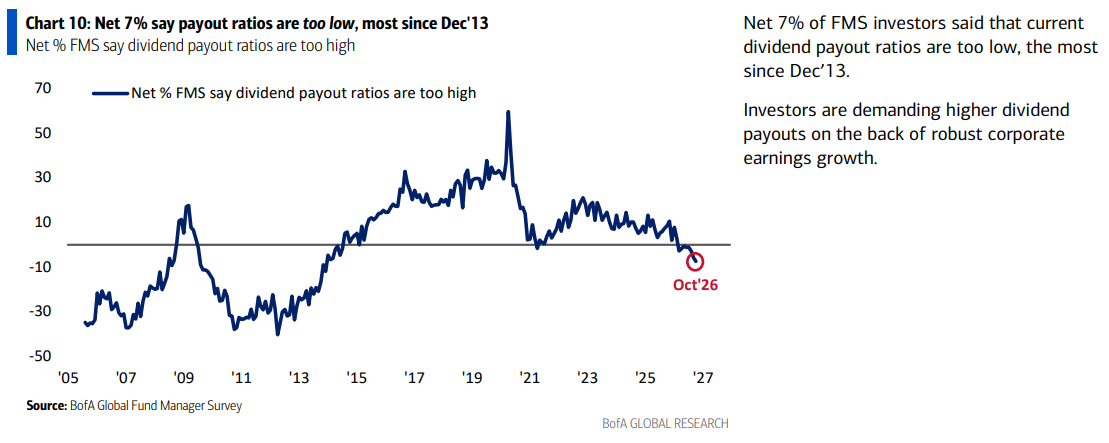
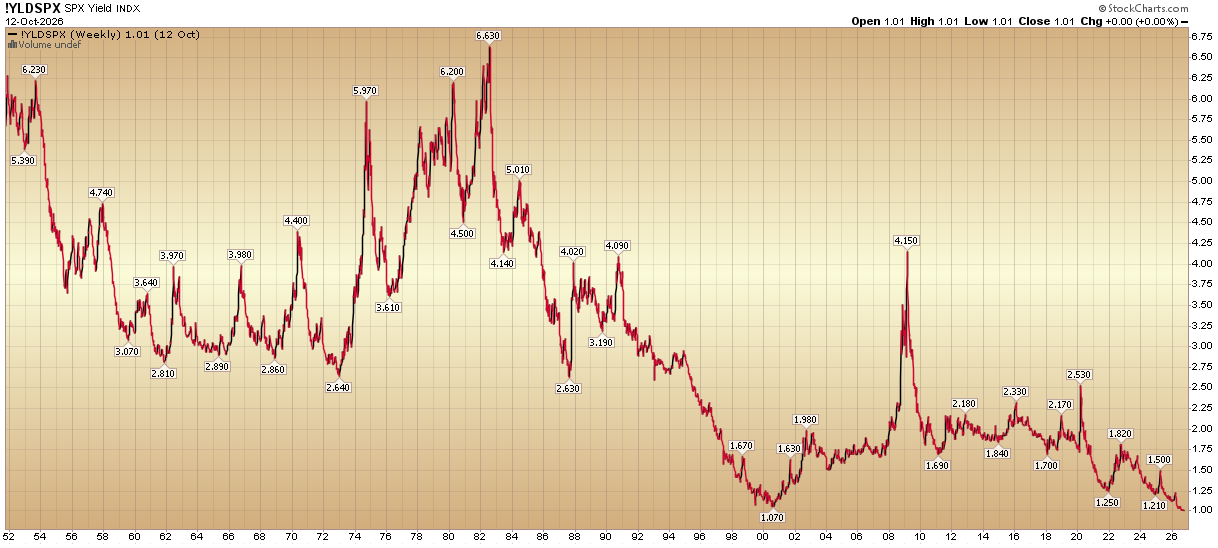
4) A net 7% of fund managers now say dividend payout ratios are too low, the most since December 2013, as investors push for higher payouts on the back of robust corporate earnings growth. It is hard to blame them, with the S&P 500 dividend yield sitting at a record-low 1.01%, below even the 1.07% reached at the peak of the dot-com bubble and a fraction of its 4.2% historical average, all while the 10-year Treasury yields ~5.25%.
We remain constructive on the dividend-paying theme, which we expect to catch a bid as rates come down and money is forced to find yield elsewhere. Names like HRL (6.06%), PFE (6.06%), CCI (5.25%), and SWK (3.79%) offer attractive yields alongside significant equity upside.
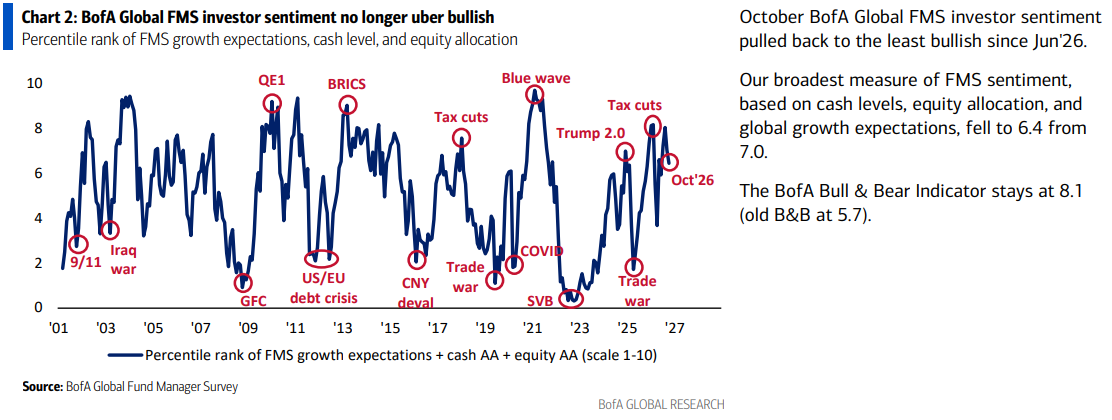
5) BofA’s broadest sentiment gauge, built off cash levels, equity allocation, and global growth expectations, fell to 6.4 in October from 7.0 in September, its least bullish reading since June 2026. Managers turned negative on the global growth outlook, with a net 4% expecting a weaker economy over the next 12 months, while trimming equity allocation to a net 44% overweight from 49%. Cash, however, held steady at 3.9%, keeping the BofA Global FMS Cash Rule in sell-signal territory. Managers may be less enthusiastic, but with cash this low and equity allocation still 0.7 standard deviations above its long-term average, they remain a long way from washed out.
Boeing (BA) Update
For newer readers, here’s a brief overview of the key drivers behind our Boeing thesis, as one half of the global commercial aerospace duopoly where demand has never been the issue and supply, under CEO Kelly Ortberg, is finally starting to catch up:
Company Overview
Founded in 1916. The largest manufacturer of commercial jetliners and military aircraft combined, and the top U.S. exporter by value.
Three segments: Commercial Airplanes (~48% of Q2 2026 revenue), Defense, Space & Security (~30%), and Global Services (~22%).
Q2 2026 revenue: $24.6B (+8% Y/Y). First-half 2026 revenue: $46.8B (+11% Y/Y).
2025 full-year revenue: $89.5B (+34% Y/Y).
Commercial airframe manufacturing is a growing global duopoly. Boeing and Airbus (EADSY) have supplied more than 99% of commercial aircraft deliveries (100+ seats) over the past 25 years.
Attempts to break the duopoly have failed. Bombardier (BDRBF) was eventually sold to Airbus. Chinese entrant Comac is inferior in nearly every metric — the 737 MAX 7 can travel ~75% more nautical miles than Comac’s comparable C919, which delivered just 15 planes in 2025 (80% below its initial target).
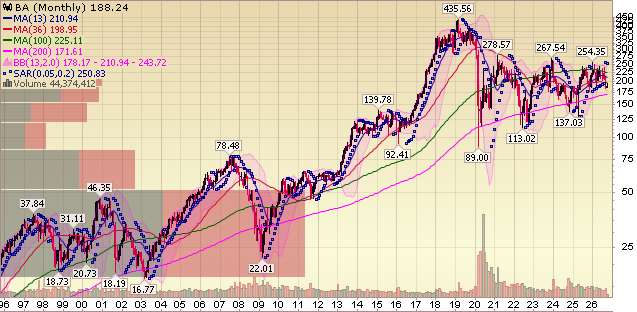
2025 was the year Boeing turned the corner — production, quality, and culture all moving decisively in the right direction. 2026 has extended the momentum, with every metric that matters squarely pointed higher. Stock is still ~57% below all-time highs of just under $440 in early 2019.
Management — CEO Kelly Ortberg
Appointed CEO in July 2024. Unlike his predecessor (an accountant), Ortberg is a hands-on engineer with decades of aerospace experience — this matters when you want to keep doors on planes.
Immediately relocated to Seattle to be closer to the factory floors where Boeing’s commercial aircraft are actually built.
Long career at Rockwell Collins (joined 1987, CEO 2013-2019). As CEO, he doubled sales in six years and quadrupled shareholder value before selling the company to United Technologies (RTX) (now RTX) in 2018.
An under-promise, over-deliver operator — exactly the medicine Boeing needed.
Production Ramp
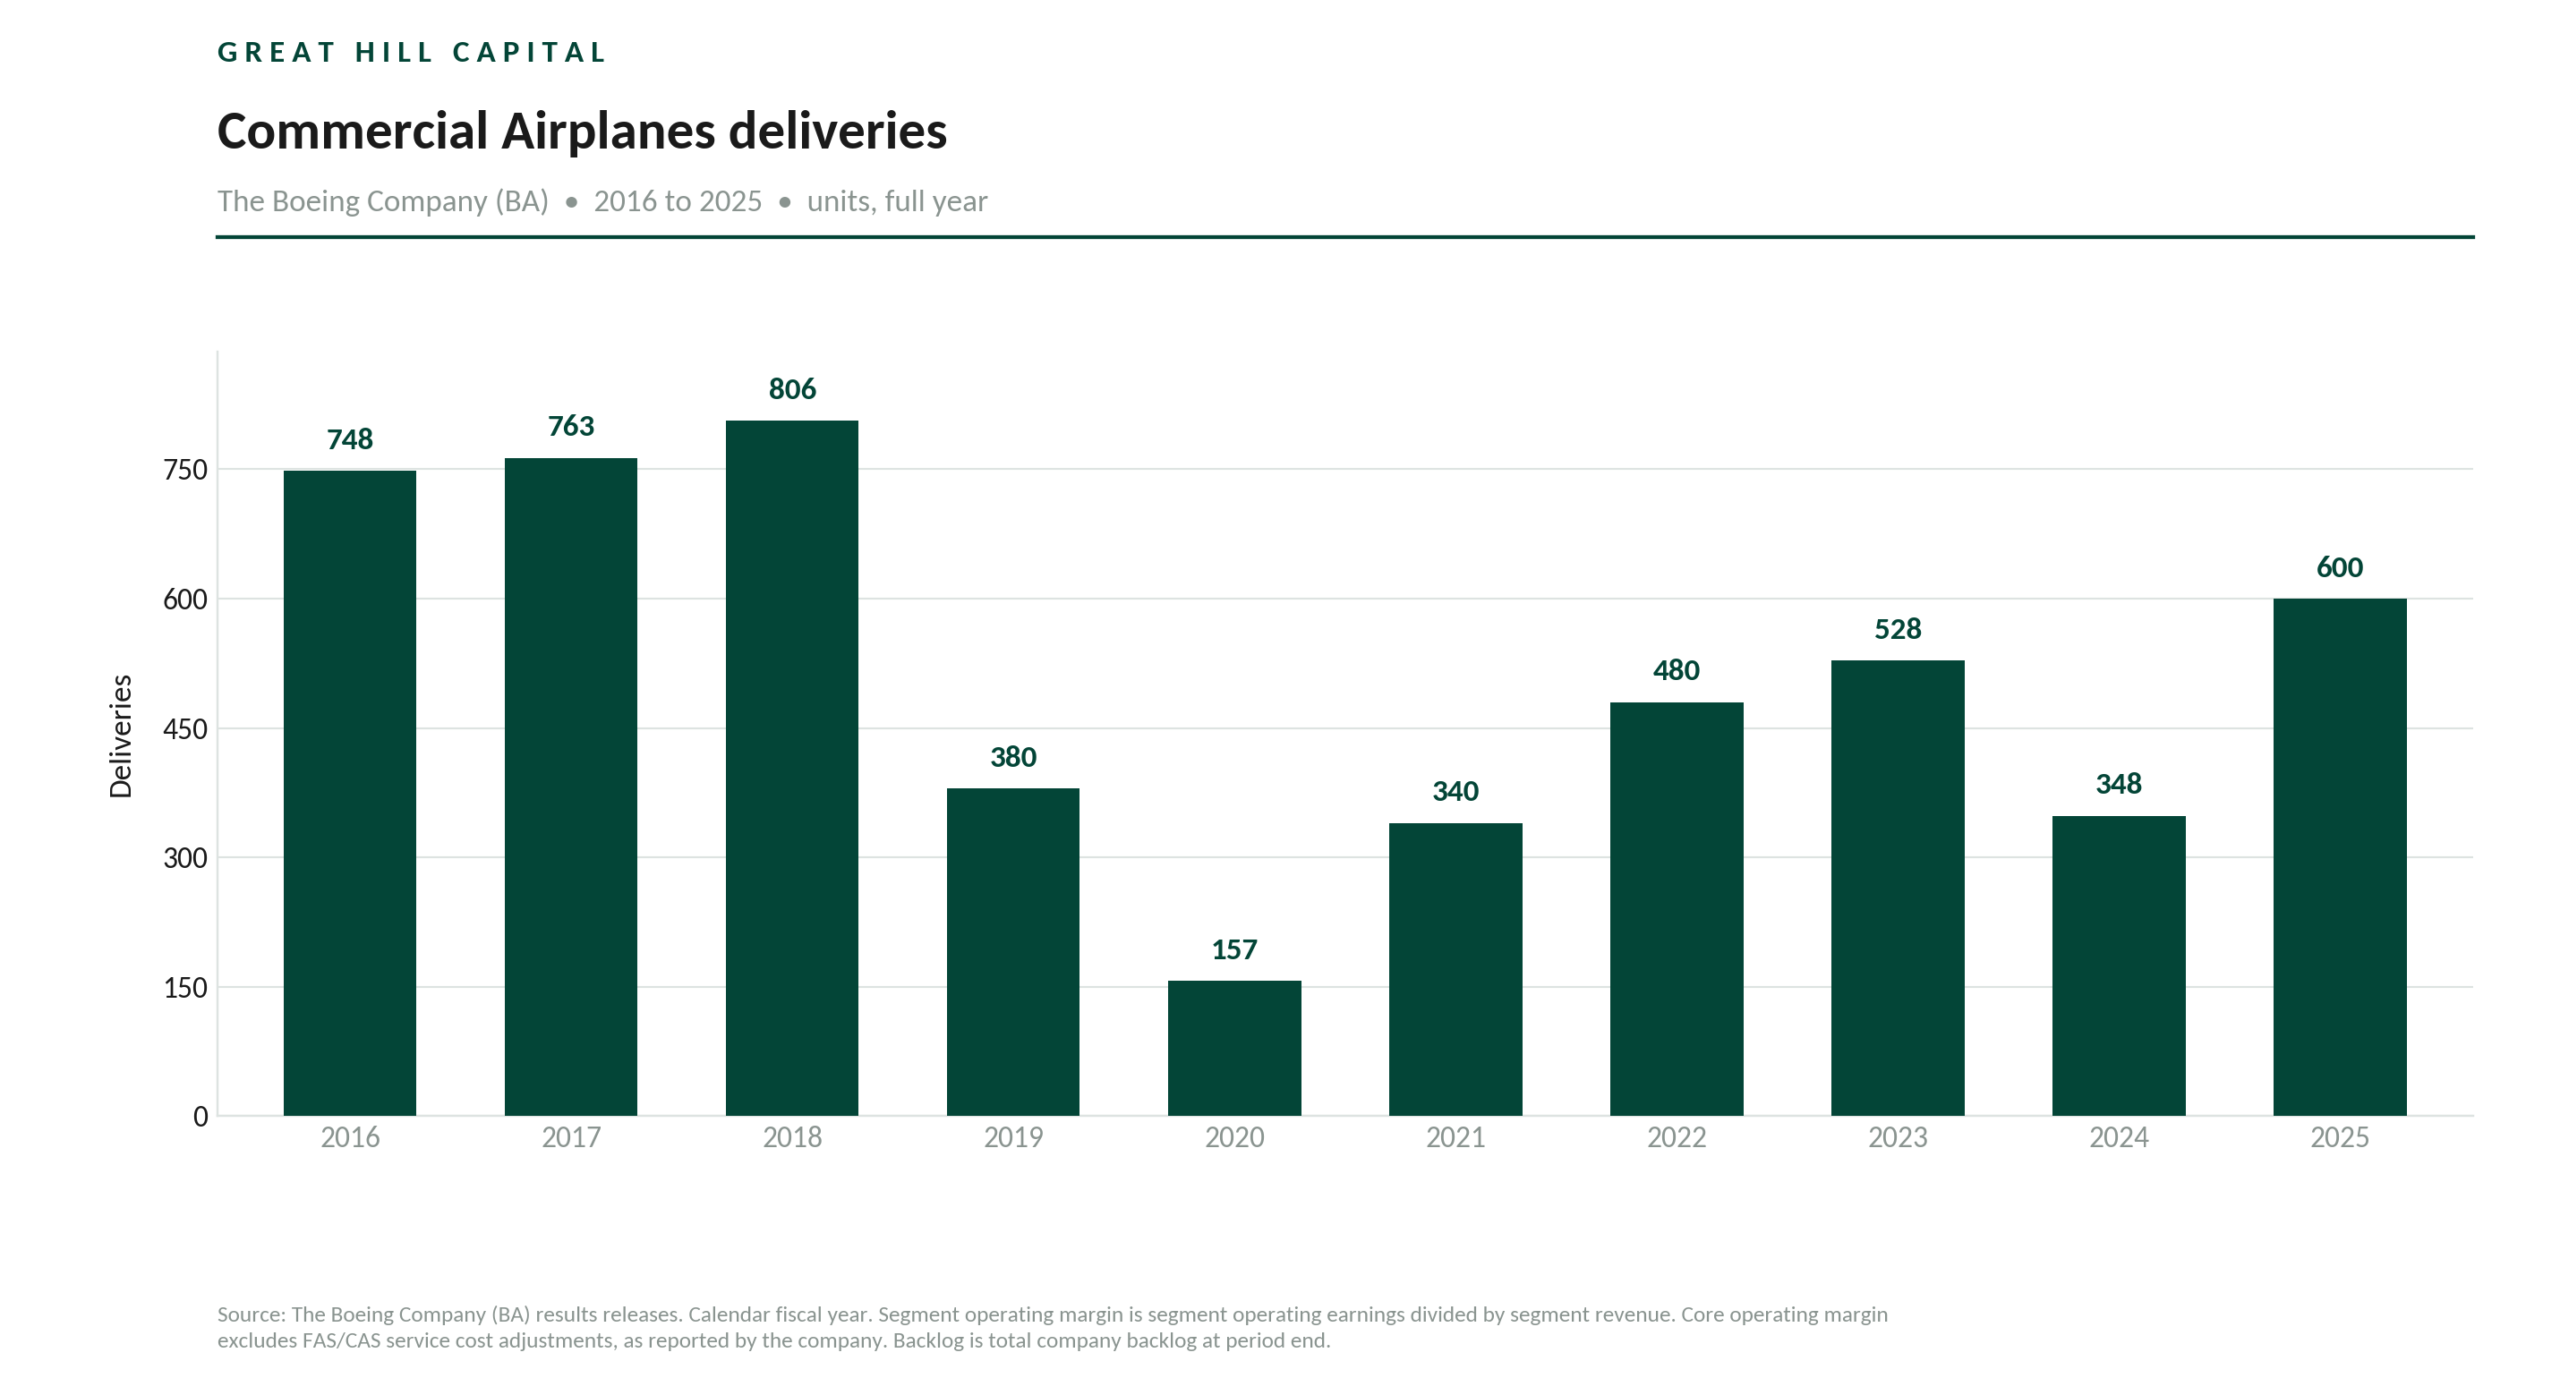
Delivered 600 aircraft in 2025 (+72% Y/Y), the highest annual delivery total since 2018 — including 447 737 MAX (vs. 260 in 2024) and 88 787 Dreamliners.
Delivered 171 aircraft in Q2 2026 (+14% Y/Y), the highest quarterly delivery total since 2018.
737 program producing at 47 aircraft per month following a successful Capstone review in May, though not yet stable at that rate — stabilization has taken longer than management anticipated. Long-term target: 63 737 MAX per month. Delivered 129 737s in Q2 (+24% Y/Y).
Wing production in Renton (where all MAX wings are built) is the active constraint, with flow improvements coming slower than expected. No supply chain constraints identified through rate 52; steps from 52 to 57 and beyond expected to be harder.
Move to 52 expected next year, once the 737 stabilizes at 47 in Renton and the new North Line in Everett is certified and producing.
787 Dreamliner stabilized at 8 aircraft per month, with the next increase to 10/month held back by GE engine delivery recovery (engines fell behind in H1; recovery plan underway with GE, timing likely toward the end of the year).
Delivered 25 787s in Q2 (up from 24). Seat certification remains a delivery-timing factor, not a production constraint, and management expects it to persist — expect lumpy month-to-month deliveries.
Plans to reach 14/month on the 787 over time. Second Charleston assembly facility under construction, expected to be completed next year.
Management expects ~500 737 deliveries (+12% vs. 447 in 2025) and 90-100 787 deliveries in 2026.
Quality dramatically improved: 40% fewer hours spent fixing supply chain problems vs. 2024. Defects from Spirit AeroSystems (SPR) (737 fuselages) fell 60% since enhanced quality inspections were implemented.
Final assembly rework hours down nearly 20% Y/Y on the 737 program and more than 25% Y/Y on the 787 program during Q1.
Acquired Spirit AeroSystems in December 2025, giving Boeing direct control over its most critical supply chain node; Wichita integration progressing as expected.
SPEEA, Boeing’s largest white-collar union (~17,000 engineers, scientists, designers and technicians), approved a new four-year contract on October 1, 2026 (10% immediate wage increase) after rejecting the initial offer — removing the threat of a strike that management said would have shut down 777X certification and disrupted 737 production.
Certification Milestones
737 MAX 7 certified by the FAA on August 3, 2026.
737 MAX 10 in the final stretch — all flight testing complete, documentation phase only. On October 2, the FAA determined a software issue affecting some 737 MAX flight computers is not a safety concern and does not need to be fixed before MAX 10 certification, keeping approval on track for year-end. The MAX 10 carries 1,500+ orders and makes up ~30% of the 737 backlog.
777X: ETOPS authorization still pending, gated on the GE mid-seal certification plan. GE required more testing than originally planned but remains confident in the fix.
Some flight testing may spill into next year. 2027 deliveries are still planned, with any delivery reshuffling contained within the program EAC. TIA 4B testing now 55%+ complete.
No change to the initial 777X units despite customer obsolescence concerns — contract discussions contained within the estimate to complete.
FAA reauthorized Boeing to resume issuing airworthiness certificates for all 737 MAX and 787 airplanes in July 2026 — a key trust milestone.
Backlog & Orders
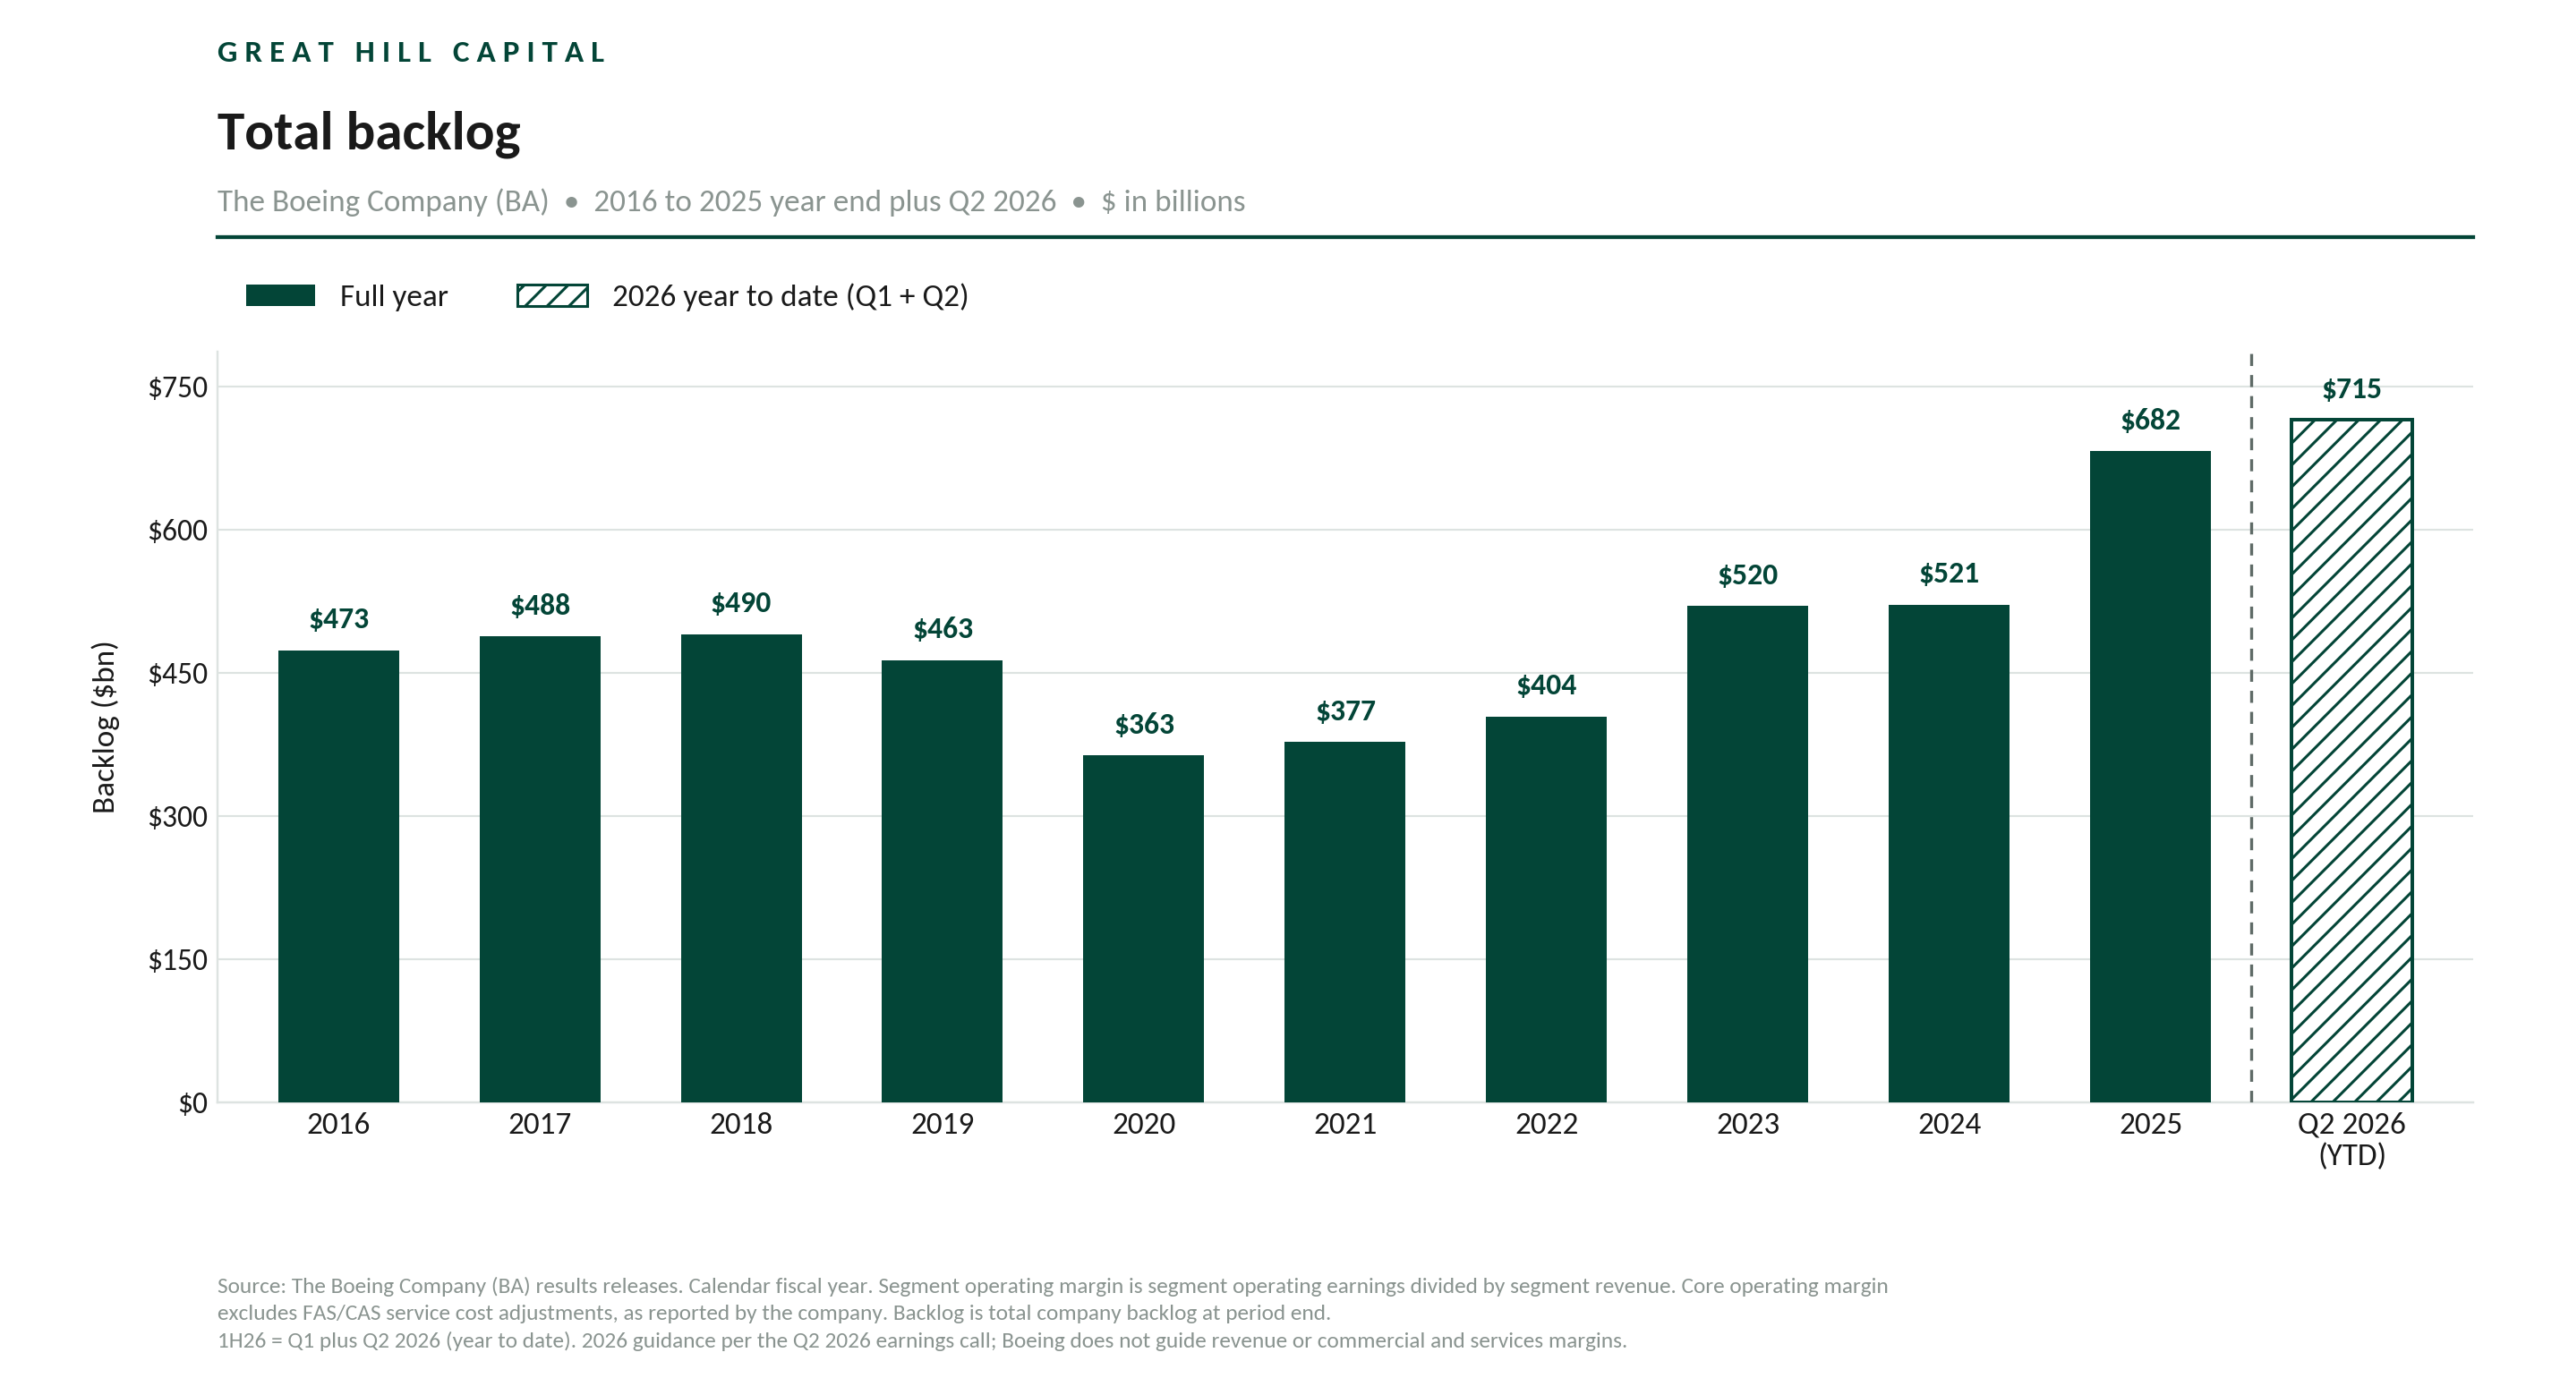
Total backlog reached a record $715B as of Q2 2026 (vs. $695B in Q1 2026, $682B at year-end 2025, and $521B at end of 2024).
Commercial backlog at a record $596.7B with over 6,200 aircraft — more than a decade of production runway. Defense backlog $85B (27% international). Global Services backlog $33B.
Logged 246 net commercial orders in Q2 2026 (incl. Korean Air, Delta (DAL), and SMBC (SMFG)), on top of 140 in Q1 and 1,173 net orders in 2025 (which topped Airbus’s 889 for the first time since 2018).
787 Dreamliner demand exceptional: 395 net orders in 2025, the program’s highest annual order total ever.
Customers using Boeing purchase orders to improve their standing with the White House — the world’s greatest salesman working overtime.
On China, no firm 200-aircraft order has been placed — the Chinese indicated intent to move forward. The value of the visit was reopening the market, with orders coming incrementally and announced by individual airlines on their own timing.
Management sees a global shortage of ~300 widebody jets and ~1,200 single-aisle jets.
Boeing’s 20-year Commercial Market Outlook: ~44,000 new deliveries over the next 20 years. The global fleet is expected to grow ~80% by 2044. Nearly 80% of aircraft currently in service will need to be replaced over the next 20 years.
Aviation traffic has tripled over the past 25 years — a secular growth market with 3.1% projected annual fleet growth.
Free Cash Flow Inflection
After nearly $38B in cumulative cash burn in recent years, Boeing is finally turning cash flow positive.
Q2 2026 free cash flow of positive $631M, an ~$831M Y/Y improvement (from a $200M outflow) and well ahead of the ~$331M outflow consensus, driven by higher deliveries and favorable receipt timing.
First-half 2026 FCF outflow of $823M, a significant improvement from $2.49B last year.
2025 free cash flow: outflow of $1.9B — a dramatic improvement from the $14.3B outflow in 2024. FCF was positive in Q3 and Q4 for the first time since Q4 2023.
2026 guidance reiterated at $1-3B of positive free cash flow (would mark first positive annual FCF since 2023), with management now framing it as steady around the $2B midpoint.
Management points to the lack of change in guidance over eight months as evidence of improving operational stability and forecasting predictability.
2027 still in planning and characterized as a transitionary year — pricing penalties and excess advances still burden cash flow before the breakthrough.
Consensus FCF estimates: $2.15B in 2026, $5.61B in 2027, and $9.81B in 2028.
Working capital is the bridge to the $10B+ FCF path: management sized the inventory opportunity at multiple billions of dollars, realized over multiple years.
Normalized run rate framework intact: 50+/month on 737 and 10+/month on 787, now with 777X also generating positive cash flow.
UBS 2030 FCF estimate: $20B (~$25/share). At an 18x FCF multiple (vs. Airbus at 22x), that implies a ~$450 stock price.
Deliver more planes = generate more cash.
Defense, Space & Security
Q2 2026 revenue of $7.5B (+13% Y/Y). GAAP operating margin of (0.2)% reflects a $280M charge on the VC-25B (Air Force One) program tied to added production and certification resources; excluding the charge, margin was 3.54%.
First VC-25B delivery is still expected in 2028.
Full-year 2026 margin expected ~2.5% incl. the charge.
Backing out the VC-25B charge, year-to-date underlying results track with the rest of the portfolio.
Selected by the Navy over rival Northrop Grumman (NOC) to develop the F/A-XX, its sixth-generation carrier-based stealth fighter, with the development phase valued at $20B+. New fighters expected to enter the fleet in the 2030s, eventually replacing the F/A-18. Boeing now holds both U.S. sixth-generation fighter programs, following the Air Force’s F-47 award in 2025.
Formalized a ~$14.7B contract with Lockheed Martin (LMT), converting the previously announced seven-year framework into a firm award to triple PAC-3 MSE seeker production.
2025 full-year revenue: $27.2B (+14% Y/Y).
Defense backlog $85B in Q2 2026, with 27% of orders from customers outside the U.S.
Produces major military platforms including the F/A-18E/F Super Hornet, F-15 Eagle, and AH-64 Apache helicopter. Also manufactures the 30,000-pound GBU-57 bunker buster bomb, used to strike Iran’s nuclear facilities in June 2025.
Management focused on rolling off legacy fixed-price development contracts — the primary source of prior losses — and replacing them with higher-margin, better-underwritten programs.
Tighter underwriting standards on new development programs.
Segment marching toward high-single-digit operating margins by the end of the decade on a generally linear path, with meaningful upside to the 5-year outlook given rising US and allied defense budgets (including the proposed $1.5T FY2027 US defense budget, the largest Y/Y increase in post-WWII era).
Key Financials & Valuation
Cash and marketable securities: $20.0B at Q2 2026 quarter-end. Consolidated debt reduced to $45.9B (down $1.3B sequentially and $8.2B YTD). $10B of undrawn credit facilities available. Interest and debt expense fell to $600M from $710M Y/Y.
Completed the $10.55B sale of the Digital Aviation Solutions business to Thoma Bravo (closed October 2025), further strengthening the balance sheet.
Announced divestitures of Wisk Aero, Insitu and SkyGrid. Wisk is being combined with Archer (ACHR), since Boeing had already obtained what it wanted from the autonomy technology and civil certification work and faced major capital investment to go to market. Boeing retains an equity stake in Archer, a board seat, and IP access for its core aerospace business.
Boeing last reported a full-year profit in 2018. 2026 marks the beginning of the return to sustained profitability.
Stock still trading ~57% below 2019 all-time highs despite a record backlog, accelerating deliveries, and FCF inflection underway.
Q2 Commentary & Recent Developments
Boeing’s recovery stayed on course in the second quarter. Revenue of $24.6B (+8% Y/Y) topped consensus by ~$290M as all three segments grew. Commercial deliveries climbed 14% Y/Y to 171, the most in any quarter since 2018. Higher deliveries helped drive free cash flow to $631M, compared with the ~$331M outflow the Street had penciled in. Meanwhile, total backlog grew ~$20B sequentially to a record $715B, including more than 6,200 commercial airplanes, providing more than a decade of production at current rates.
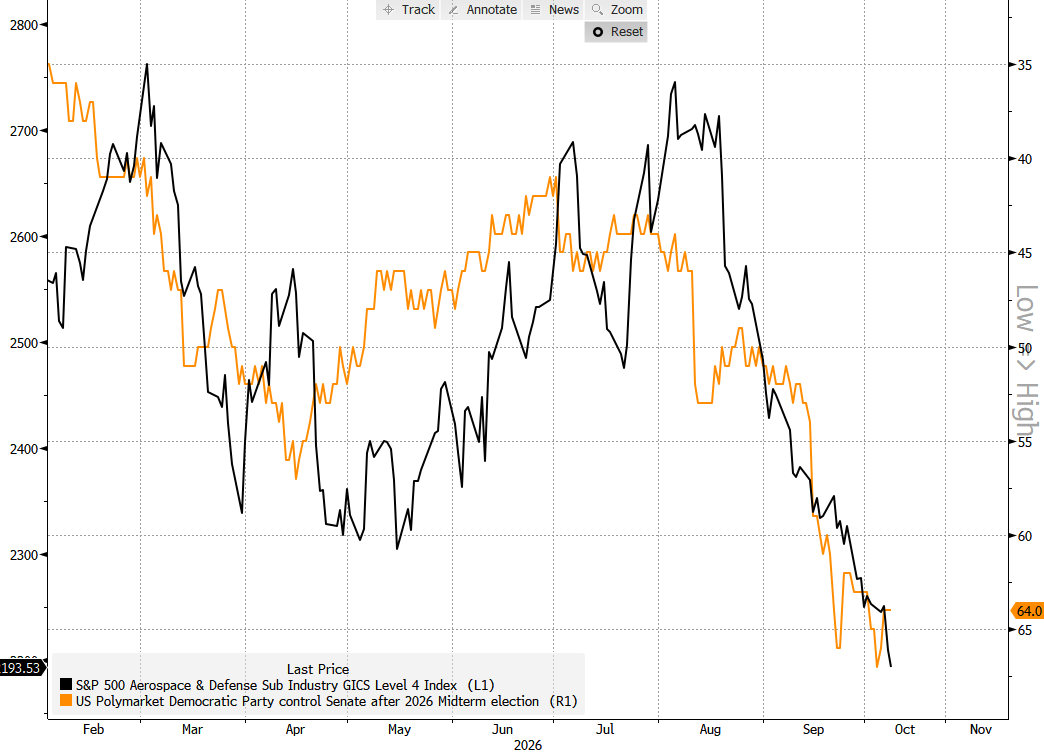
As encouraging as the quarter was, the stock has had other things on its mind since late July. After climbing to ~$240 in the days following the report, shares have been under pressure since amid a broader selloff across aerospace and defense and a string of Boeing-specific headlines. The group is down ~19% from its summer peak and knocking on the door of bear market territory as investors brace for next month’s midterm elections and the growing odds of a Democratic sweep, casting doubt on future military spending:
Source: ZeroHedge
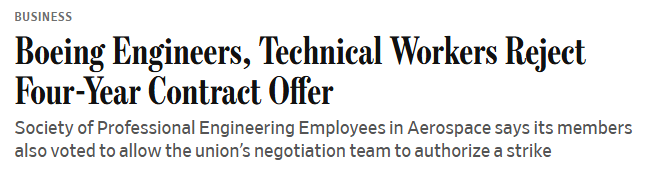
On the company-specific side, the first potential overhang came from labor. On August 21, members of SPEEA, Boeing’s largest white-collar union representing ~17,000 engineers, scientists, designers and technicians, rejected the company’s initial contract offer and authorized their negotiating team to call a strike. The vote brought back memories of the 2024 machinists’ strike, when 33,000 workers walked off the job for 53 days and brought production to a standstill. Ortberg warned that a SPEEA strike would essentially halt 777X certification until the engineers returned, with ripple effects on production, while acknowledging that Boeing likely could not sustain current 737 rates through a stoppage.
Management added to the uncertainty in mid-September, flagging headwinds on several fronts at a Morgan Stanley (MS) conference. Ortberg acknowledged that the 737 line, now producing at 47 per month, has taken longer than anticipated to stabilize at that rate, while the 787’s ramp to 10 per month is slipping toward year-end as GE works to recover engine deliveries.
While management maintained its 2026 FCF outlook of $1-3B, it pointed to the ~$2B midpoint as the more likely outcome, noting that upside from stronger back-half deliveries now looks less likely. None of these updates changes the long-term thesis, as the issues at hand are ultimately a matter of timing. Still, with production and cash flow at the heart of the Boeing story, even a modest tempering of near-term expectations can disappoint a short-sighted market focused on the next few quarters
Later in the month, certification noise added to the pressure. A software problem affecting some 737 MAX flight computers prompted the FAA to pause MAX 10 certification while it reviewed the issue. The MAX 10 is the last major variant in the family still awaiting approval, already years behind schedule with more than 1,500 orders on the books. Any hint of another lengthy delay was bound to hit a nerve, especially coming less than two months after the smaller MAX 7 finally earned certification on August 3 following a wait of more than eight years.
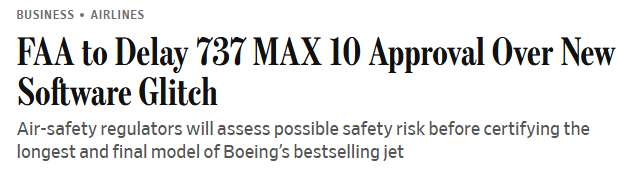
The good news is that, in a matter of ~48 hours, Boeing caught a break on both fronts, putting the labor and certification overhangs in the rearview mirror.
On October 1, SPEEA members approved a new four-year contract featuring a 10% immediate wage increase and a 34% increase over the life of the deal, eliminating the threat of a strike that could have begun as early as October 7. A raise of that size is not cheap, but it looks like money well spent if it keeps engineers on the job and the 777X, a program consuming billions of dollars a year, on track for its first delivery in 2027.
The following day, the FAA determined that the software issue did not pose a safety concern and would not require an update as a prerequisite for MAX 10 certification. That put Boeing’s largest MAX variant back on track for approval by year-end while allowing MAX 7 deliveries to continue.

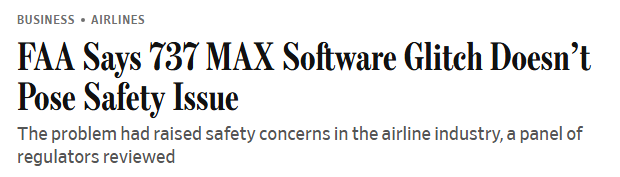
The cherry on top came from the Navy, which selected Boeing over Northrop Grumman to develop F/A-XX, its sixth-generation fighter that will eventually replace the F/A-18 fleet in the 2030s. Northrop had been viewed as the overwhelming favorite, with investors skeptical that the Pentagon would award both of the military’s sixth-generation fighter programs to the same company after Boeing won the Air Force’s F-47 in 2025. Instead, Boeing now leads both programs, with development contracts worth more than $20B each and production that could generate hundreds of billions of dollars over the life of the aircraft.
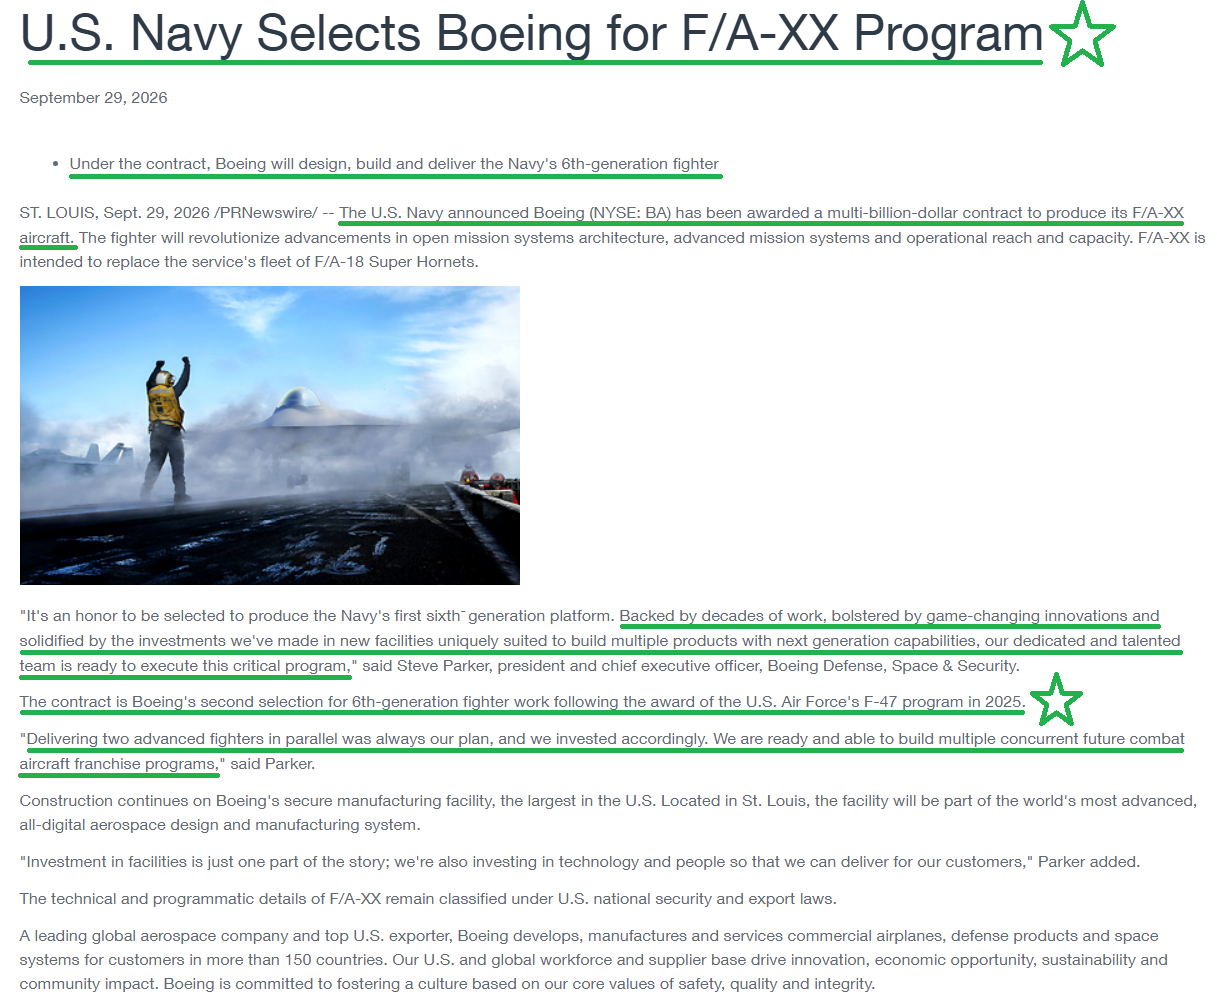
That’s quite a turnaround for a defense business investors had come to view as little more than a write-down machine. Shortly after the Navy decision, Boeing also formalized a $14.7B award, converting its previously announced seven-year framework agreement into a firm contract to triple production of the PAC-3 MSE seekers used in Patriot interceptors.

For a defense business still recovering from years of costly missteps, these contracts provide a much-needed shot in the arm, setting the segment up for years of growth ahead. BDS piled up nearly $11B of operating losses from 2022 through 2025, with five fixed-price development programs (KC-46, T-7, MQ-25, VC-25B and Starliner) costing Boeing $20.5B in overruns. While the F/A-XX terms have not been disclosed, the contract is expected to follow the F-47 as a cost-plus deal with incentives and fees, consistent with Ortberg’s vow to steer clear of new fixed-price development work.
Under Ortberg’s watch, BDS is finally beginning to see light at the end of the tunnel. Despite a $280M charge on the Air Force One program in Q2, management still expects the segment to deliver an operating margin of ~2.5% in 2026, which would mark its first full year of positive segment margins since 2021. From there, management expects margins to climb in a generally linear fashion toward high single digits by the end of the decade.
As exciting as the defense turnaround has become, commercial airplanes remain the ultimate needle mover for Boeing. At their respective peaks over the past decade, commercial generated more than twice the revenue of defense and more than three times the profit. Production remains the one overhang that has yet to fully clear, though the constraints are well understood and gradually improving. Boeing is working to stabilize 737 production at 47 per month before moving to 52, while the 787’s ramp to 10 per month depends on GE recovering engine deliveries.
This is where having a hands-on engineer in the pilot’s seat pays off. Ortberg built his career on under-promising and over-delivering. He has made clear that Boeing will move to the next rate only when the factory is ready. That discipline was sorely missing in the years when chasing production rates took priority over building planes safely. We would much rather see him take a few extra months to get it right than force a rate increase the operation isn’t ready to handle. In the meantime, the numbers continue to move in the right direction, with 737 deliveries up 24% Y/Y to 129 in Q2 and the program on track for ~500 this year, a ~12% increase from the 447 delivered in 2025, while total commercial deliveries remain on track to exceed last year’s 600.
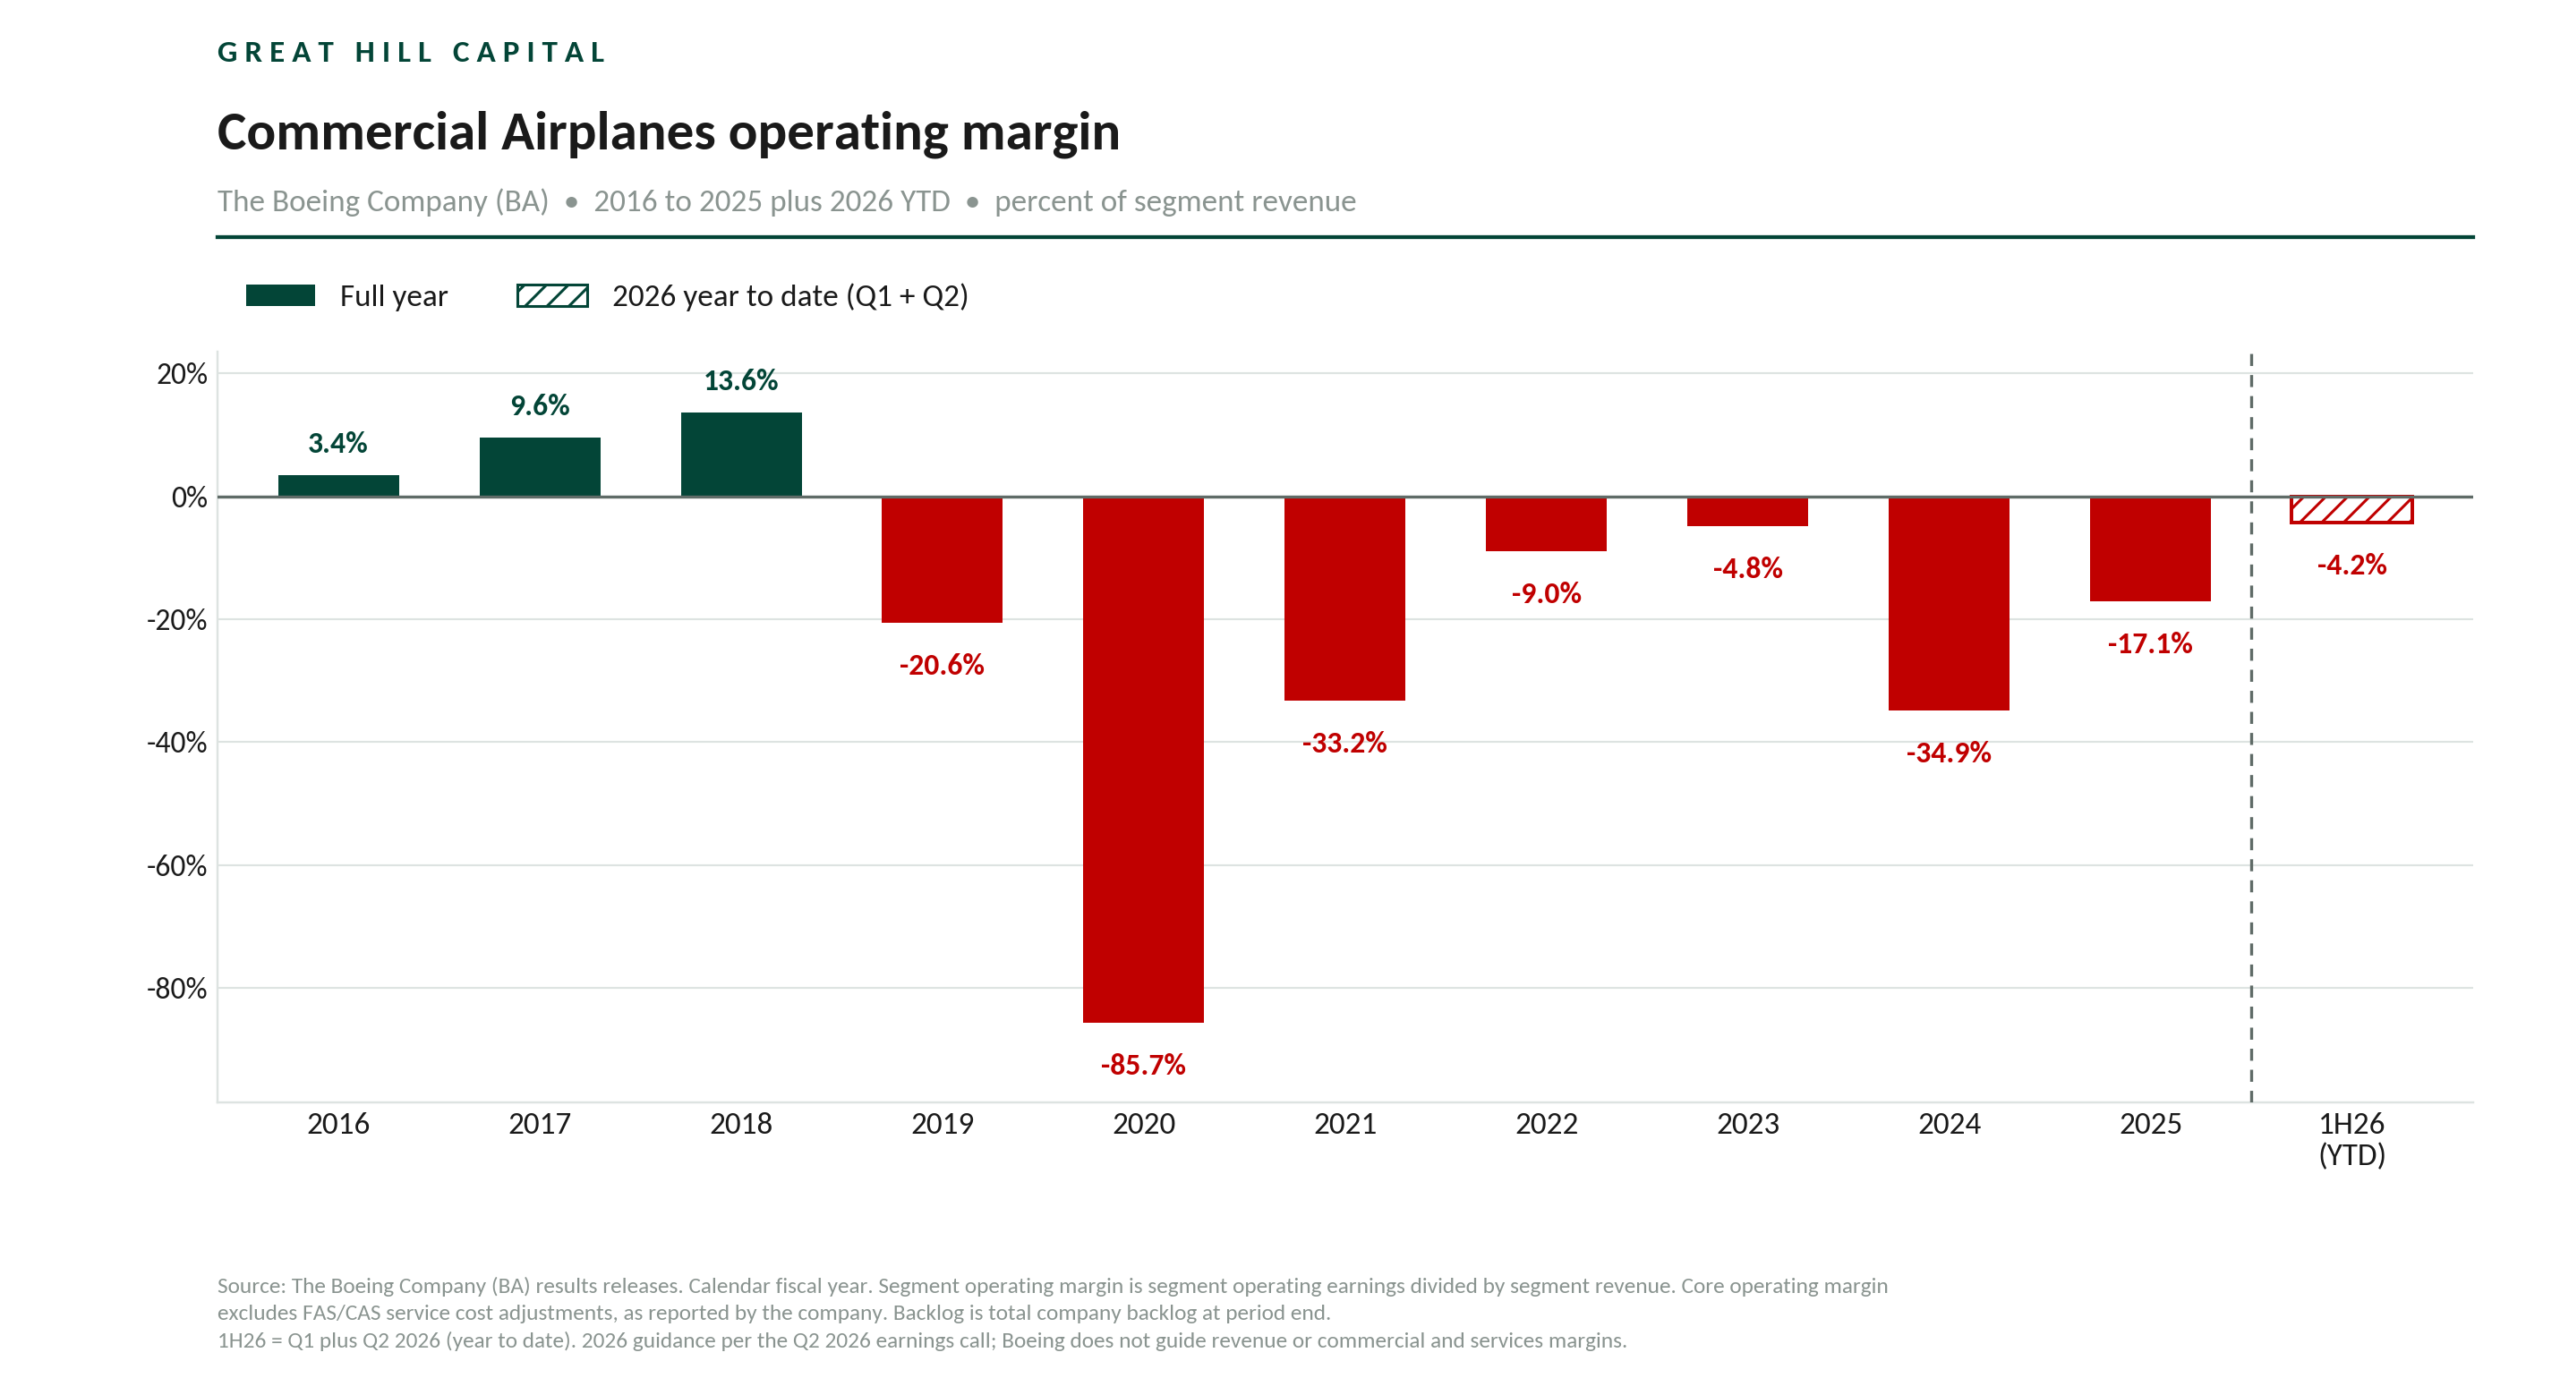
Beyond steady production gains, the next big catalyst is certification of the MAX 10, now in the final stretch with flight testing complete and the latest software obstacle cleared. The variant accounts for ~30% of the 737 backlog, with approval set to finally allow Boeing to convert aircraft already built and sitting in inventory into cash. Segment margins are steadily improving as well, with operating margin narrowing to (2.7%) in Q2 from (5.1%) a year earlier, while the first-half margin stood at (4.2%). Management expects commercial margins to turn positive by mid-2027, closing the chapter on what will be eight straight years of losses. By the end of the decade, management expects 737 program margins to reach 2018 levels, with 787 margins exceeding them.
All of this boils down to the simple equation we’ve been pointing to from the beginning: deliver more planes, generate more cash. Consensus expects Boeing to generate $2.15B in free cash flow in 2026, marking its first positive FCF year since 2023, before climbing to $5.61B in 2027 and $9.81B in 2028. That puts the long-awaited $10B target within reach, with commercial deliveries expected to reach 826 in 2028, surpassing the previous peak of 806 in 2018. Beyond higher deliveries, Boeing’s path to that target includes working down multiple billions of dollars in excess commercial inventory over several years without disrupting production ramp-ups. The 777X should also provide another leg to the recovery once it turns cash positive in 2029. For context, Boeing generated ~$13.6B of free cash flow in 2018, which is why management views $10B as just the first target in a broader recovery toward even higher levels, a view we share.
A record $715B backlog is backstopping the entire recovery, with demand continuing to outstrip what the factories can produce. Turning that backlog into deliveries and cash is all that matters over the next several years, with execution the only thing standing in the way. With Kelly Ortberg at the helm, we’re confident he’ll get the job done.
Stanley Black & Decker Update
For newer readers, here’s a brief overview of the key drivers behind our Stanley Black & Decker thesis, the world’s #1 tools company turning the page on a multi-year restructuring and a levered way to play the long-awaited housing recovery:
Company Overview
Founded 1843 in New Britain, Connecticut – the #1 world leader in tools and outdoor
Iconic brands: DEWALT, CRAFTSMAN, STANLEY, BLACK+DECKER, Lenox, Irwin, Cub Cadet
Tools & Outdoor: ~90% of sales (power/hand tools, lawn/garden); Engineered Fastening: ~10% (automotive/industrial fasteners)
90% of North American/European cars and light trucks use SWK fasteners; industry-leading North American manufacturing footprint (>60% of cost of sales)
Revenue mix: 62% U.S., 16% Europe, 13% emerging markets, 5% Canada
Major customers: Lowe’s (LOW) and Home Depot (HD) (~14% of sales each)
~$15.1B in net sales in FY2025 (-2% Y/Y); stock still down ~60% from 2021 highs
Largest domestic manufacturing footprint in the industry leaves SWK at parity to mildly advantaged versus competitors in the current tariff environment
Cost Savings Program
Launched $2B 3-year Global Cost Reduction Program in 2022 amid the post-pandemic de-stock/re-stock cycle, higher rates and inflation, a housing downturn, and excess inventory
Completed end-FY 2025: $2.1B in run-rate pre-tax savings achieved, exceeding the $2B target (including ~$120M in Q4). Most of it came from centralizing and scaling sourcing plus restarting a dormant engineered and material cost reduction program
Supply chain optimization: ~30-40% of Tools & Outdoor network sites transformed or closed
~85,000 SKUs discontinued
Headcount down >40% to ~41k from a peak of 71.3k
Inventories peaked at ~$6.64B in 2022; reduced ~41% to ~$3.90B as of 2Q’26 (down >$2.7B)
Targeting ~$200M of working capital reduction in FY2026 and a return to ~135 days sales-in-inventory (pre-COVID threshold), with management expecting to be a good portion of the way there by year-end
Management considers working capital productivity still in early innings. Fewer components, fewer SKUs, and fewer facilities make lower working capital feasible, though inventory will not be cut at customer expense
~150M shares outstanding – well over ~$13/share in savings delivered
Targeting ongoing ~3% annual productivity savings (~$300M gross) going forward
Margin Expansion
Adj. gross margins bottomed in Q4 2022 at ~19.5% (from inflation and excess inventory; historical range: mid-30s)
FY2025 adj. gross margin: 30.7% (+70 bps Y/Y)
Q2 2026 adj. gross margin: 33.7% (+620 bps Y/Y), including ~250 bps from net tariff refunds; balance driven by gross productivity and favorable product mix
1H’26 adj. gross margin of 32.0% (+310 bps Y/Y) came in ahead of the ~150 bps plan, with or without the tariff refund benefit
FY2026 adj. gross margin expansion of ~150 bps ex-refunds, plus an incremental 60-70 bps from net tariff refunds received in 2Q
Management target: 34-35% in 2H’26, consistent with the 35%+ exit rate ambition
The path to 35% assumes flat volumes with no market recovery, and runs on three levers: product platforming, lean and automation, and footprint rationalization
~50% of this year’s material productivity savings are enabled by platforming, with management expecting that to accelerate
Footprint rationalization has the most runway left, since the engineers and operators who would consolidate have been occupied moving production for tariff optimization
Last full year above 35% was 2018 at 35.2%, when EPS was $8.15 and the stock traded above $150
Long-term target: 35-37% adj. gross margins by FY2028
~Every 100 bps of gross margin expansion = ~$1/share in EPS
Adj. EBITDA margin of 11.3% in Q2 (+320 bps Y/Y); 1H’26 at 10.3% (+150 bps Y/Y)
On track to reach at-or-above industry-average USMCA-qualified import mix (up from ~1/3 at program start) and reducing China-sourced U.S. sales to <5% by end-2026 (from ~20%), both ahead of plan
2H’26 margin expansion is expected to lean meaningfully on tariff mitigation, specifically continued USMCA compliance progress and shifting U.S. tools production from China to North America
Deleveraging Through Asset Sales & Capital Allocation
Debt reduced >$3.7B since FY2022; net leverage improved from 5.9x (end-FY2023) to 3.4x (end-FY2025); on track for ~2.5x by end-FY2026 inclusive of buybacks
Convergent Security Solutions sold July 2022 for net proceeds of $3.1B
Mechanical Solutions business sold July 2022 for net proceeds of $916M
Oil and Gas business sold August 2022
Infrastructure business sold April 2024 for net proceeds of $729M
CAM sold to Howmet Aerospace (HWM) on April 6, 2026 for $1.8B all-cash (18x EBITDA, above the $1.0-1.5B expectation), ahead of the prior H1 2026 timeline; ~$1.8B of proceeds received net of cash sold, with a $273.7M pre-tax gain ($1.08 of GAAP EPS)
~$1.7B of debt reduction executed in 2Q using CAM proceeds plus operating cash flow
Over $6.3B in cumulative asset sales over ~4 years; multi-year restructuring now complete – focus shifts to share repurchases
Management considers large structural portfolio moves finished. The recent Excel divestiture was pruning, since SWK could already cover the outdoor zero-turn professional gas market with Cub Cadet. Product line reviews continue, with the walk-behind mower shift to a licensing model as the template
Board authorized new $500M share repurchase program, with ~3.2M shares repurchased for $250M in 2Q (~$250M remaining); capital allocation now biased toward buybacks while the M&A pipeline builds
Any future M&A would be tools brands or technologies that accelerate the organic story in target verticals. Management explicitly ruled out diversifying acquisitions or adding another leg of the stool
2Q’26 balance sheet: cash ~$0.6B, long-term debt $4.7B, no short-term borrowings, ~$4.1B of total additional liquidity
Return to Growth
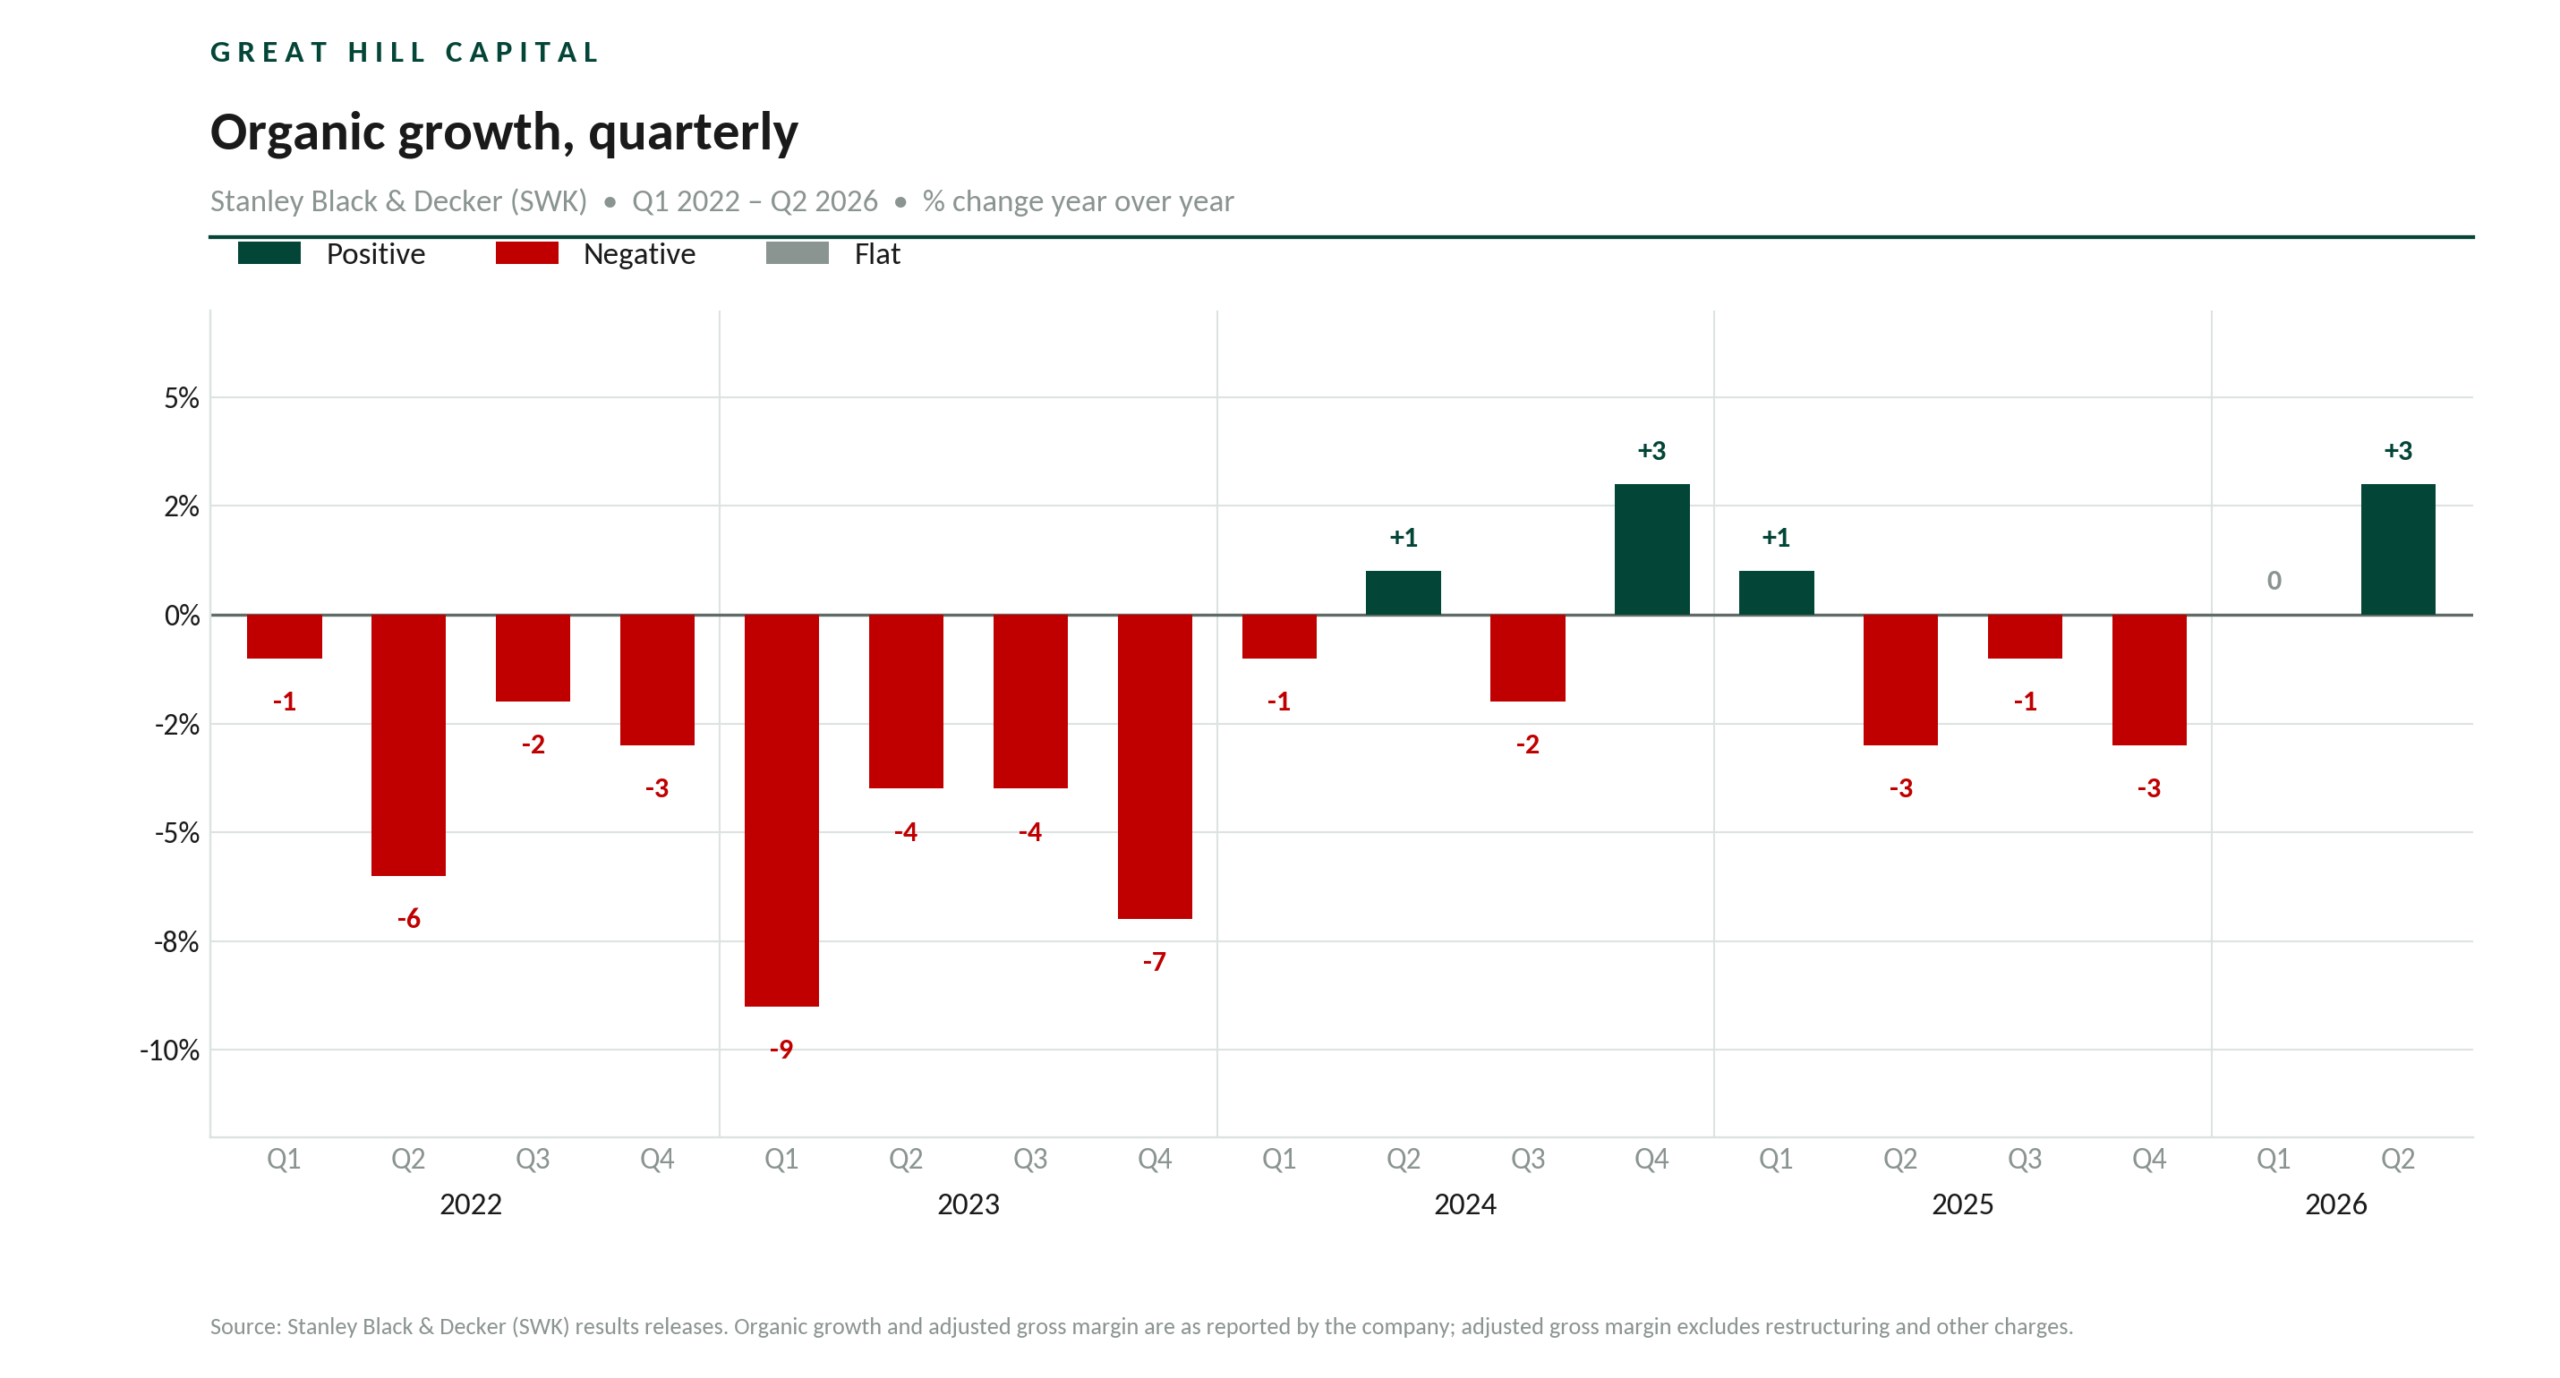
Stabilizing after multiyear pressures; FY2025 organic sales -1%; 1H’26 organic sales +1% (Q1 flat, Q2 +3%)
Q2 2026 revenue $3.96B (flat reported, +3% organic), ahead of the ~$3.9B guide and topping consensus by ~$40M
2026 guidance: low single-digit organic growth (total revenue ~flat on CAM close and gas walk-behind licensing)
Q2 2026 standouts: Power tools organic +8% (strongest in several years), U.S. C&I channel up low double digits, all three priority brands (DEWALT, STANLEY, CRAFTSMAN) growing organically, Industrial fasteners organic +7%, Automotive organic +2% (outpacing market); Outdoor organic -7% on weather-related softness the lone drag
Underlying demand is flattish overall. Commercial and industrial professional is very strong, housing has not inflected, and the DIY consumer is stabilized rather than growing
STANLEY inflected to organic growth in Q2, on pace with the mid-2026 target; management still points to 2H’26 for consistent STANLEY performance. Over 60% of STANLEY is European, sold through wholesalers, where SWK previously had no dedicated sales force. Those resources are now in place and producing growth
CRAFTSMAN also turned positive organically in Q2, with the relaunch (largest NPD cycle since SWK acquired the brand in 2017) and new V20 advanced batteries driving momentum; management targets consistent performance into 2027
Growth led by DEWALT ($7B+ franchise, ~half of total revenue, low-single-digit growth in FY2025) alongside the long-awaited inflection in CRAFTSMAN and STANLEY. The DEWALT push expands from traditional residential and carpentry strength into commercial and industrial mechanical, electrical, plumbing, and concrete
Management’s pricing argument on DEWALT: large professional enterprise users are relatively price insensitive because what is sold is labor arbitrage. Turning a two-person job into a one-person job matters on a data center timeline measured in hours and days
Management expects consistent, repeatable growth across all three brands by the middle of next year
U.S. C&I channel expected to approach ~10% of total Tools & Outdoor sales in 2026 (>$1.3B) on ~double-digit organic growth; projects served by this channel represent trillions of dollars of committed capital spending over the next 5 years (data centers, power generation, prefab manufacturing)
Long-term goal: mid-single-digit organic growth (2-3x market/GDP in normalized environments)
~50% of Tools & Outdoor tied to residential construction: 27% new construction, 23% repair/remodel
Key secular drivers: housing construction recovery, lower rates tailwind, U.S. housing shortage of ~4M homes, significantly aged housing stock (record ~42 years average age)
Innovation cycle time to improve 30% by end of 2026, feeding a product pipeline across DEWALT, STANLEY, and CRAFTSMAN
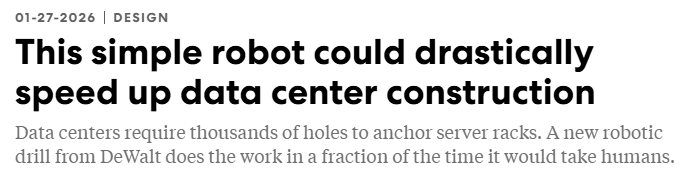
Introduced the world’s first downward drilling, fleet-capable robot (DALE) accelerating data center construction: 385K+ holes drilled at 99%+ accuracy, up to 10x faster than conventional methods, and 300+ weeks saved across 44 data center construction phases
Key Financials + Valuation
FY2025: Net sales $15.1B (-2% Y/Y, -1% organic); adj. EPS $4.67 (+7% Y/Y); FCF $688M (ahead of prior ~$600M guide)
1H’26: Net sales $7.81B (+1.5% Y/Y); adj. EPS $2.36 (vs. $1.83 LY); FCF $251M (vs. -$350M LY)
2026 guidance: adj. EPS $5.20-5.80 (midpoint $5.50, +18% Y/Y); FCF $600-800M including CAM-related taxes/fees or $800M-$1.0B excluding; organic sales low single digits; ~150 bps adj. gross margin expansion ex-refunds plus 60-70 bps from refunds
3Q’26 guide: net sales ~$3.7B (flat reported), organic +3-4%, adj. EPS ~$1.50-1.60
Trading at ~14.4x 2027 projected earnings ($6.38)
Dividend: quarterly rate now $0.84 (from $0.83); ~3.8% yield; 150 consecutive years of payments (longest streak of any industrial company on the NYSE); 59 consecutive years of increases (every year since 1968)
Q2 Commentary & Recent Developments
Stanley Black & Decker delivered another quarter of steady execution in Q2, with revenue of $3.96B topping expectations on +3% organic growth, while adjusted EPS of $1.57 came in well ahead of the ~$1.21 consensus. Adjusted gross margins (the #1 metric in the SWK turnaround) expanded 620 bps Y/Y to 33.7%, giving management the confidence to raise its full-year adjusted EPS outlook to $5.20-$5.80 (+18% Y/Y at the $5.50 midpoint) and increase its free cash flow outlook to $600M-$800M.
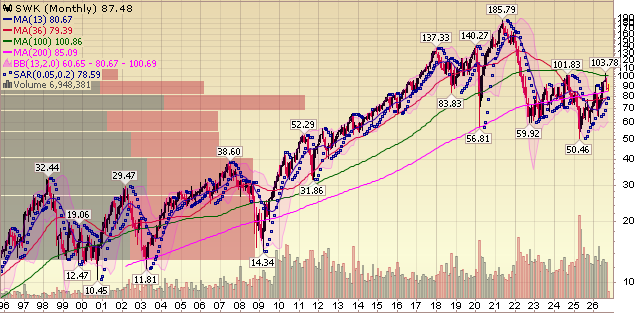
The market has clearly liked what it has been hearing, with steady improvement in margins and the balance sheet, followed by a return to top-line growth, helping lift shares ~70% off their Liberation Day lows to ~$90. Even so, the stock remains ~60% below its 2021 highs, with the market still pricing SWK as a levered, rate-sensitive arms dealer on the housing cycle that can’t work without a full-blown housing recovery.
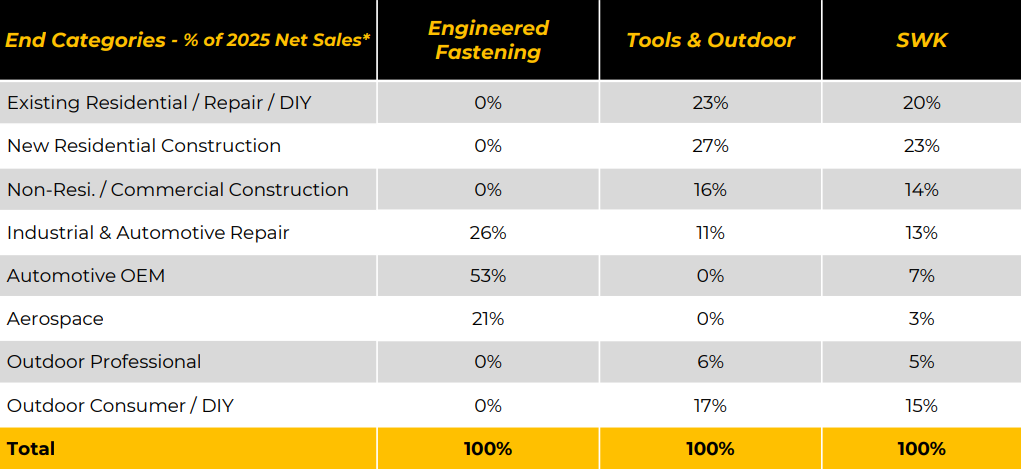
While housing is undoubtedly a big piece of the story, with ~45% of the business (~30% in the U.S.) tied to residential construction, that view overlooks the changes SWK has made to build a stronger, more resilient business capable of growing even in a weak end market. The second quarter was a perfect example. Residential construction spending is down 4.1% YTD, housing starts are down 1.2%, and new home sales are down 2.9% through August, all while 30-year fixed mortgage rates now carry a 7 handle. Despite that backdrop, SWK delivered 3% organic growth, its highest in six quarters, pointing to share gains and a more durable business than the market remembers. In fact, management’s entire growth plan going forward is built around a broadly flat market, with no significant volume tailwind or housing recovery baked into the outlook.
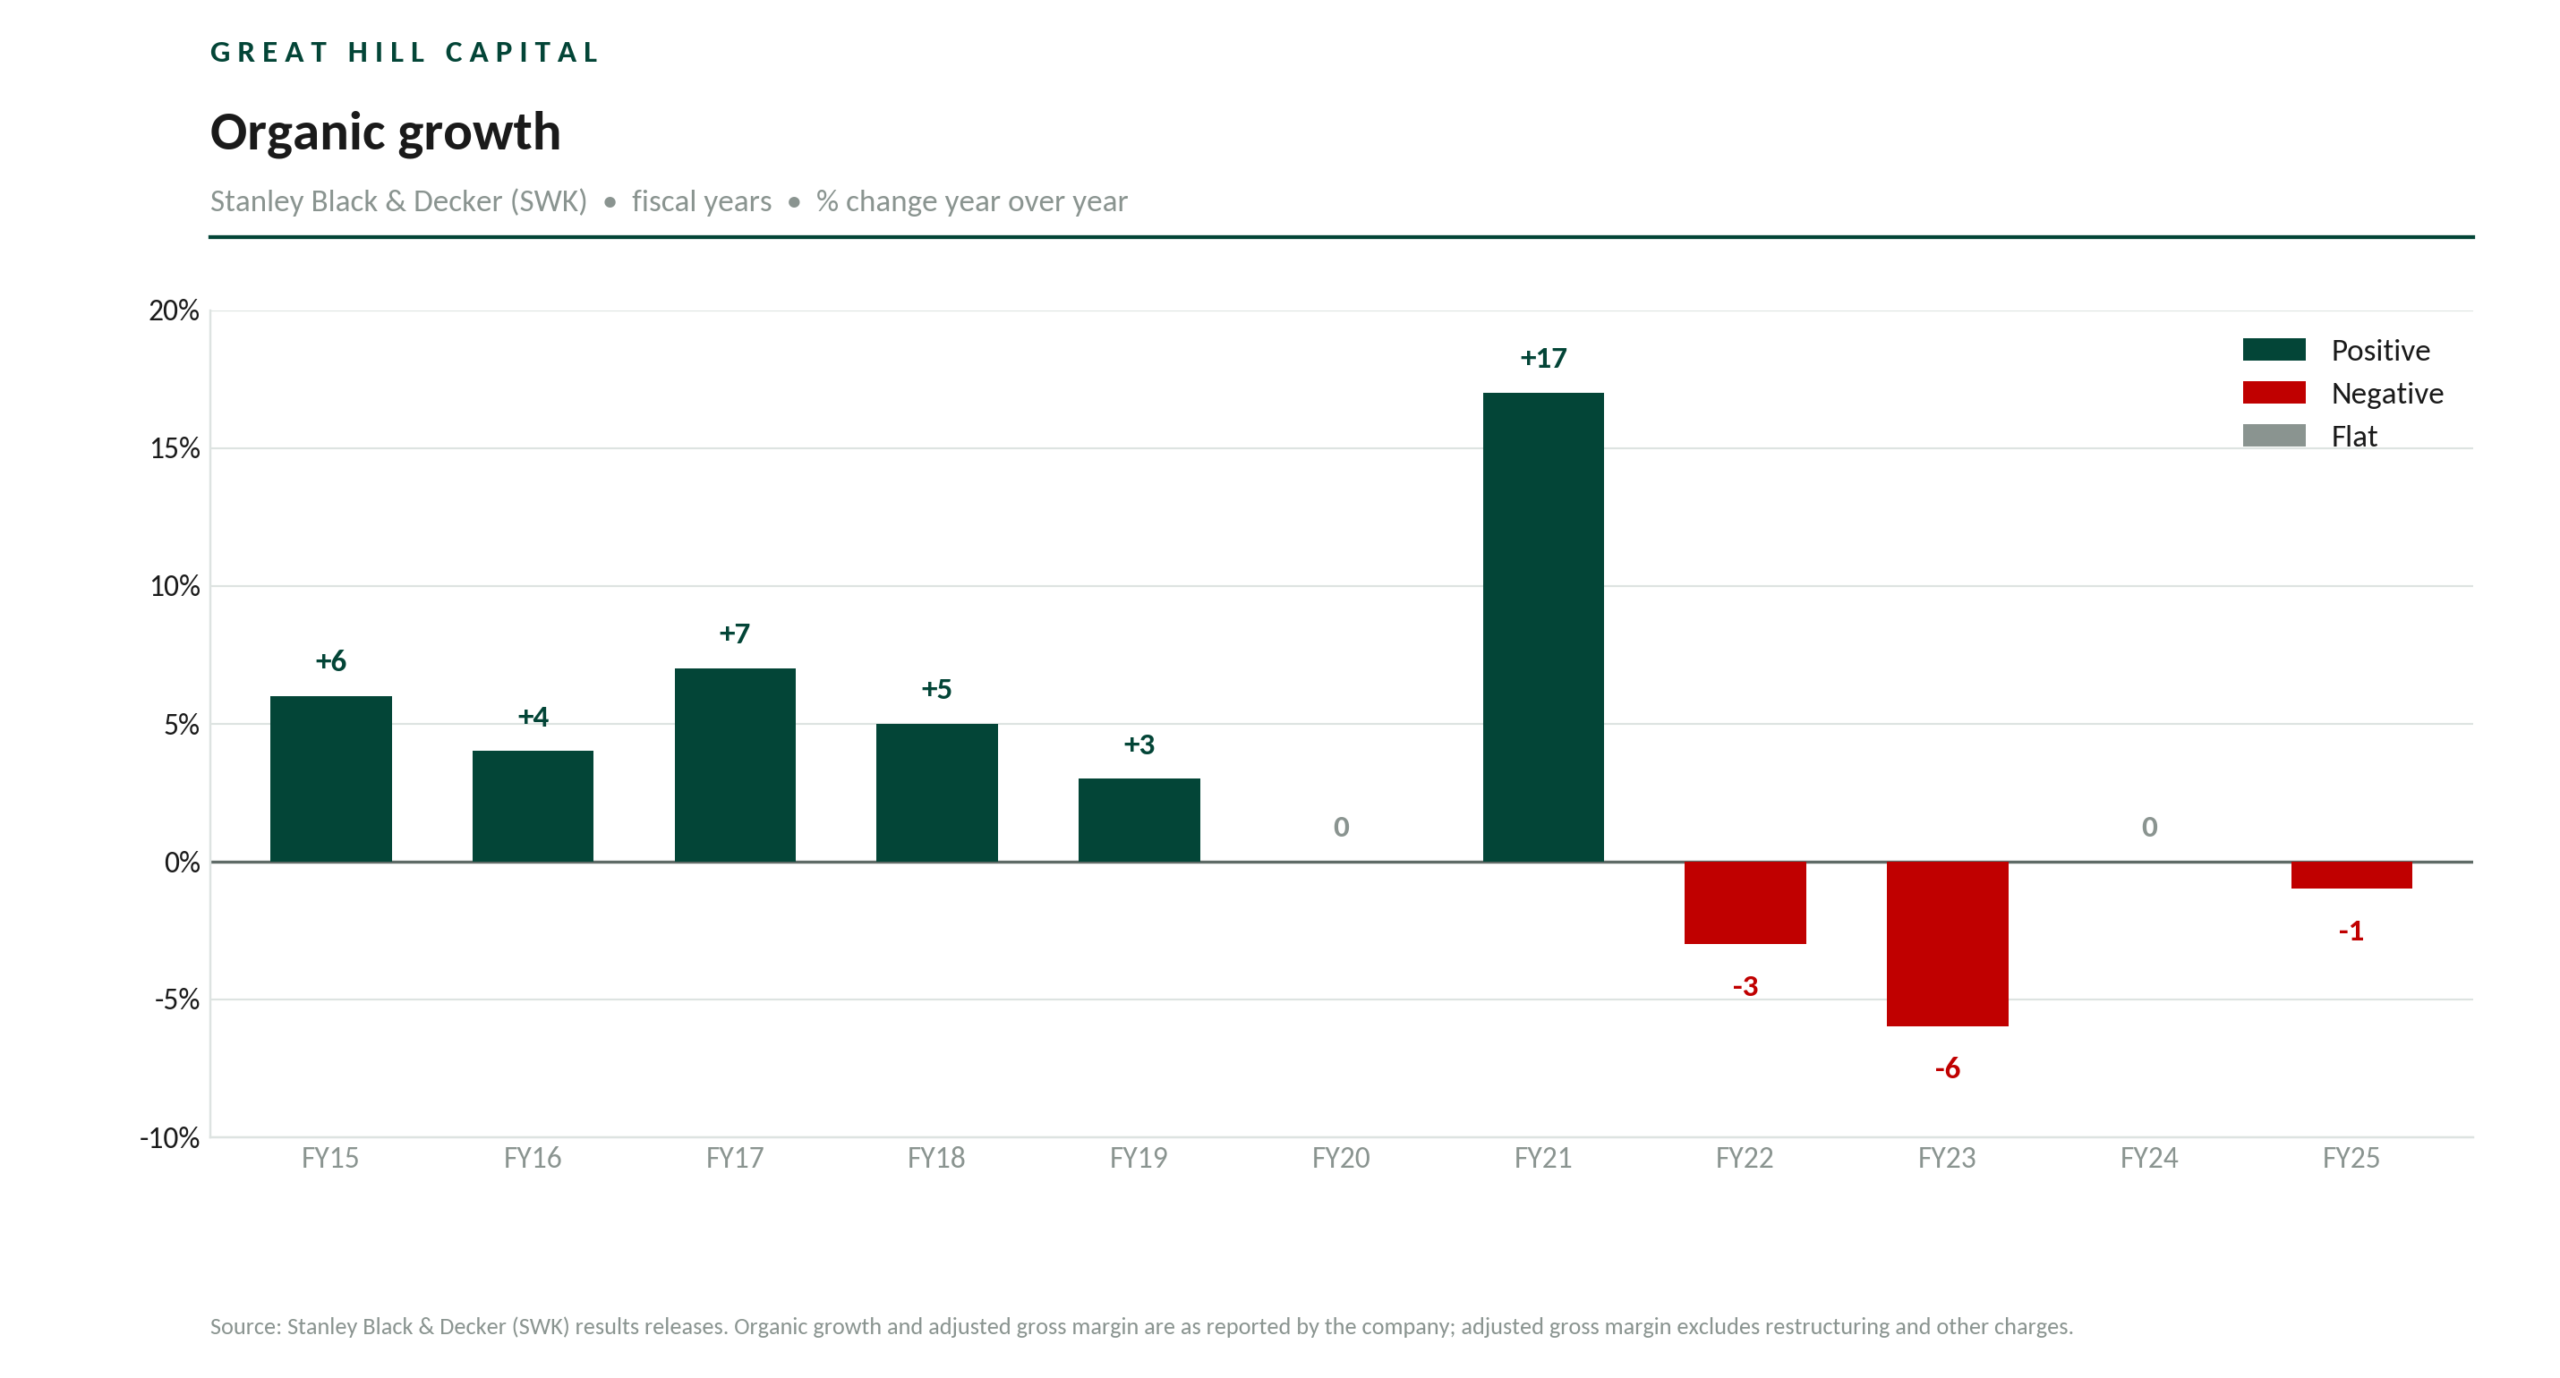
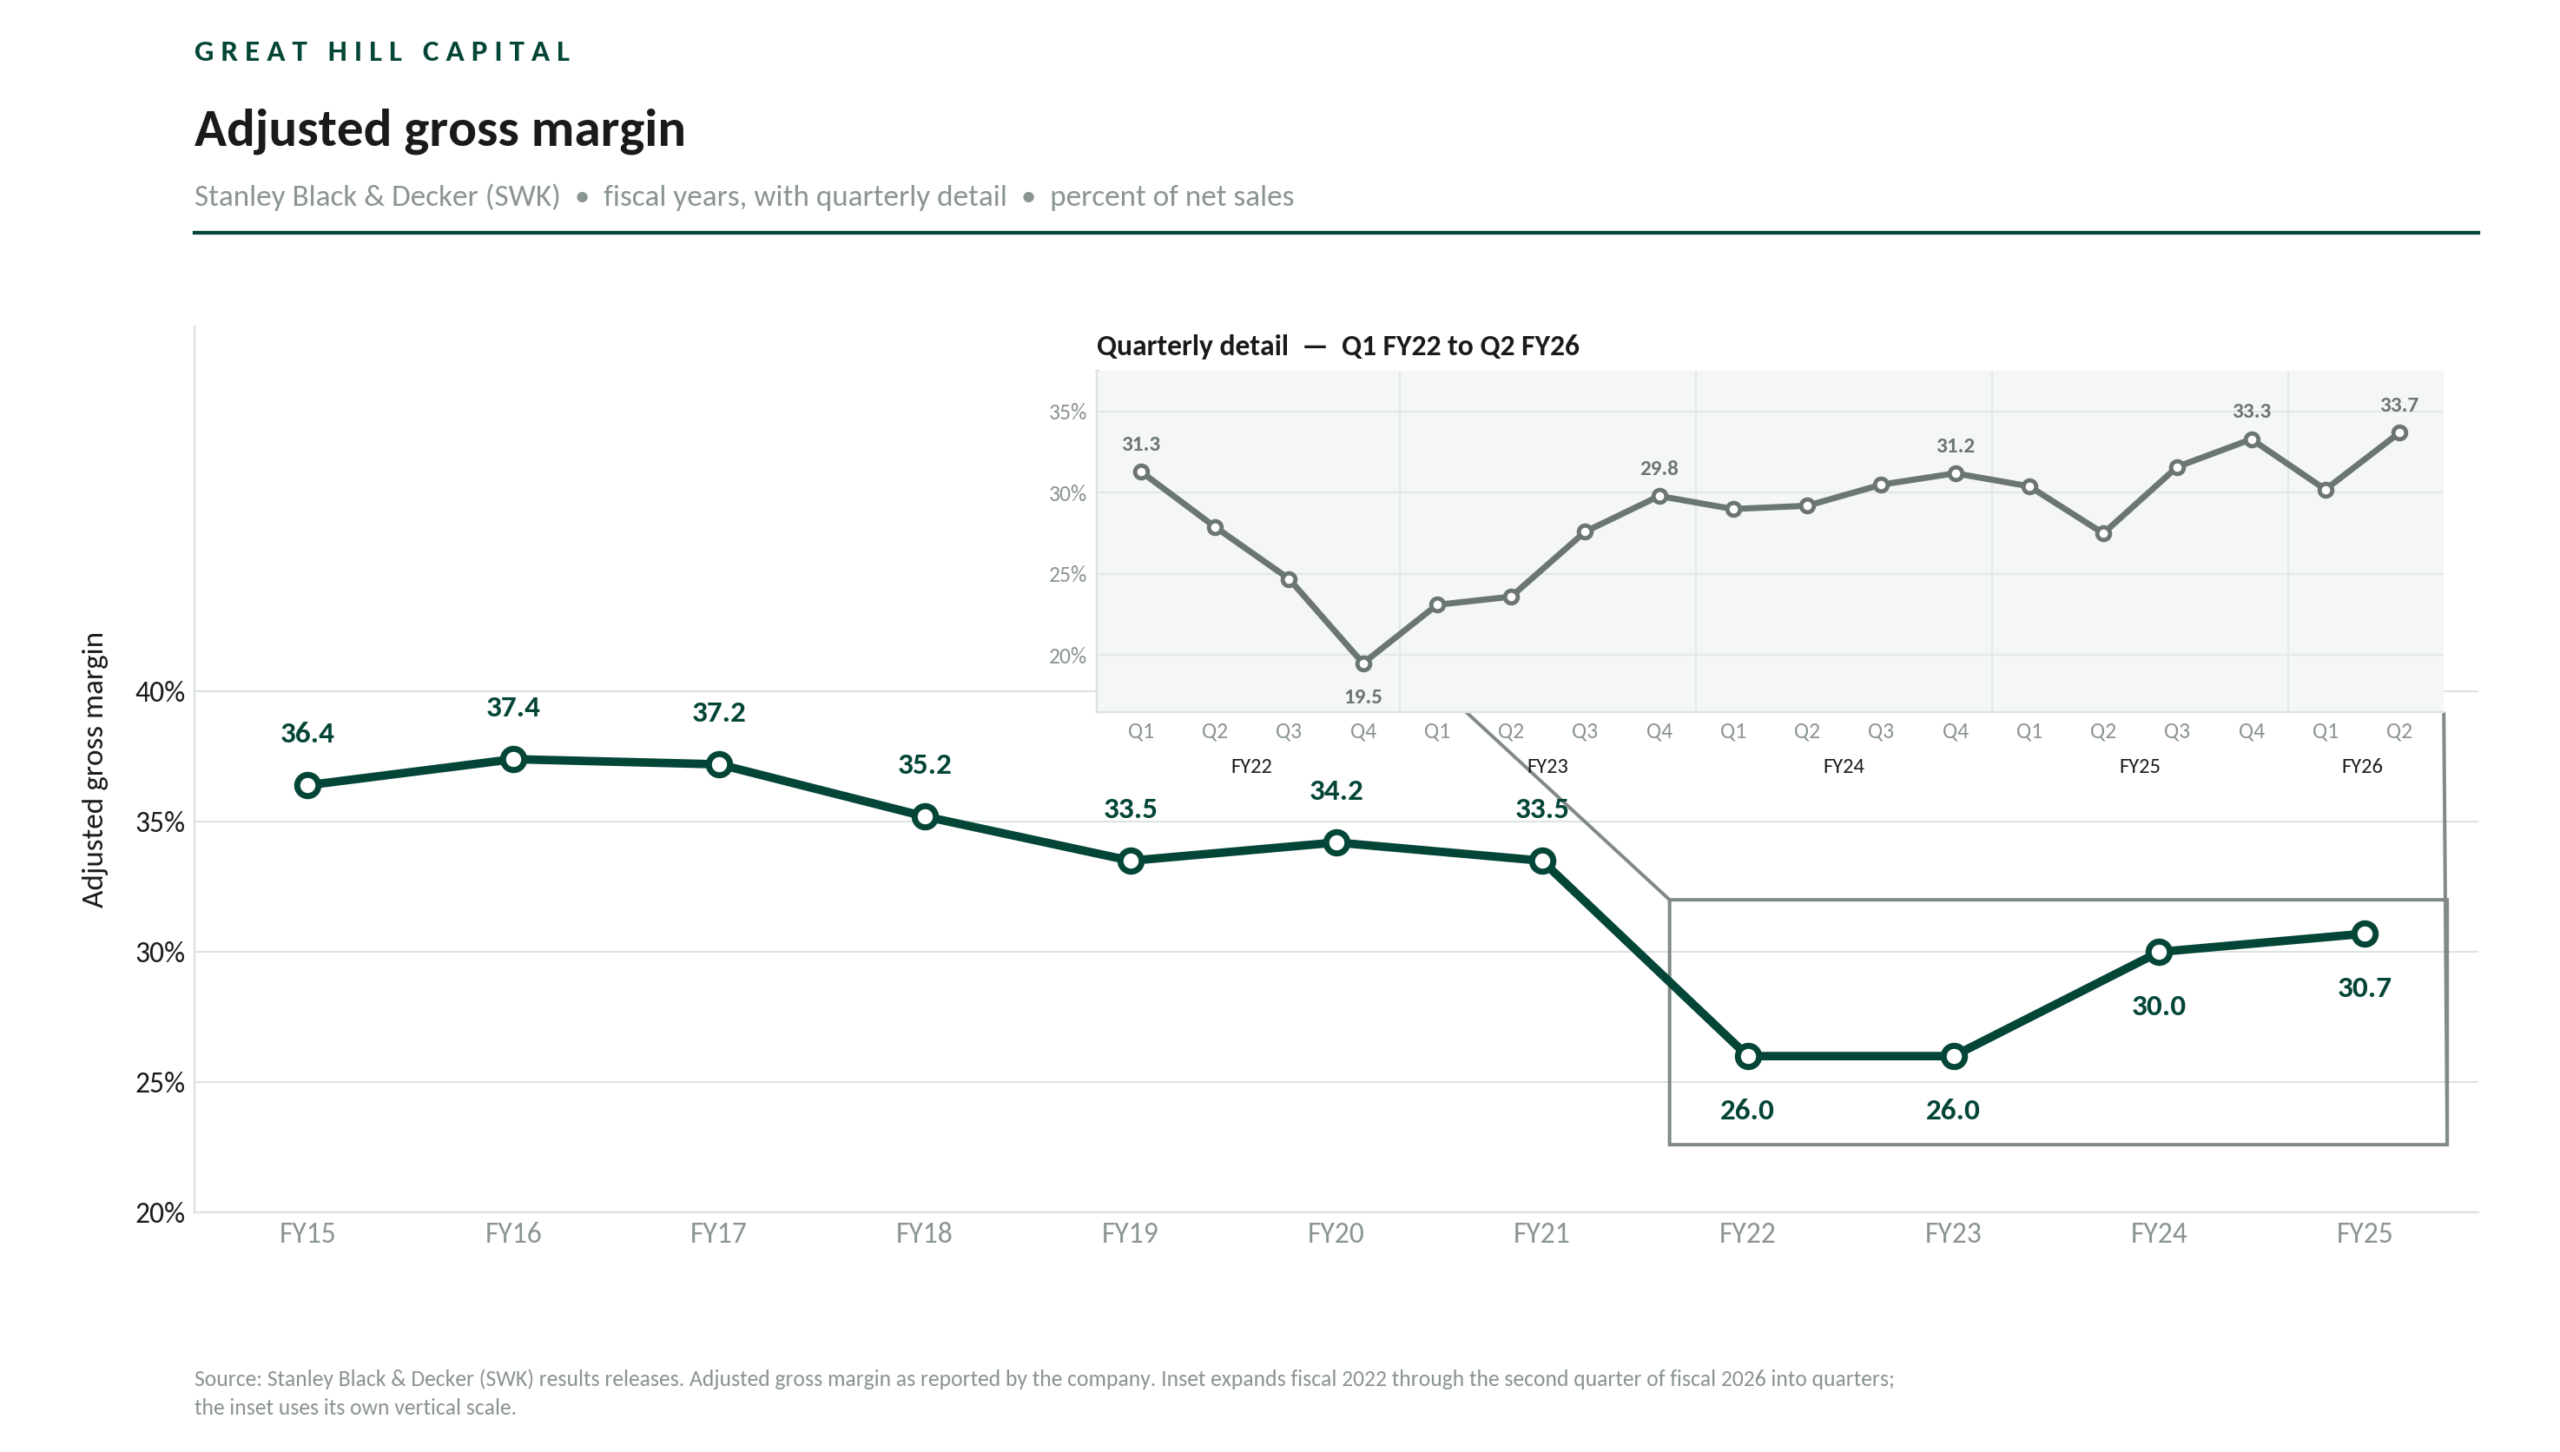
To understand how much SWK has changed, it helps to revisit how it got here. Like many goods-oriented businesses, SWK rode a surge of pandemic-era demand to +17% organic growth in 2021, versus a typical low-to-mid-single-digit growth year, building inventory to keep up just as spending began rotating from goods back to services. With rates ripping higher and housing activity grinding to a halt, SWK was caught offsides with bloated inventories and a cost structure built for a world that no longer existed, spending the next four years digesting that pull-forward as organic sales fell in three years and were flat in one. Gross margins bore the brunt, troughing at 19.5% in Q4 2022 and finishing that year at a cycle-low 26.0%, while net leverage climbed to 5.9x by the end of 2023.
Management responded with a multi-year overhaul that touched nearly every corner of the business, including a $2B cost reduction program that ultimately delivered $2.1B in run-rate savings, significant headcount reductions, ~85K discontinued SKUs, and more than $2.7B of excess inventory cleared from the system. A steady stream of non-core divestitures helped repair the balance sheet along the way, with April’s $1.8B sale of CAM to Howmet Aerospace closing the final chapter of the restructuring effort and funding $1.7B of debt reduction in Q2 alone.
The payoff from that work is now showing up in the margin line, with gross margins climbing to 33.7% in Q2, a recovery of more than 11 percentage points even after stripping out the ~250 bps tariff refund benefit. Management is guiding to 34-35% in 2H, with the long-term target of 35-37% by 2028 still intact, a level SWK last cleared on a full-year basis in 2018, when EPS reached $8.15 and the stock traded above $150.
While management’s plan to reach its margin targets is built around a flat market, it has no intention of settling for flat growth. SWK is on track to outgrow a stagnant market in FY26, delivering LSD organic growth and its first year of organic growth since the 2021 pull-forward.
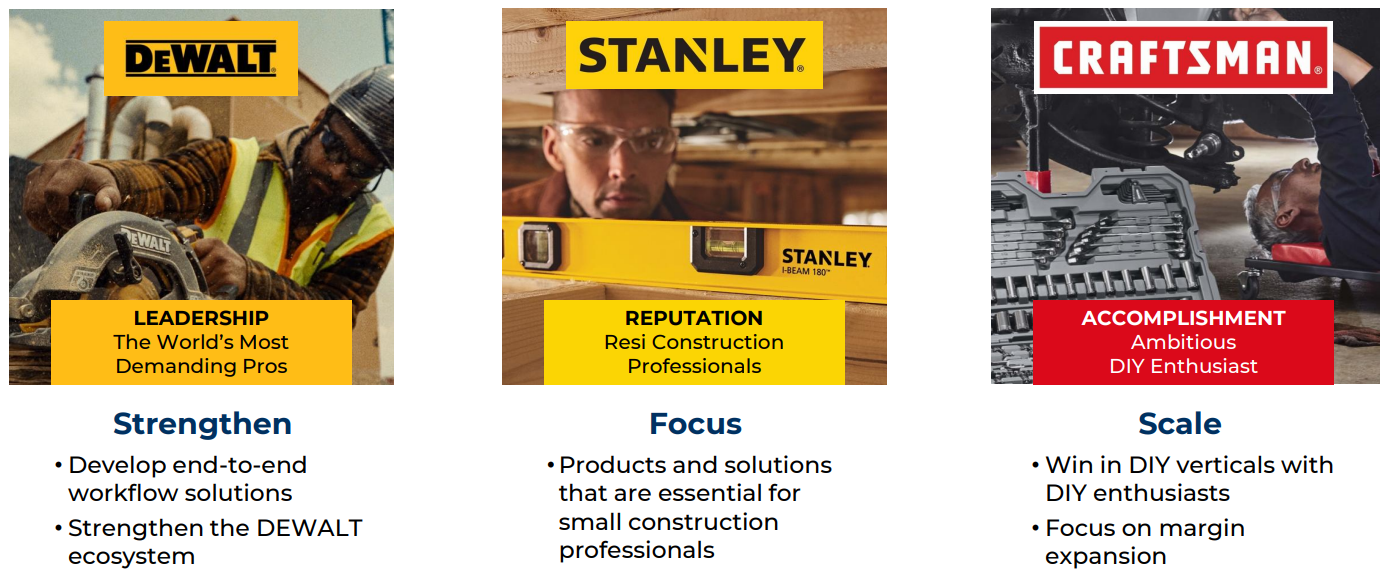
Growth is being driven by all three core brands, led by the power tools segment at +8% in Q2, its strongest showing in several years. DEWALT remains the main growth engine, while STANLEY is inflecting behind a full product refresh and a newly dedicated European sales force (Europe accounts for >60% of STANLEY sales). DIY-focused CRAFTSMAN is also benefiting from its largest launch cycle since SWK acquired the brand in 2017. Home Depot and Lowe’s, which each account for ~14% of sales, backed up that strength on their own Q2 earnings calls a few weeks after SWK reported, with HD reporting a record quarter for portable power tools and LOW expanding its tool assortment with 150+ new DEWALT items.
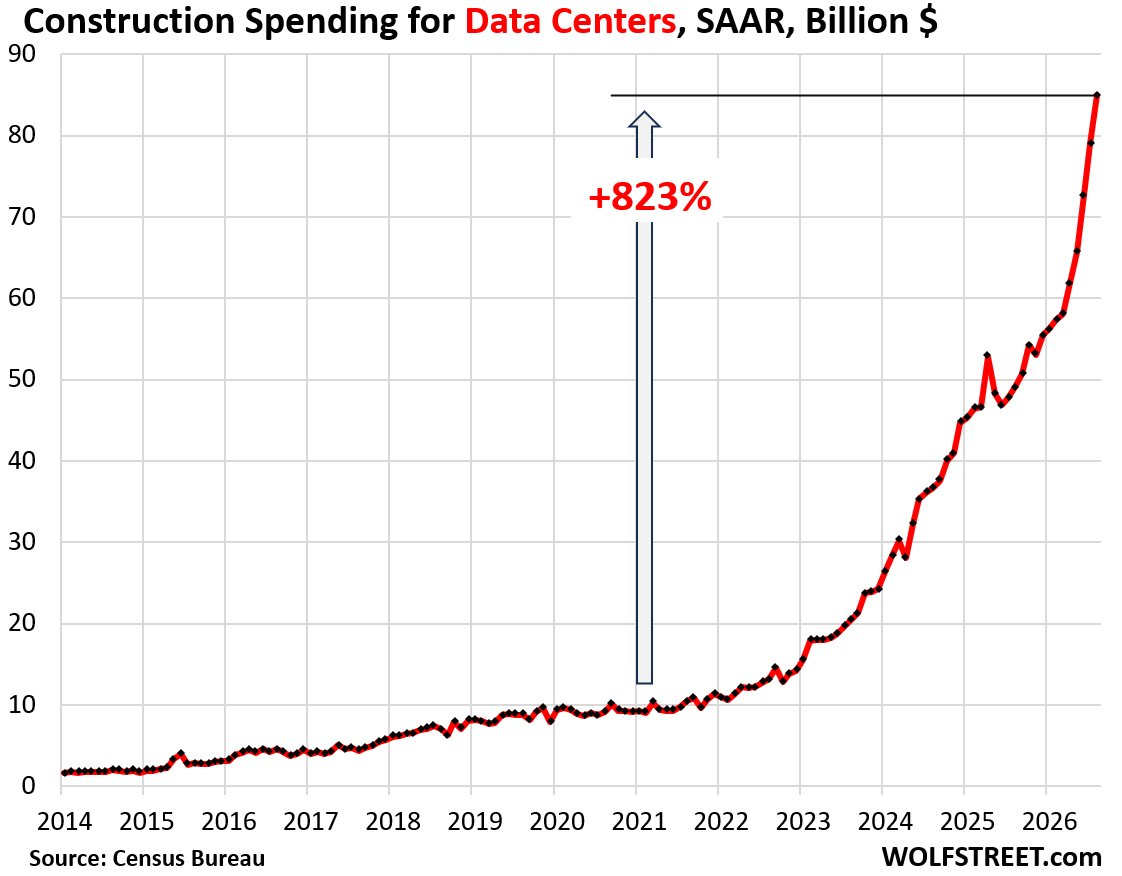
The biggest bright spot is the pro channel, which has become a key driver of top-line strength. The U.S. commercial and industrial channel grew low double digits in Q2 and is on pace for more than $1.3B in sales this year (~10% of Tools & Outdoor). With its pro-focused DEWALT brand accounting for nearly half of total company sales, SWK is well positioned to benefit from the massive capex buildout led by data centers. Private data center construction spending climbed 73% Y/Y to ~$85B in August (+823% since the start of 2021), with trillions of dollars in capital spending expected over the next five years.
SWK wants to get more of that spending in its pockets by going beyond the store shelf, placing dedicated project solution managers and hundreds of trade specialists directly on large job sites. It is also launching new innovations aimed at these massive projects, including DALE, DEWALT’s fleet-capable drilling robot, which has already drilled 385K+ holes for anchoring server racks at 99%+ accuracy, shaving more than 300 weeks off schedules across 44 data center construction phases.

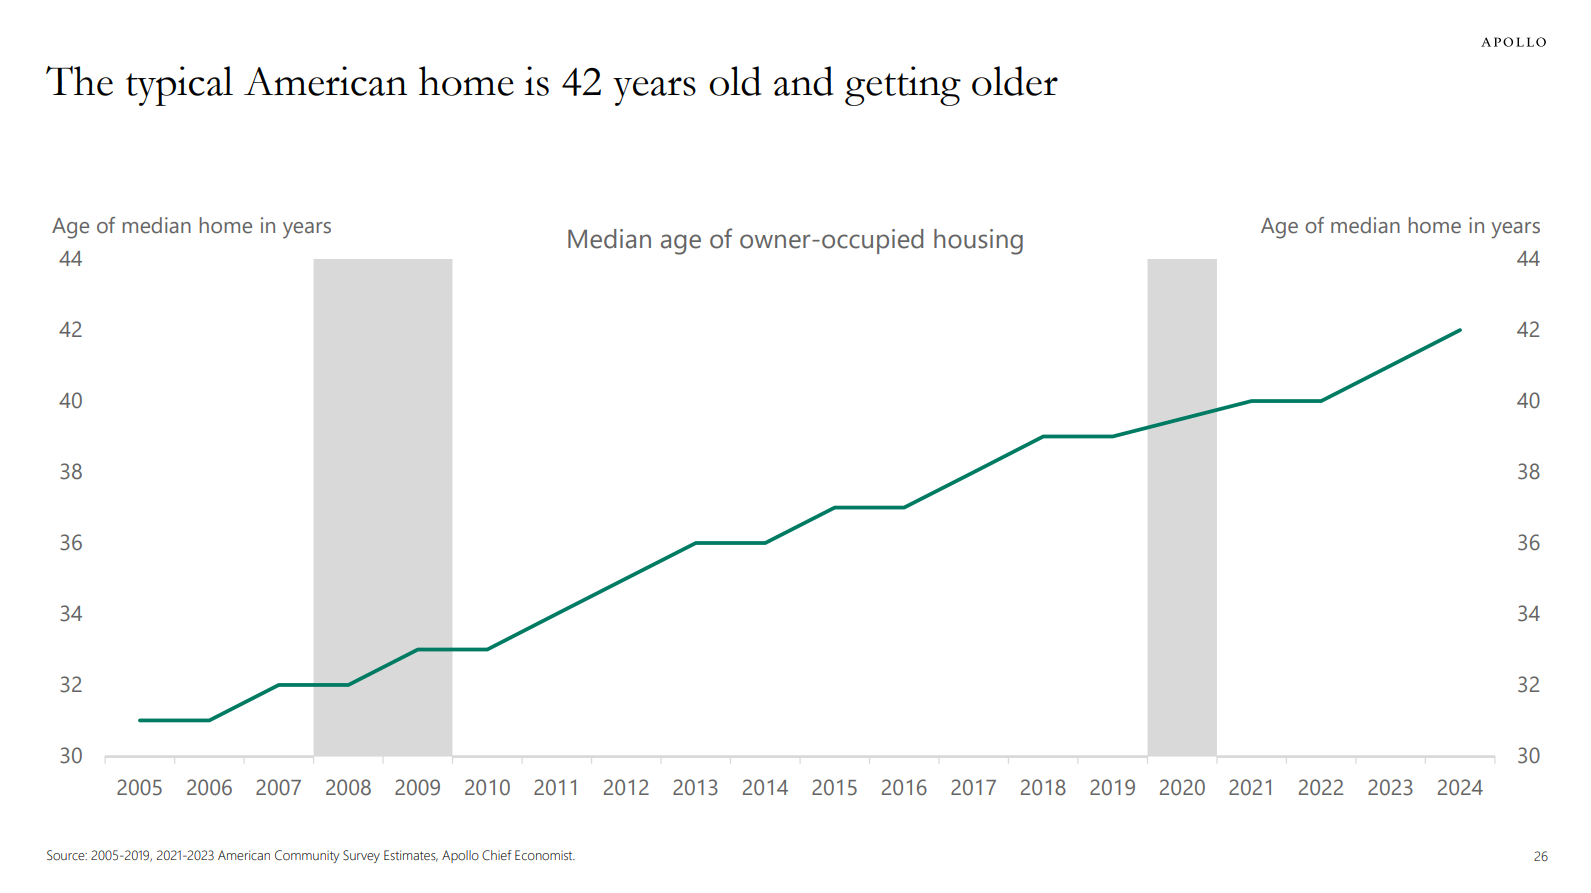
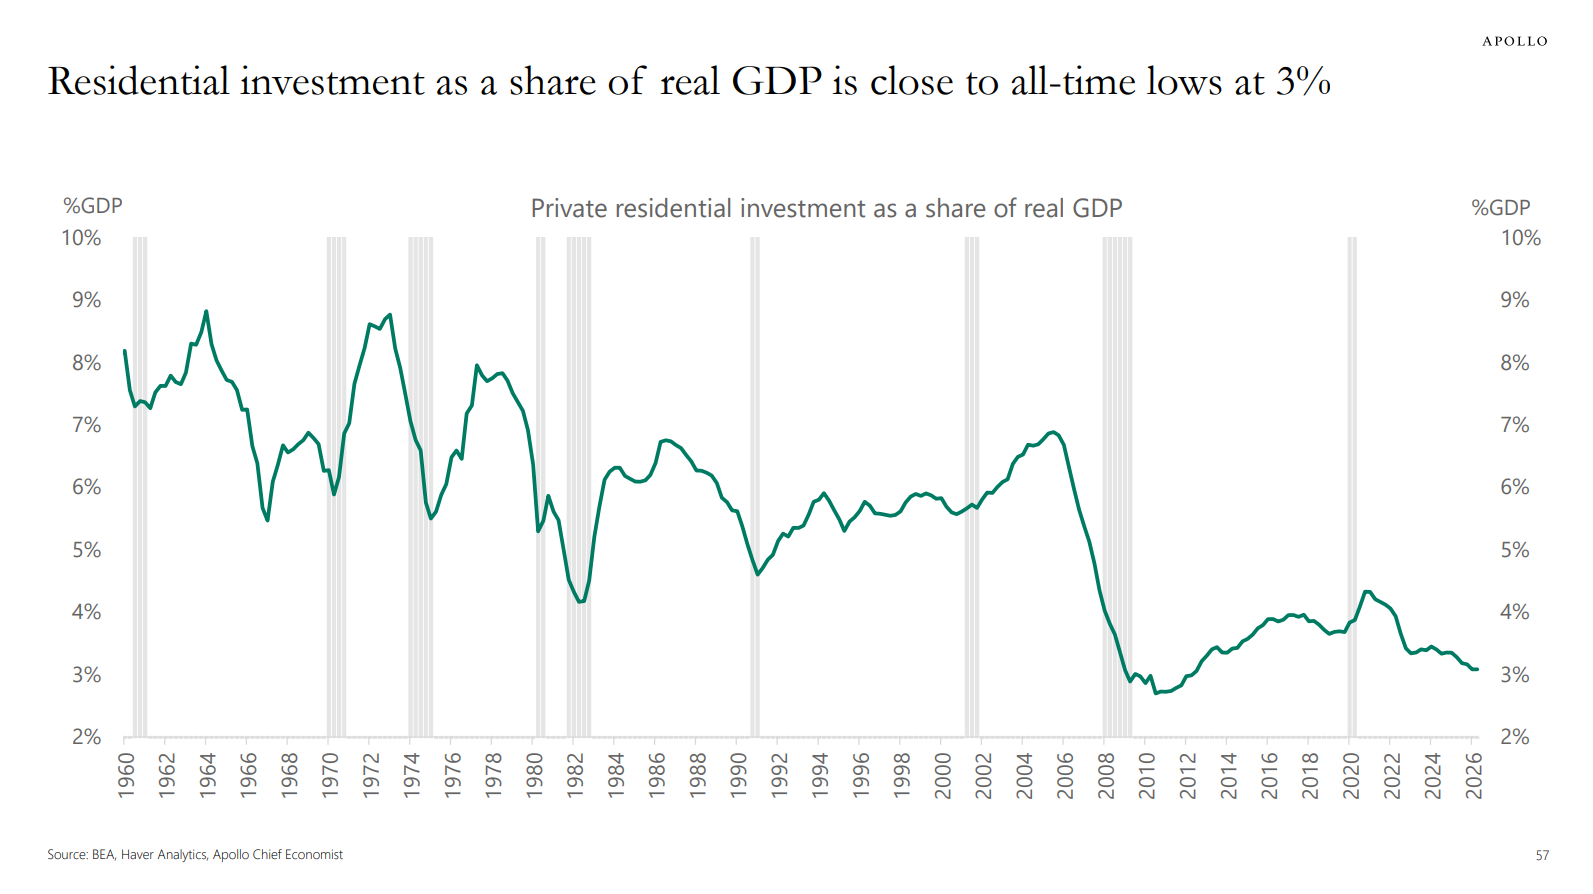
None of this diminishes the importance of housing, which remains a central part of why we own the stock. We don’t believe SWK needs a major housing recovery to work, but at today’s washed-out levels, we see far more room for upside than downside. Near-term headwinds look temporary against a backdrop of long-term demand drivers, with the average American home now 42 years old, residential investment hovering near all-time lows at ~3% of real GDP, and a ~4M-unit housing shortage colliding with 70M+ millennials entering their prime family-formation years. Elevated rates may keep activity subdued for now, but every quarter of delay adds to that pent-up demand, setting up a recovery that would provide another tailwind for a business already growing without one.
Management continues to pull internal levers to accelerate growth, most recently by redeploying the tariff refunds received in Q2. Rather than letting the refunds flow straight to the bottom line, SWK is directing the bulk toward growth investments on top of the $75-100M already planned for 2026, with spending focused on field presence, brand activation, and new product development in areas where returns are already tracking well.
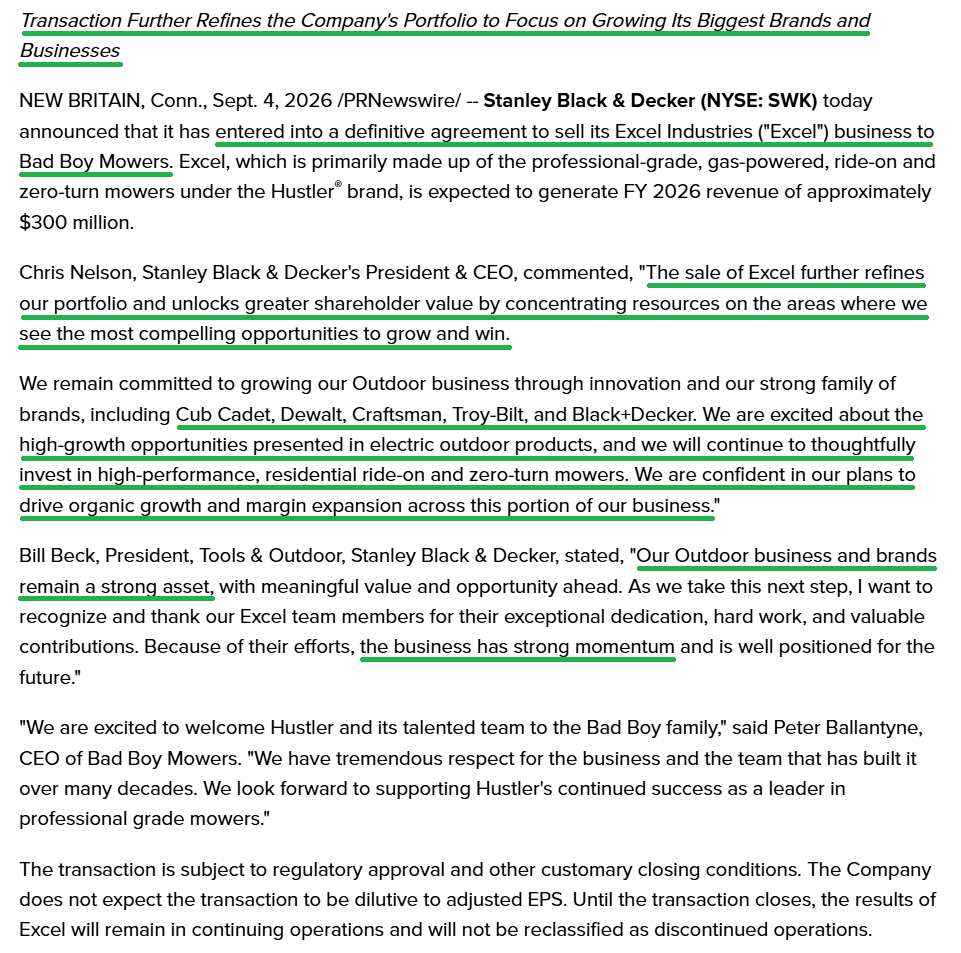
SWK is making these growth and innovation investments with a cleaned-up balance sheet and remains on track to reach ~2.5x net leverage by year-end. With the major portfolio moves complete, any further divestitures will be targeted pruning, as seen in the recently announced sale of its Hustler mower business (a ~$300M annual revenue business) to Bad Boy Mowers.
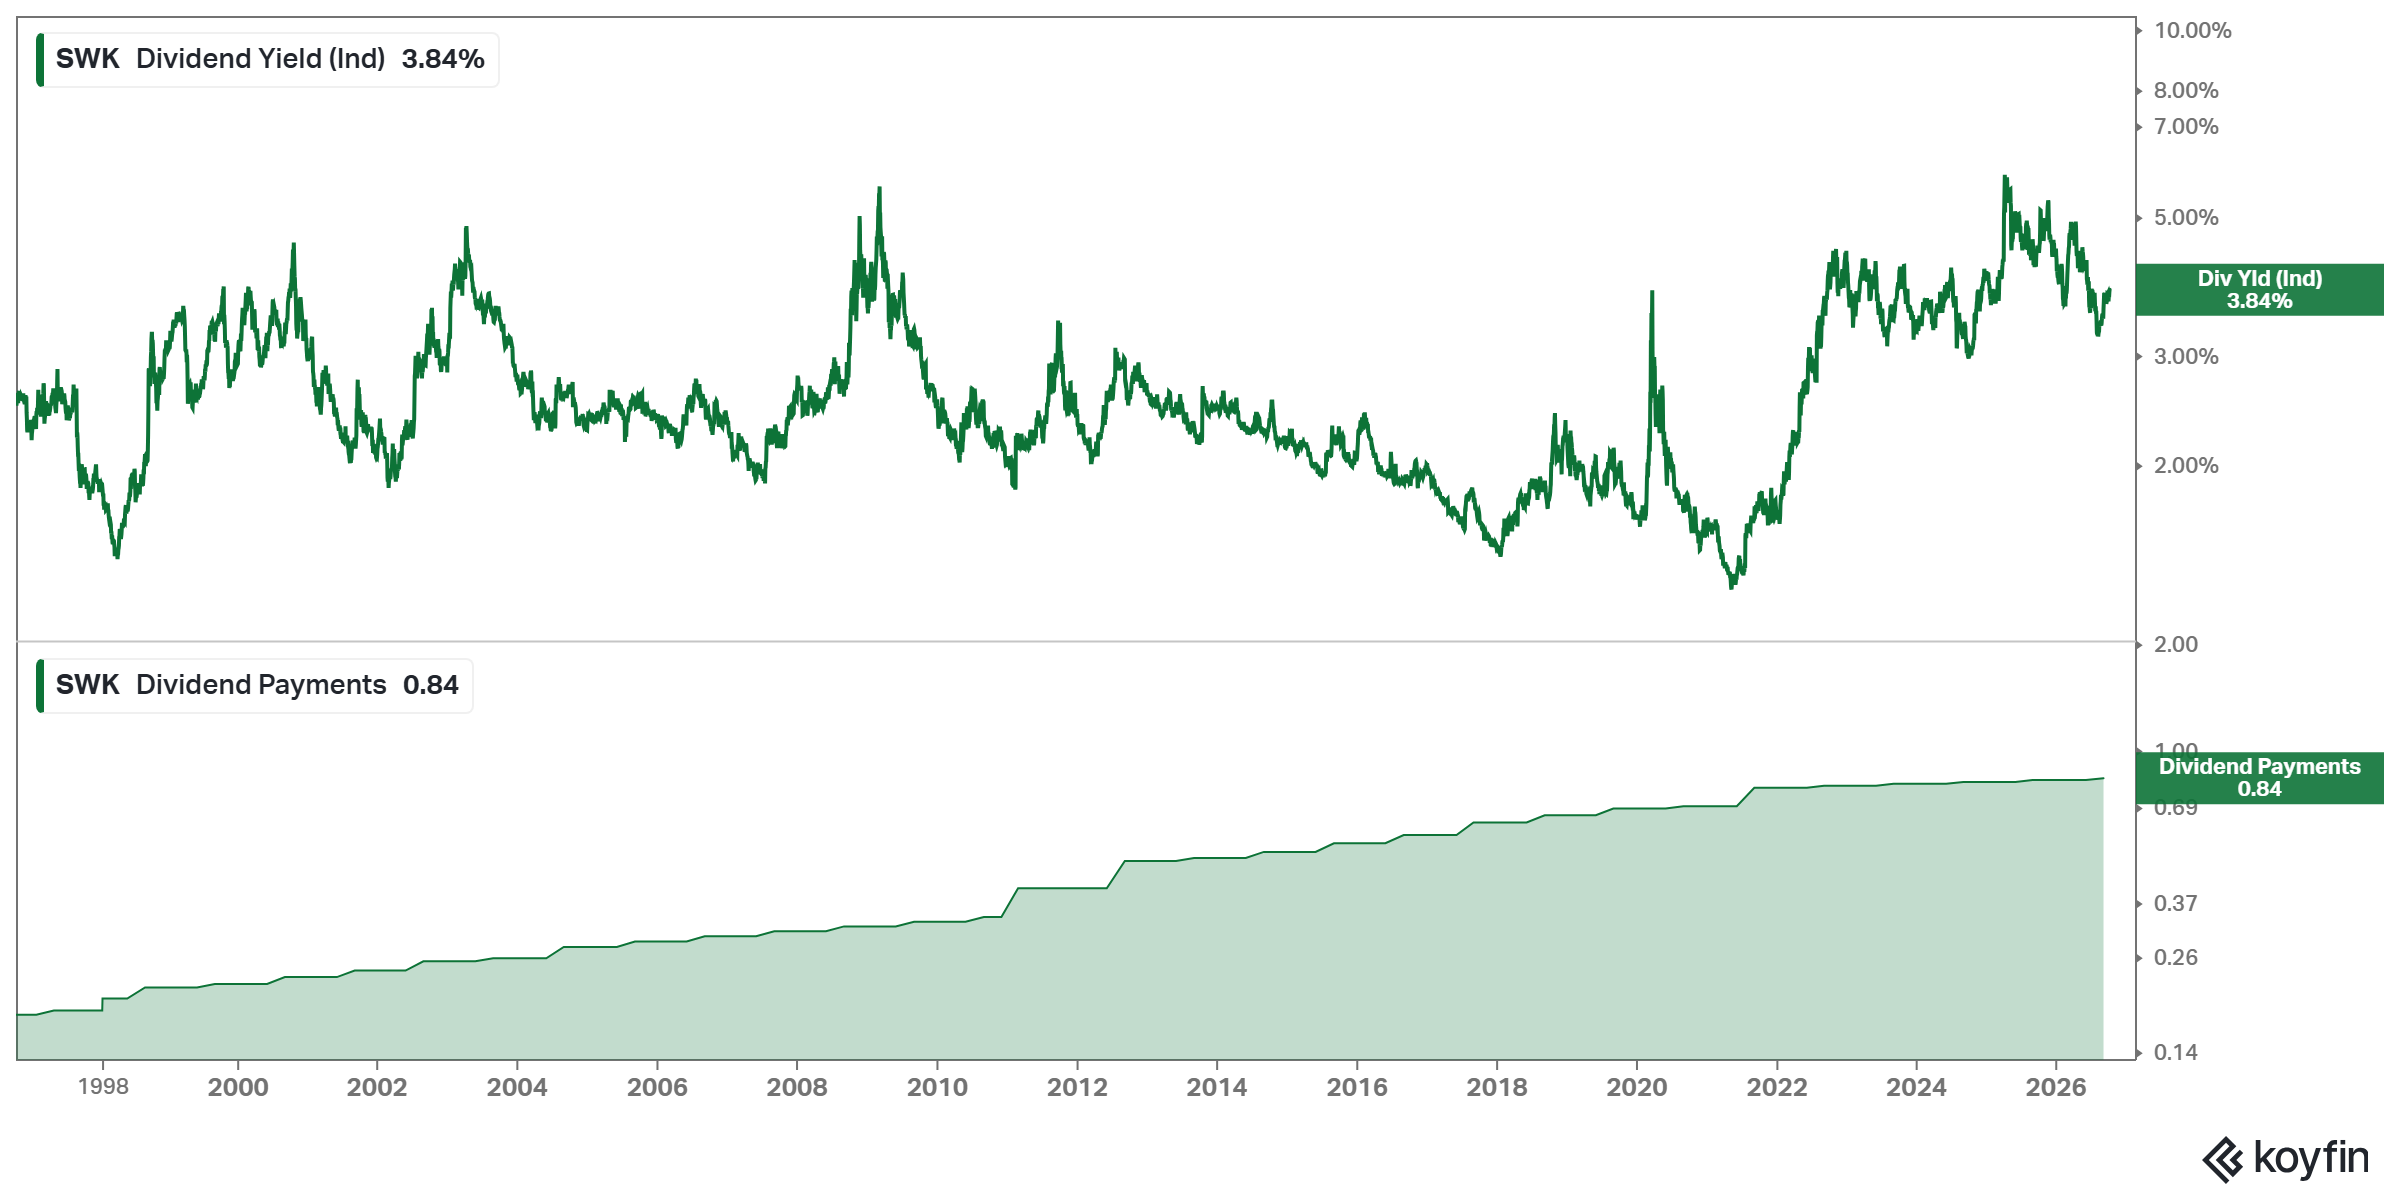
Capital allocation has shifted from debt repayment toward shareholder returns, as SWK repurchased ~3.2M shares for $250M in Q2 under its new $500M authorization. Those buybacks come alongside a dividend the Board just raised to $0.84 per share (~3.79% annual yield), extending a streak of 59 consecutive years of increases and 150 straight years of payments, the longest of any industrial company listed on the NYSE.
Weak housing activity and near-term headwinds have kept a lid on expectations, with consensus calling for sales growth of just 0.2% this year, 1.4% in 2027, and 3.1% in 2028, setting a low bar for upside surprises. Even on that muted top line, EPS is expected to compound at a double-digit clip, growing from $5.60 this year to $7.08 by 2028, which speaks to the massive operating leverage embedded in the business and the earnings upside that even a modest top-line surprise could deliver.
So while the market waits for housing to give the all-clear, we think it’s overlooking the durability of the business today, after years of heavy lifting and with the top line already recovering. When the housing recovery joins the party, it will simply be icing on the cake.
General Market
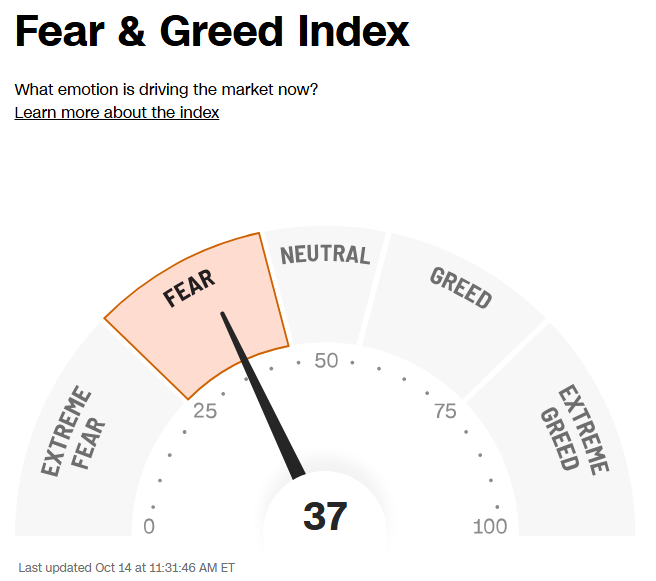
The CNN “Fear and Greed Index” ticked down to 37 this week from 48 last week. You can learn how this indicator is calculated and how it works here: (Video Explanation)
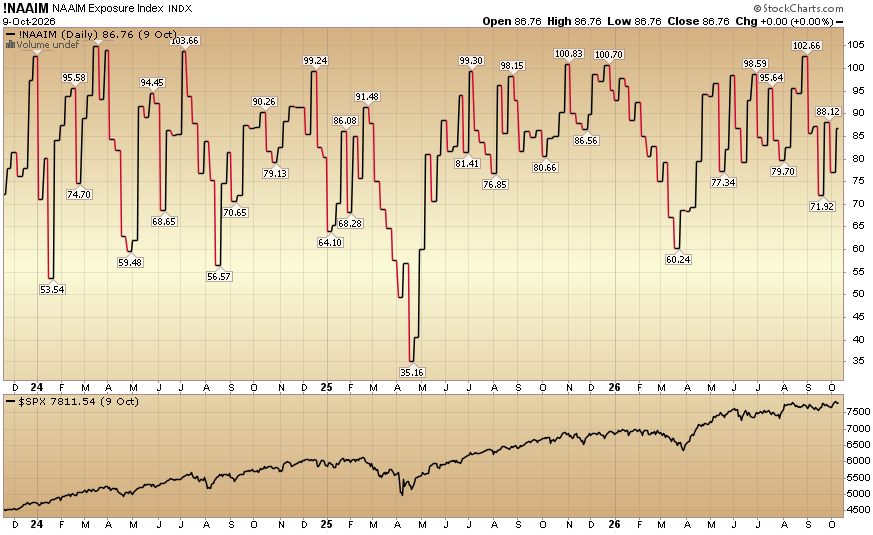
The NAAIM (National Association of Active Investment Managers Index) (Video Explanation) ticked up to 86.76% equity exposure this week from 76.99% last week.

Comments
Log in or sign up to join the conversation.