

Key Market Outlook(s) and Pick(s)
On Monday, I joined the great Stuart Varney on Fox Business’ Varney & Co. to discuss markets, the economy, tech, hyperscalers, AI, rotation, and a lot more. Thanks to Stuart and Nick Palazzo for having me on. Link here.
On Monday, I joined Veronica Dudo on EWTN to discuss markets, Anthropic ($ANT), IPOs, AI, SpaceX ($SPCX), Meta ($META), and more. Thanks to Veronica and Sarah Davies for having me on. Link here.
PayPal Update
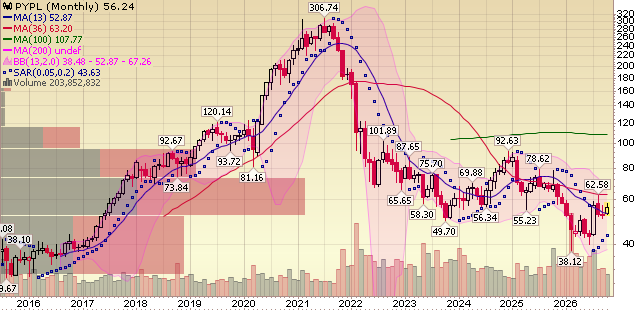
For newer readers, here’s a brief overview of the key drivers behind our PayPal thesis, an overlooked global payments leader with a cash machine core business funding aggressive buybacks and a long list of growth catalysts hiding in plain sight:
Company Overview
Founded in 1998. Headquartered in San Jose, CA. A global two-sided payments network connecting 440M active consumer accounts with millions of merchants across 200+ markets.
PayPal and Venmo are the #1 and #2 most popular mobile payment apps in the U.S. One of only four globally recognized payment networks alongside Visa, Mastercard, and American Express.
$1.79T in Total Payment Volume in 2025 (+7% Y/Y); 25.4B transactions processed. ~90% of revenue from transaction fees; ~10% from value-added services.
TPV mix: 63% U.S., 37% international. ~90% penetration of Fortune 500 companies. Active accounts: 439M (55% U.S., 45% international).
New organizational structure: three business units — Checkout Solutions and PayPal; Consumer Financial Services and Venmo; and Payment Services and Braintree. Each with a single leader.
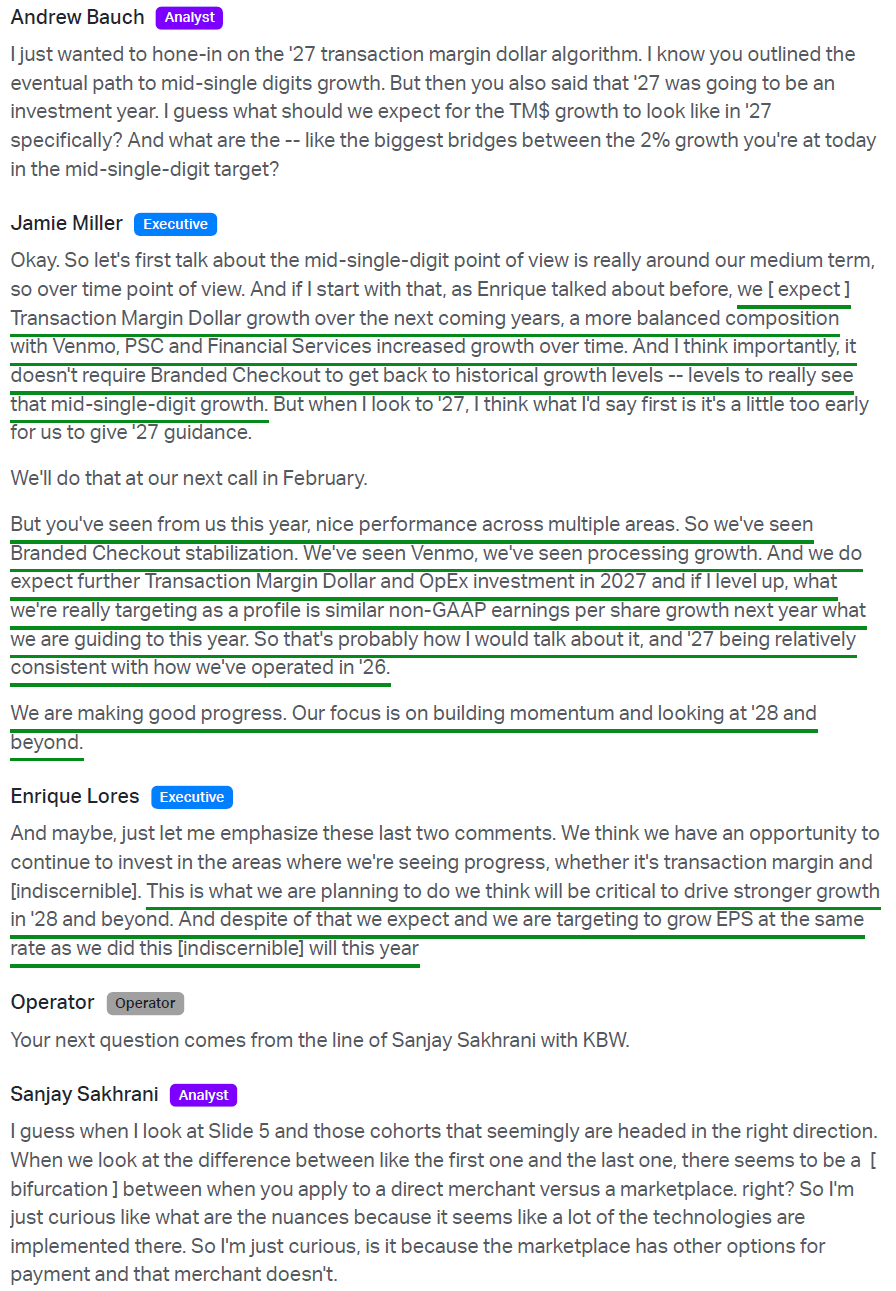
Medium-term framework: sustainable mid-single-digit TM$ growth plus operating leverage and buybacks driving solid double-digit EPS growth, without requiring branded checkout to return to historical growth rates.
Financial services, Venmo, and PSP each expected to grow double digits and contribute a significantly greater share of TM$ growth.
Stock down 82% from the 2021 peak (~$308/share) — once the poster child of pandemic-era growth stocks, now left for dead.
Management — CEO Enrique Lores
Appointed CEO effective March 1, 2026. Brings 30+ years at HP, including 6 years as CEO since 2019. Served on PayPal’s board for 5 years, including ~18 months as Chairman.
During his HP tenure: stock went from trough ~$10 to peaks of ~$37. HP consistently generated $3-4B in annual FCF and returned 100% to shareholders via dividends and buybacks. Retired 37.5% of HP’s shares outstanding since 2019.
Built a reputation as a disciplined cost optimizer. Announced major restructuring at HP (4,000-6,000 job cuts, ~10% of workforce) to save ~$1.4B through simplified structure, reduced management layers, and AI-driven automation.
Compensation heavily incentive-based: baseline bonus requires ~60% stock appreciation (~$83/share); maximum payout requires 150%+ increase and stock at $125+.
On the portfolio: “At this point, I believe that the best approach is to invest in our 3 core businesses, PayPal, Venmo, and Braintree, to drive profitable growth.”
Lores added that there are “significant synergies across the three businesses that make them stronger together.”
Cost Savings Plan
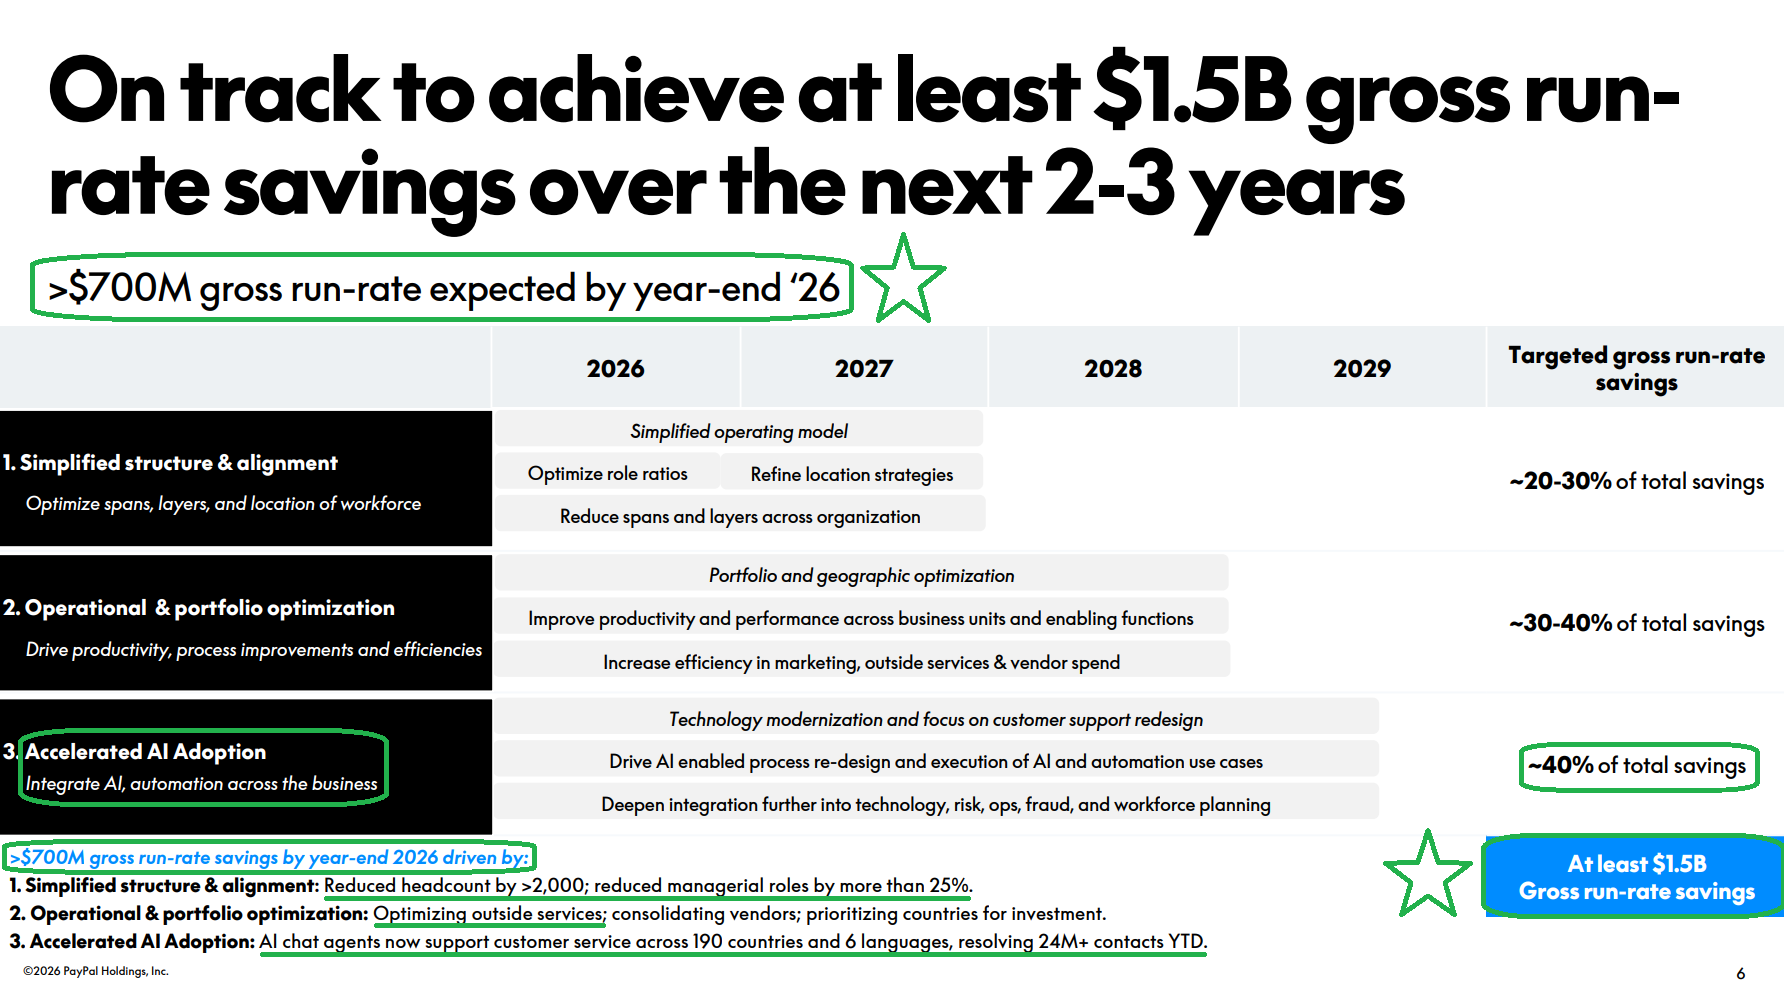
New $1.5B+ gross run-rate savings program, to be executed over the next 2-3 years in three phases: structural simplification and alignment (removing duplication, spans, and layers); operational and portfolio optimization; and accelerated AI/automation deployment across operations.
Moving faster than planned: year-end exit run-rate target raised to >$700M (from ~$400M identified last quarter).
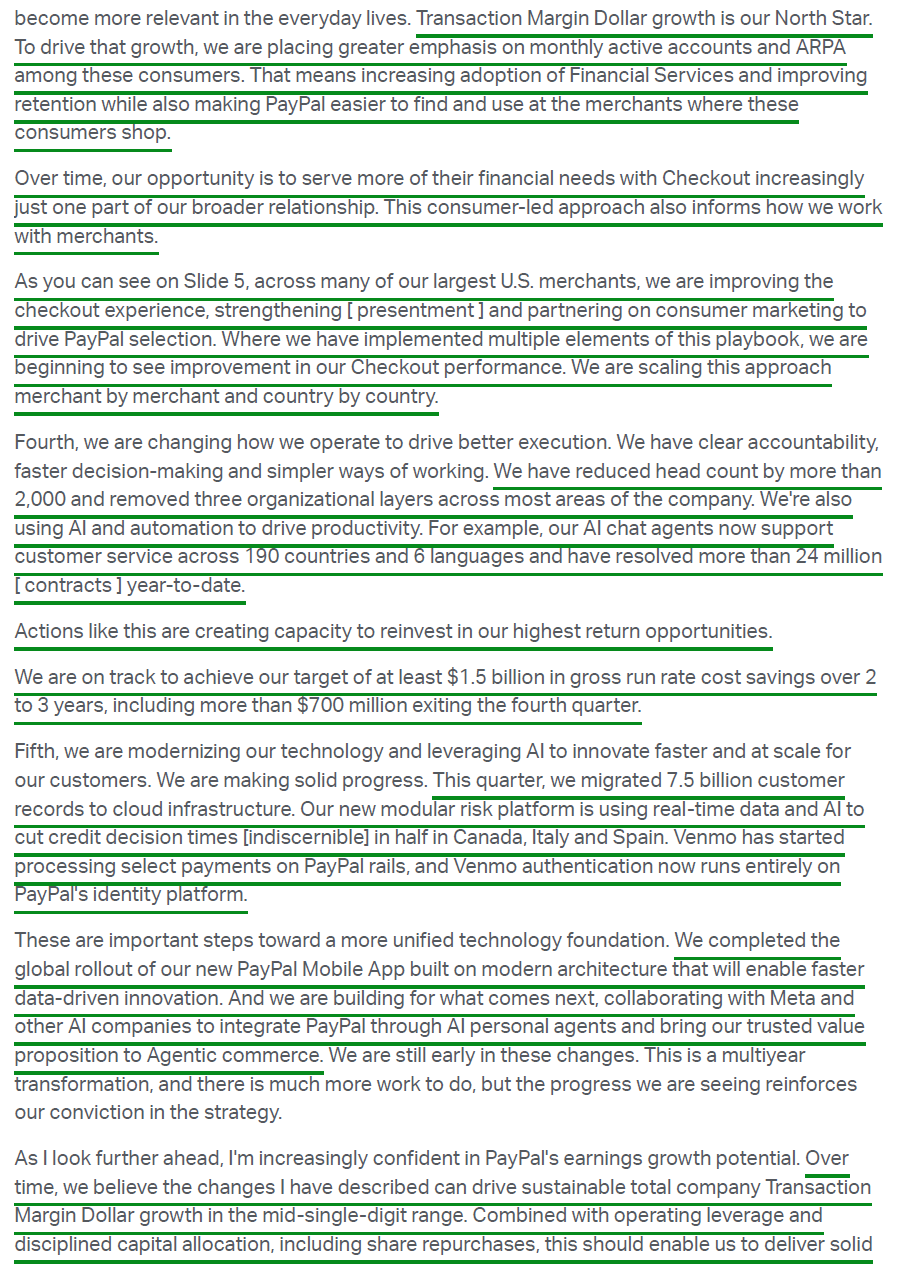
Headcount down >2,000 (~8%), managerial roles down >25%, and three organizational layers removed across most of the company.
AI-assisted coding has already cut implementation time by 25%; AI chat agents now support customer service across 190 countries and 6 languages, resolving 24M+ contacts YTD.
Savings mix: ~20-30% structural simplification, ~30-40% operational and portfolio optimization, ~40% accelerated AI adoption (~$600M).
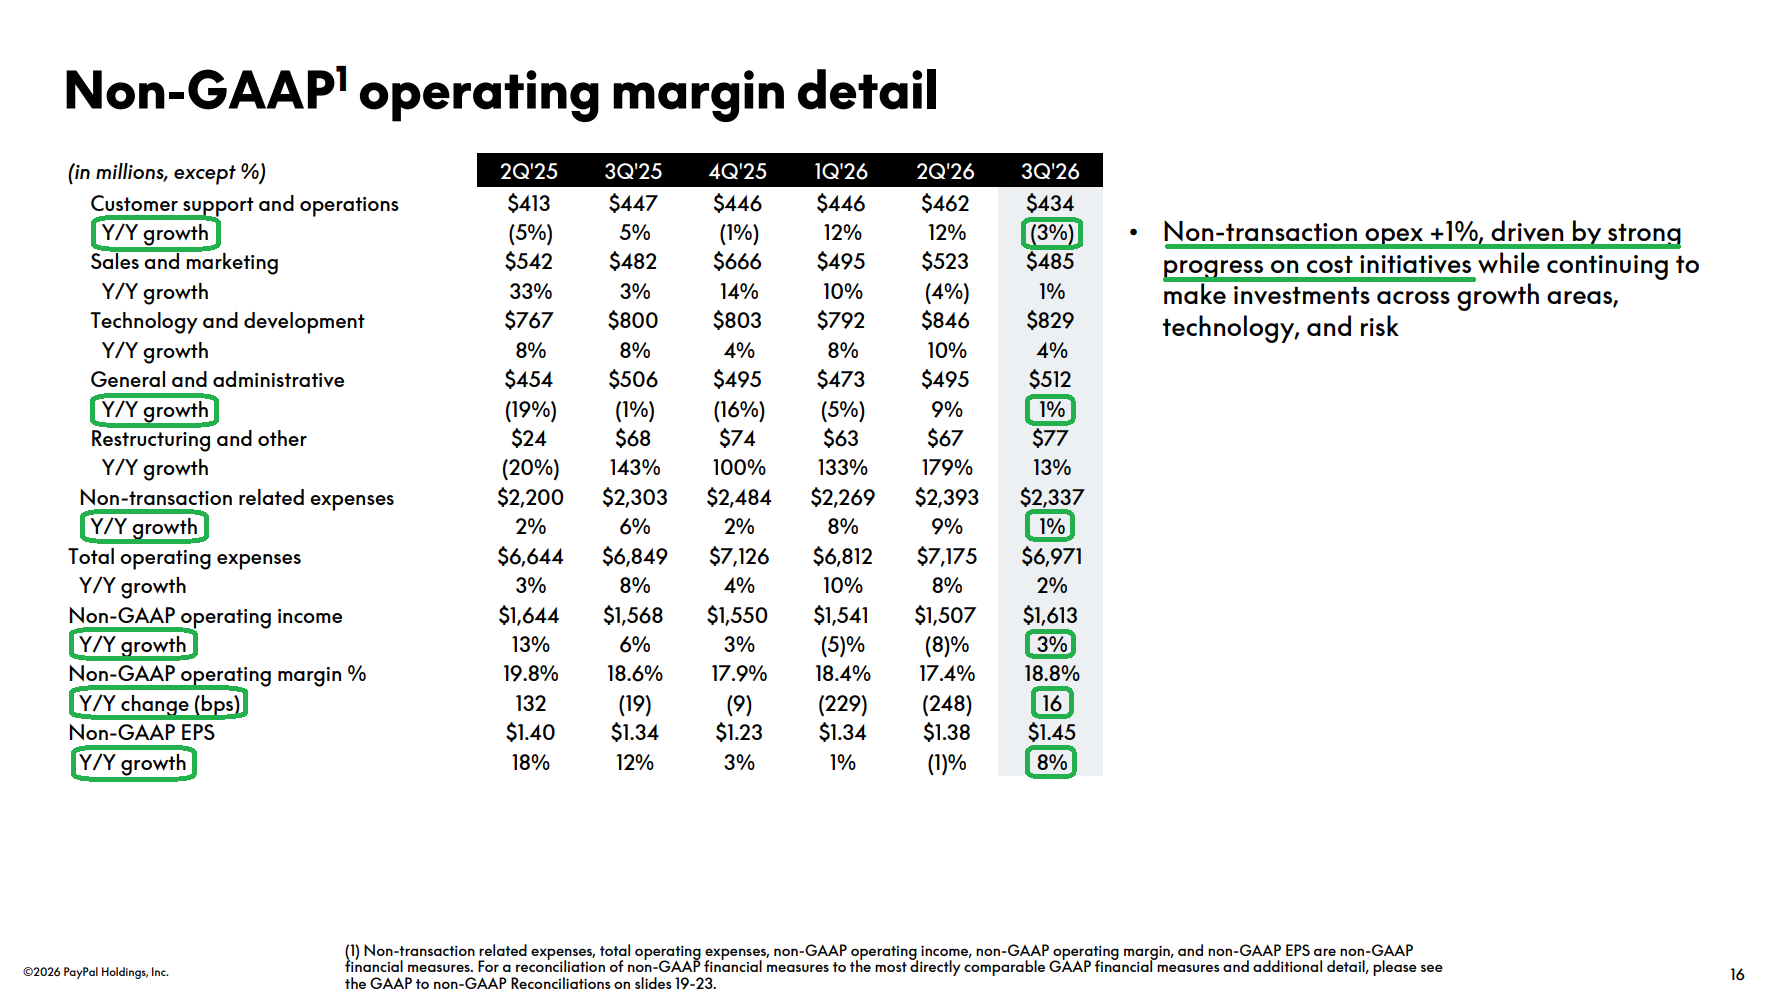
Q3 non-transaction opex grew just 1% to $2.34B (vs. ~$2.42B Street). FY26 non-transaction opex growth outlook lowered to mid-single digits from 7-8%.
With FY25 non-transaction operating expenses sitting at $9.1B, there’s plenty of low-hanging fruit. Reports point to a ~20% workforce reduction (~4,760 of 23,800 employees).
Savings will be reinvested in tech modernization, branded checkout, Venmo, and consumer financial services. Segment-level reporting expected sometime next year.
FCF, Buybacks & Dividend
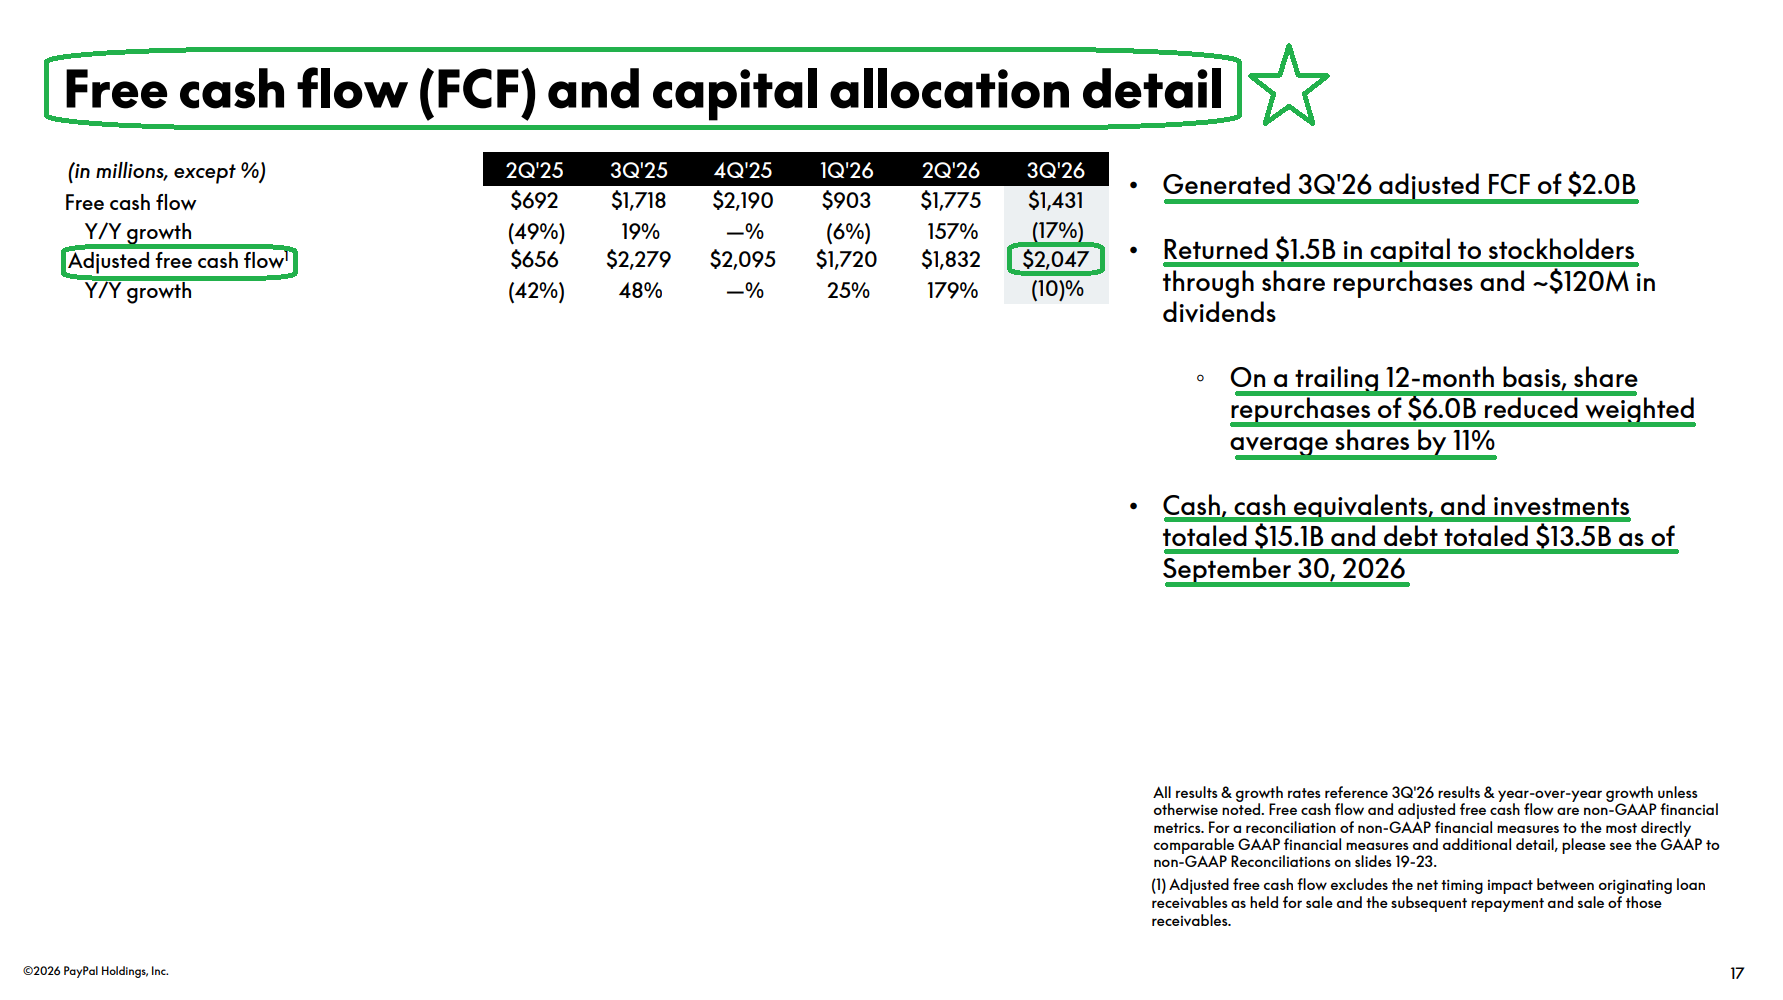
Q3 adjusted FCF of $2.05B (-10% Y/Y against a strong prior-year comparison), bringing TTM to ~$7.7B and YTD to ~$5.6B. FY26 guide raised to $6.5B+ adjusted FCF (from $6B+, vs. ~$5.84B consensus) — ~14% FCF yield at current prices. Cash machine with 100%+ FCF conversion and growing in line with net income.
Policy: distribute 70-80% of FCF annually to shareholders. Q3 buybacks of $1.5B (~28M shares at ~$54), with ~$120M in dividends. TTM repurchases of $6.0B (~117M shares), reducing weighted average diluted shares -11% Y/Y.
Shares outstanding down to 837M from 920M at year-end 2025.
FY26 guide reiterated at ~$6B in buybacks, equivalent to ~12.8% of the current market cap.
Total shareholder yield ~13.8% (buyback + dividend).
Share count down 27.2% over the past 5 years. Currently trading at the same price as 2017 despite $37.7B+ deployed in buybacks since.
$15.1B cash, equivalents, and investments on balance sheet against $13.5B of debt.
Quarterly cash dividend ($0.14/share); ~1.0% annual yield.
Ads
430M+ users generate 20 trillion trackable customer interactions — a data gold mine. PayPal knows what you actually bought (product, price, size), not just what you searched for.
Hired Mark Grether (May 2024) to build the ads business from scratch. Previously built Amazon’s ad business ($68.6B/year in 2025) and Uber’s ad business (from ~$141M in 2021 to >$2B in 2025).
Ad business typically commands 80%+ margins vs. PayPal’s current ~45% transaction margins.
If PayPal captures just $3-4 in annual ad revenue per user (vs. Uber’s ~$9.6), that equates to $1.2-1.6B in high-margin incremental revenue.
Venmo
Q3 TPV +14% Y/Y to a record $96.81B (vs. ~11% Street), the eighth consecutive quarter of double-digit growth and a third straight quarter of mid-teens growth. Pay with Venmo TPV +43%.
$1.7B in revenue in 2025 (+20% Y/Y). On track to surpass its original $2B 2027 revenue target well ahead of schedule.
100M+ active accounts; 67M monthly active users growing +7% Y/Y.
ARPA growing double digits; current ARPA >$25 — still only 20-25% of estimated long-term potential. Management sees a 4-5x ARPA opportunity vs. peers, with ARPA becoming one of the company’s key metrics going forward.
Only 23% of Venmo customers currently use its financial services. Debit card users generate 5-6x the ARPA of P2P-only users.
Customers using both Venmo debit and Pay with Venmo generate more than 9x the ARPA of P2P-only users, with that cohort nearly doubling Y/Y in Q3. 64% of Venmo users are mid-to-high income (vs. 62% Apple Pay, 40% Cash App).
Venmo debit card monthly active accounts +55% to 6.7M, with a record 1.6M first-time users in Q3 and newer cohorts activating the card faster than ever (6x transaction frequency and 3x ARPA for debit card users). App rebuilt in Q2 to improve personalization and product discovery, with a 4x acceleration in feature development (1H’26 vs. 1H’25).
Relaunched the Venmo credit card with split-purchase rewards, added receipt scanning and splitting for P2P, and broadened Pay with Venmo acceptance into travel, college tuition, and prediction markets.
Launched co-branded debit cards with Big Ten and Big 12; NIL revenue share payouts now processed via PayPal/Venmo.
Management called Venmo a key component of the go-forward growth plan, with focus on ARPA expansion through deeper attachment of financial services (debit, credit, savings, investing). “Venmo will be a key component of our growth plans moving forward.” Expects double-digit TPV growth to continue in the coming years.
Still U.S.-only — international expansion represents a significant untapped long-term opportunity. Venmo is a verb across the U.S.; finally being monetized properly and in very early innings.
Branded Checkout
Represents ~27% of TPV but contributes 50%+ of profit dollars — highest-margin business. PayPal converts transactions at ~90% vs. the industry average of ~50%.
84% branded checkout presence across top 100 U.S. e-commerce merchants and marketplaces.
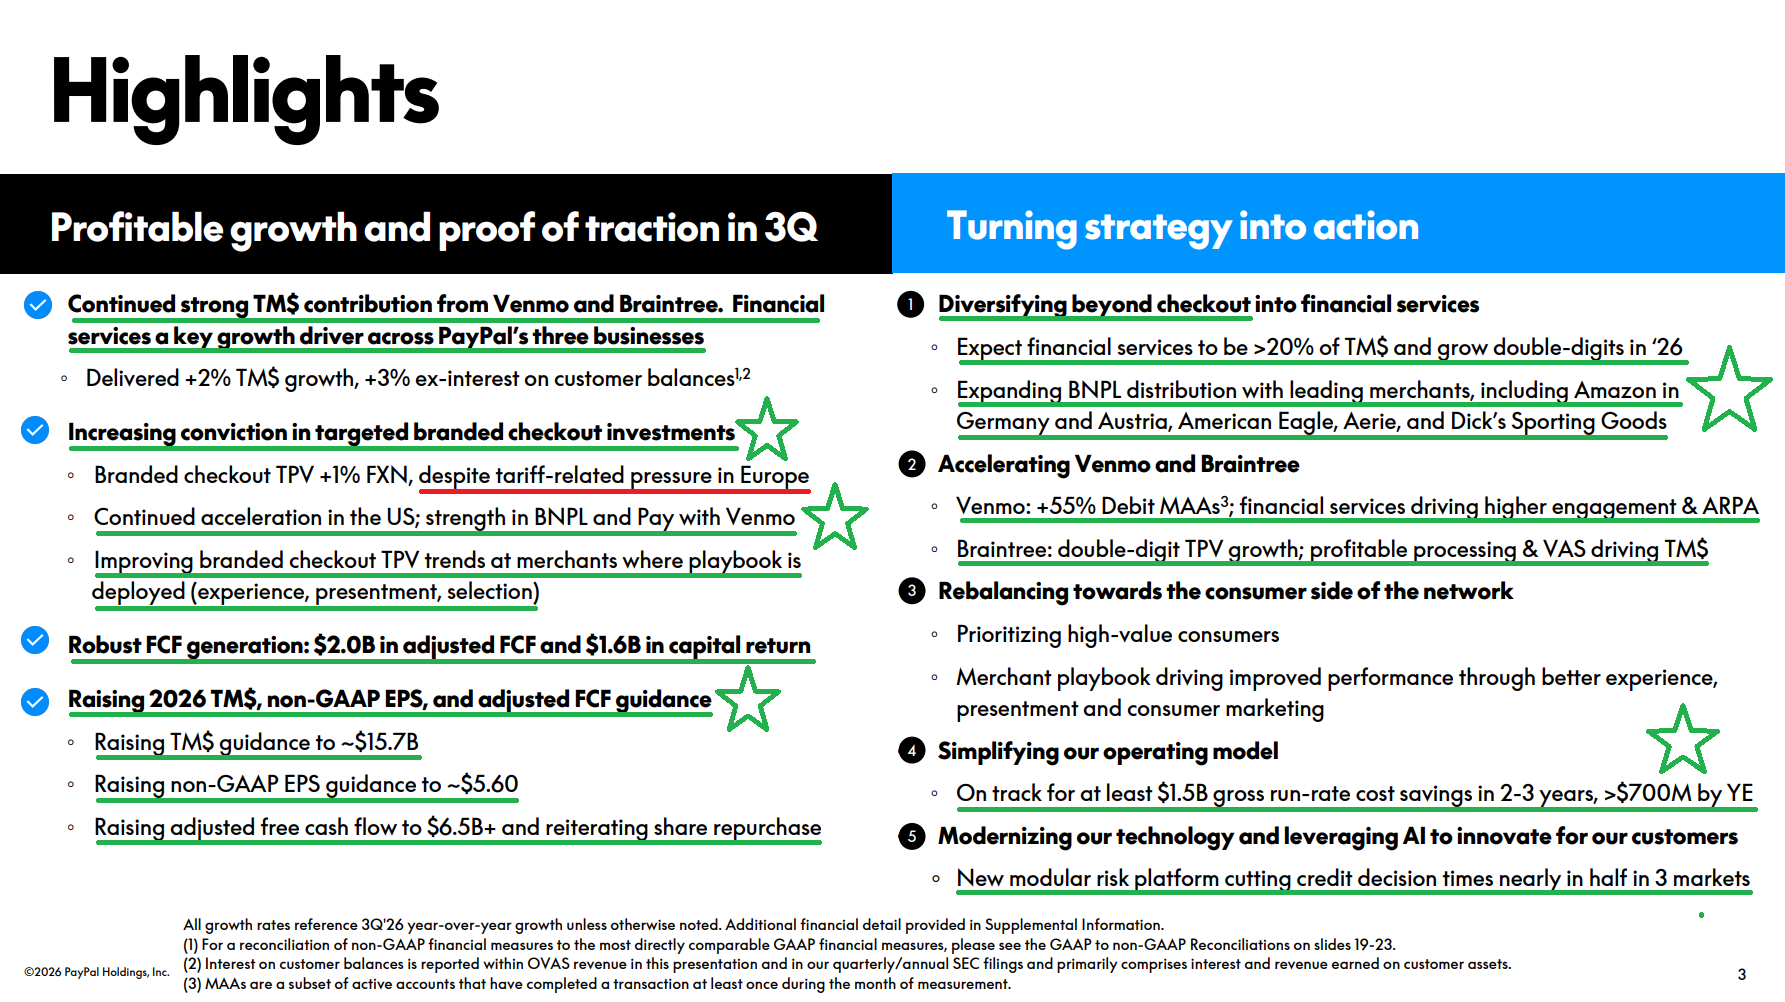
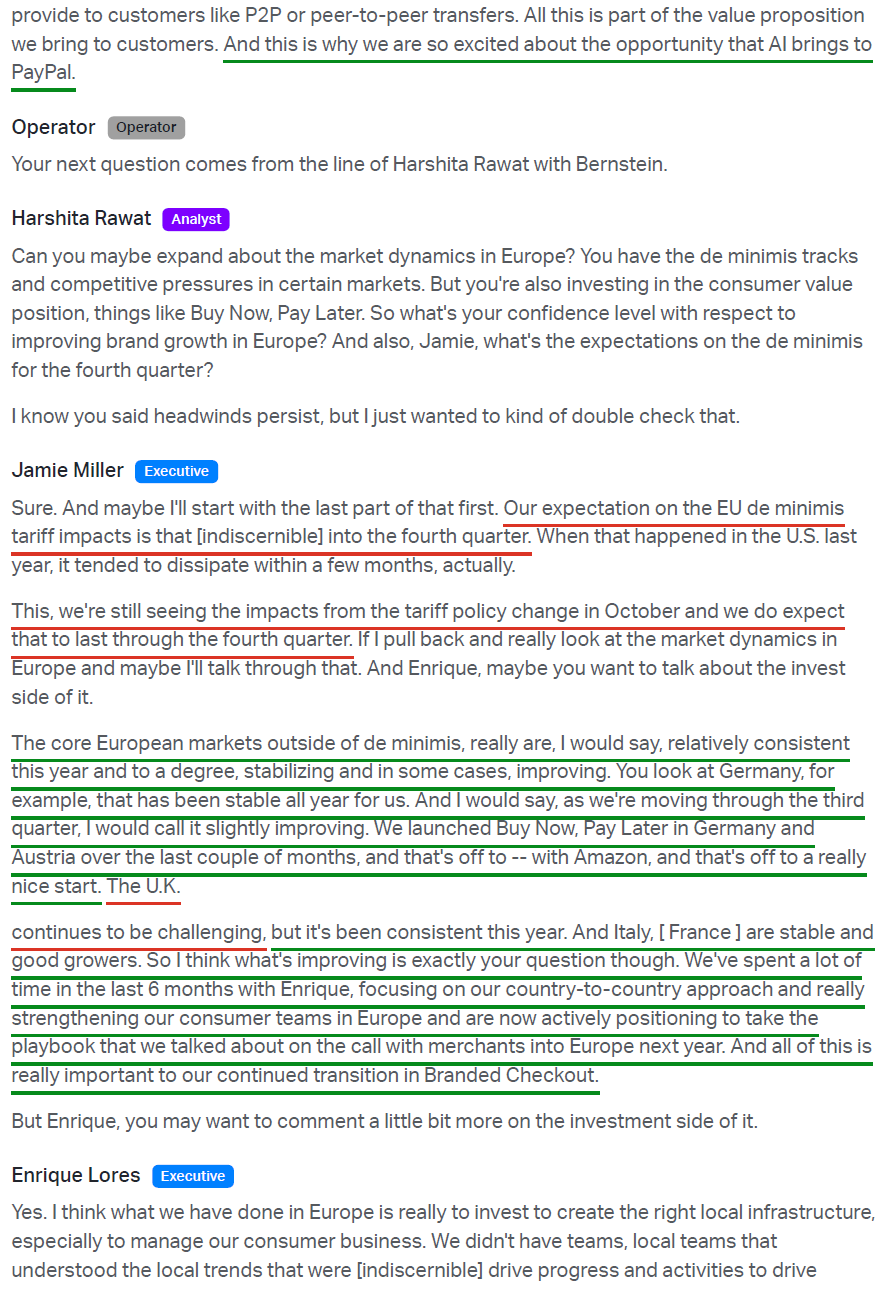
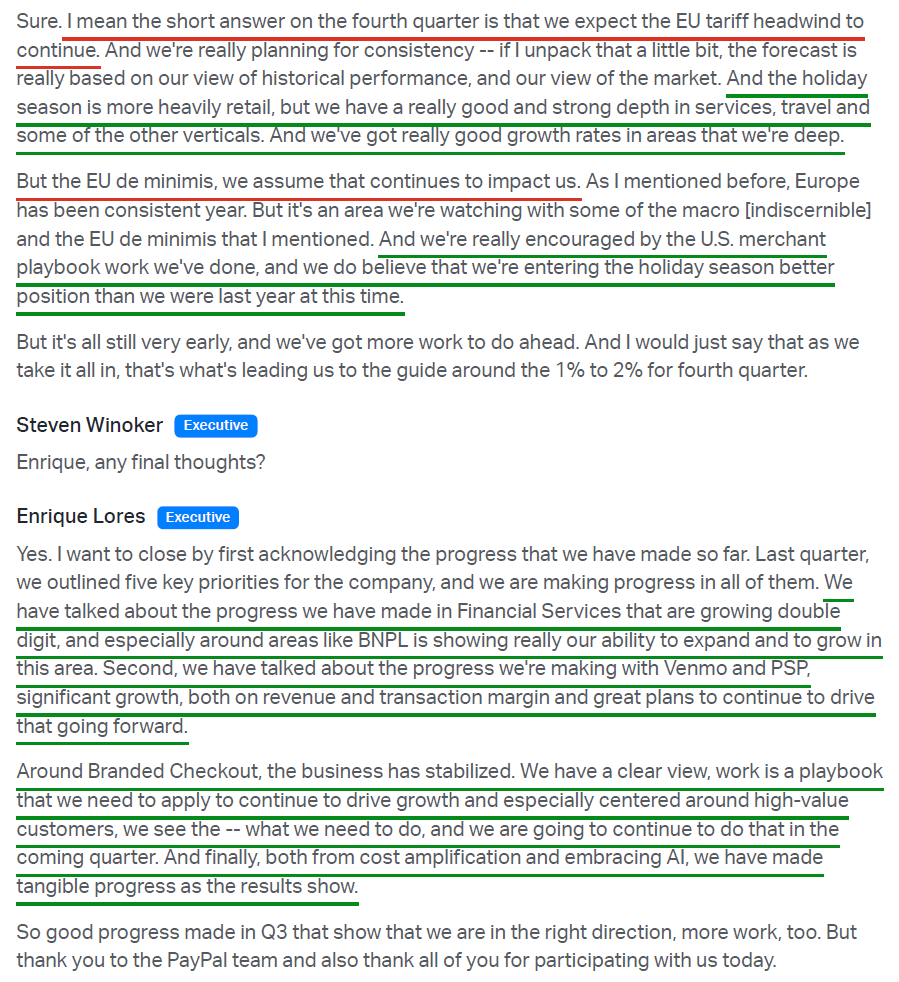
Q3 branded checkout TPV +1% FXN (vs. ~2% Street), holding in the 1-2% range for a fourth consecutive quarter. Removal of the EU de minimis exemption created ~70 bps of headwind, offsetting a third straight quarter of U.S. improvement and continued strength in BNPL and Pay with Venmo.
Branded experiences TPV (online checkout, PayPal/Venmo debit, tap-to-pay) +6% FXN, with U.S. debit TPV +60%+ Y/Y.
Full-year branded checkout outlook reiterated at low-single-digit growth, with Q4 expected at 1-2% as European headwinds persist.
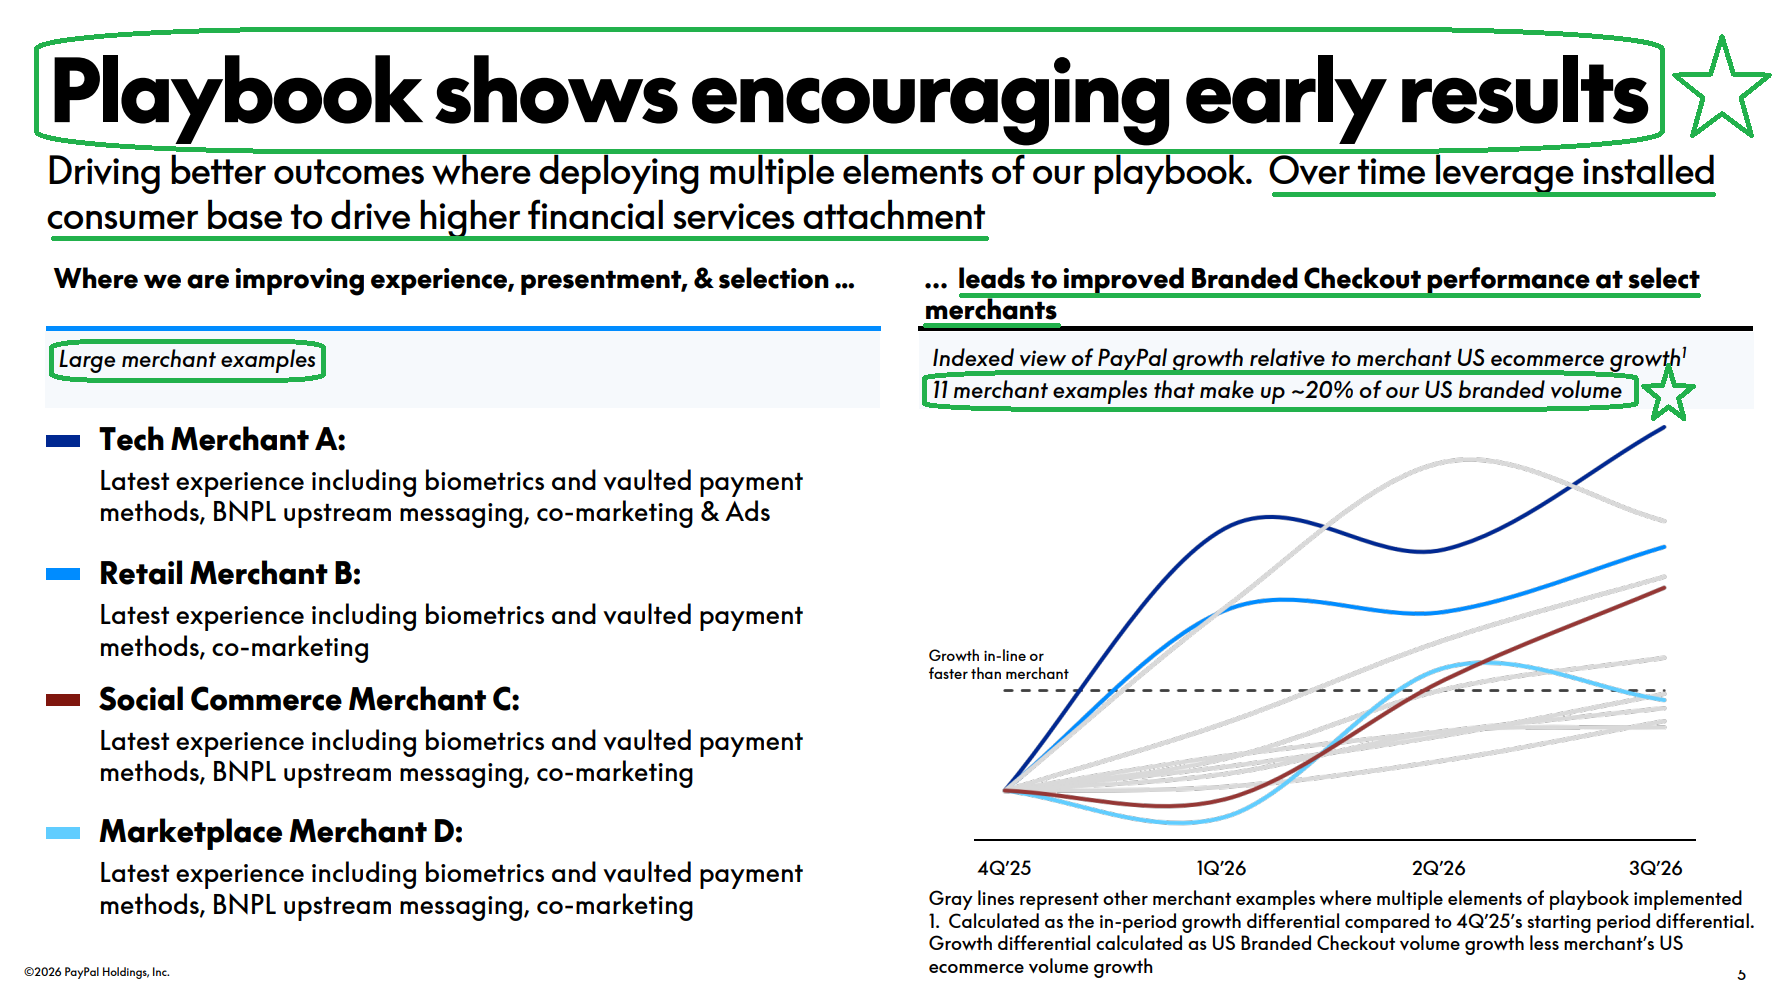
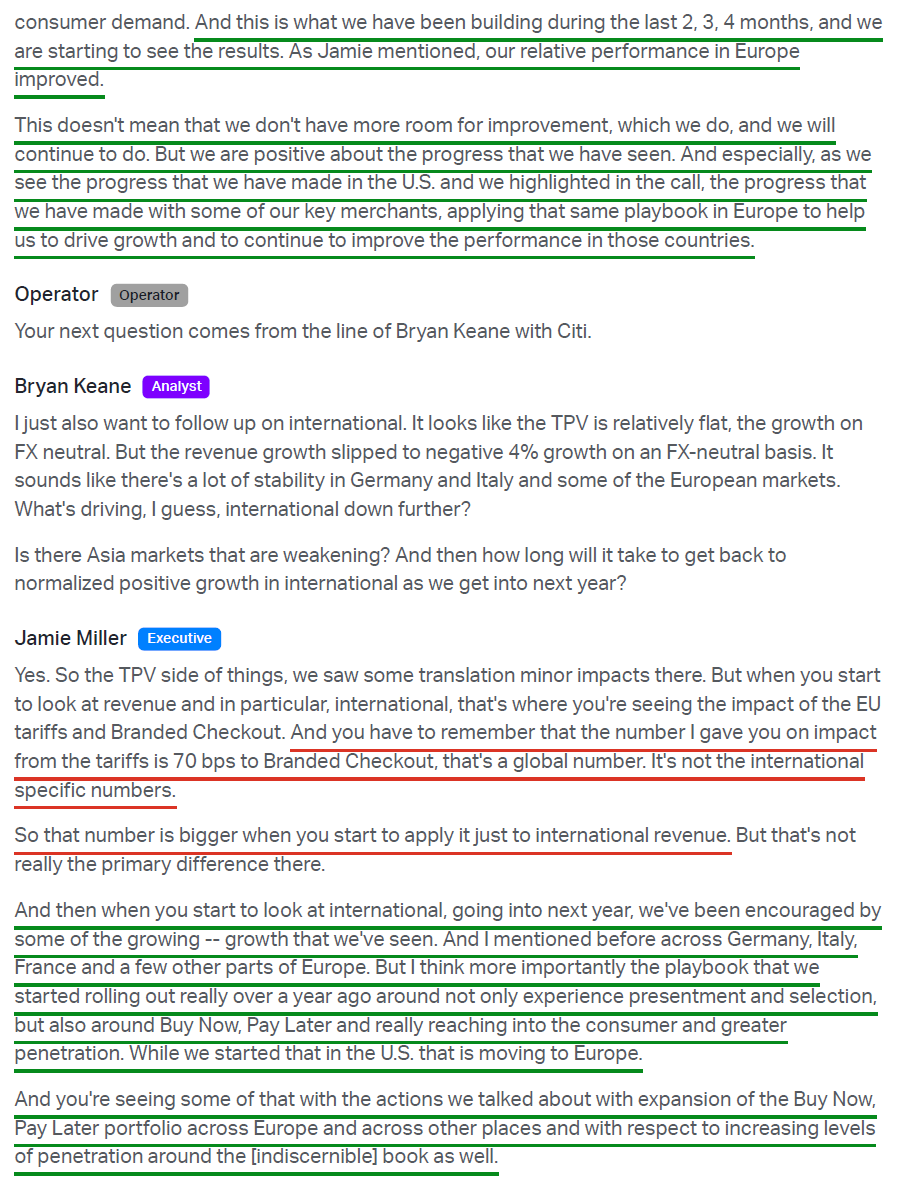
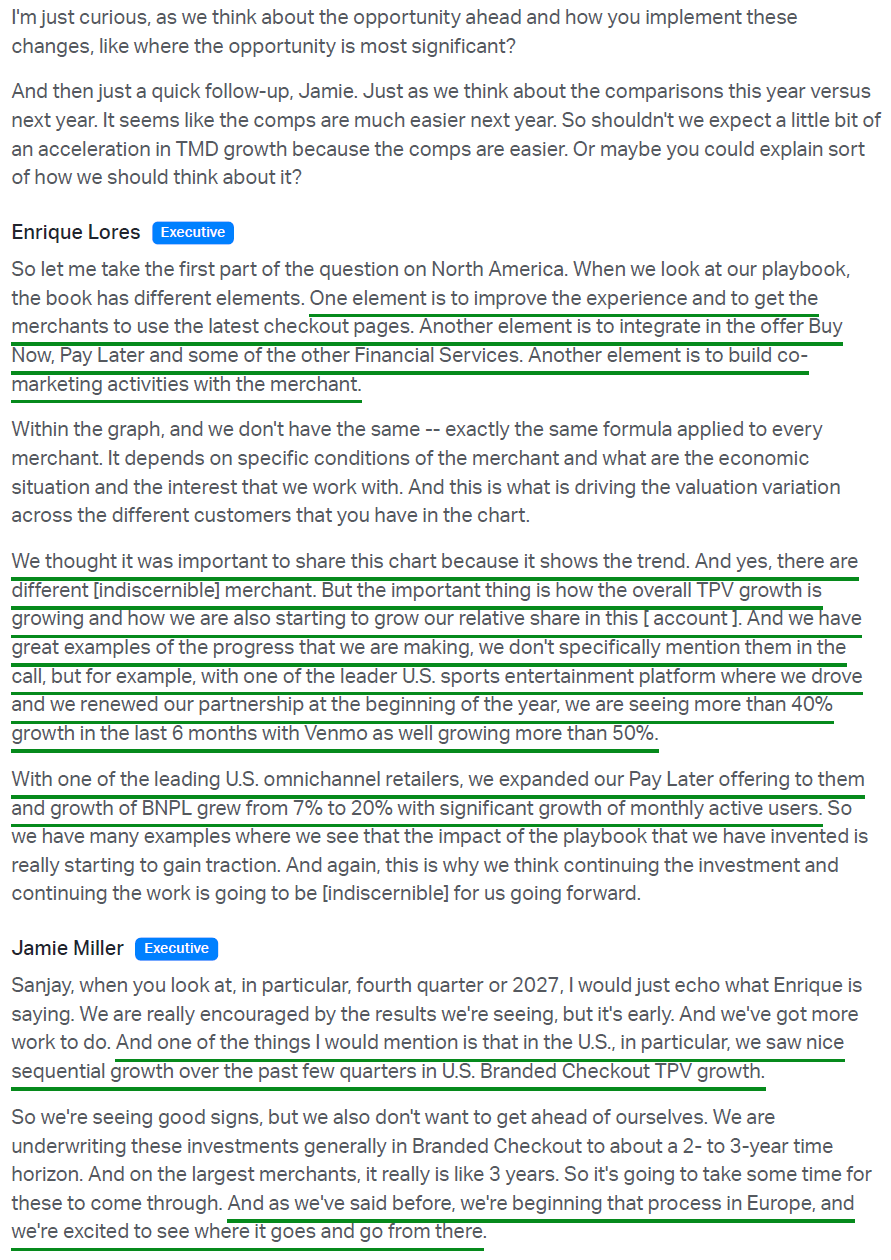
Merchant playbook (updated checkout pages, biometrics, vaulted payment methods, upstream BNPL messaging, co-marketing) improving relative share across 11 large merchants representing ~20% of U.S. branded volume.
Plans to scale the playbook across more U.S. merchants and into Europe in 2027.
The biggest undertaking of former CEO Alex Chriss’s tenure was the overhaul of legacy branded checkout. Untangling a decade of legacy integrations proved complex and rolled out slower than planned.
New branded checkout experience rolling out — ~60% of merchants now on the new payment pages. Goal: >80% of global transactions by 2027 (vs. ~30% in early 2025).
Fastlane boosts merchant conversion rates by 51% and improves checkout speed by 36%. Once scaled, Fastlane positions PayPal to capture pricing power over essentially the entire guest checkout market (~40% of global e-commerce).
Agentic Commerce & AI Partnerships
Positioned as the default payment infrastructure for AI-driven commerce. First digital wallet integrated into ChatGPT (700M+ weekly users) — PayPal’s 36M merchants can now sell directly within the chat interface.
Microsoft Copilot integration (launched January 2026): Windows and Office users can shop via Copilot with PayPal handling checkout in the background. Additional partnerships with Perplexity AI and Google Gemini.
Multi-year partnership with Google: PayPal Enterprise Payments becomes a key payment provider across Google Cloud, Google Ads, and Google Play.
PayPal World now facilitating ~$200M in TPV between Venmo and PayPal.
PayPal USD (PYUSD) became the largest federally regulated stablecoin in December 2025; recently expanded to 70 markets globally.
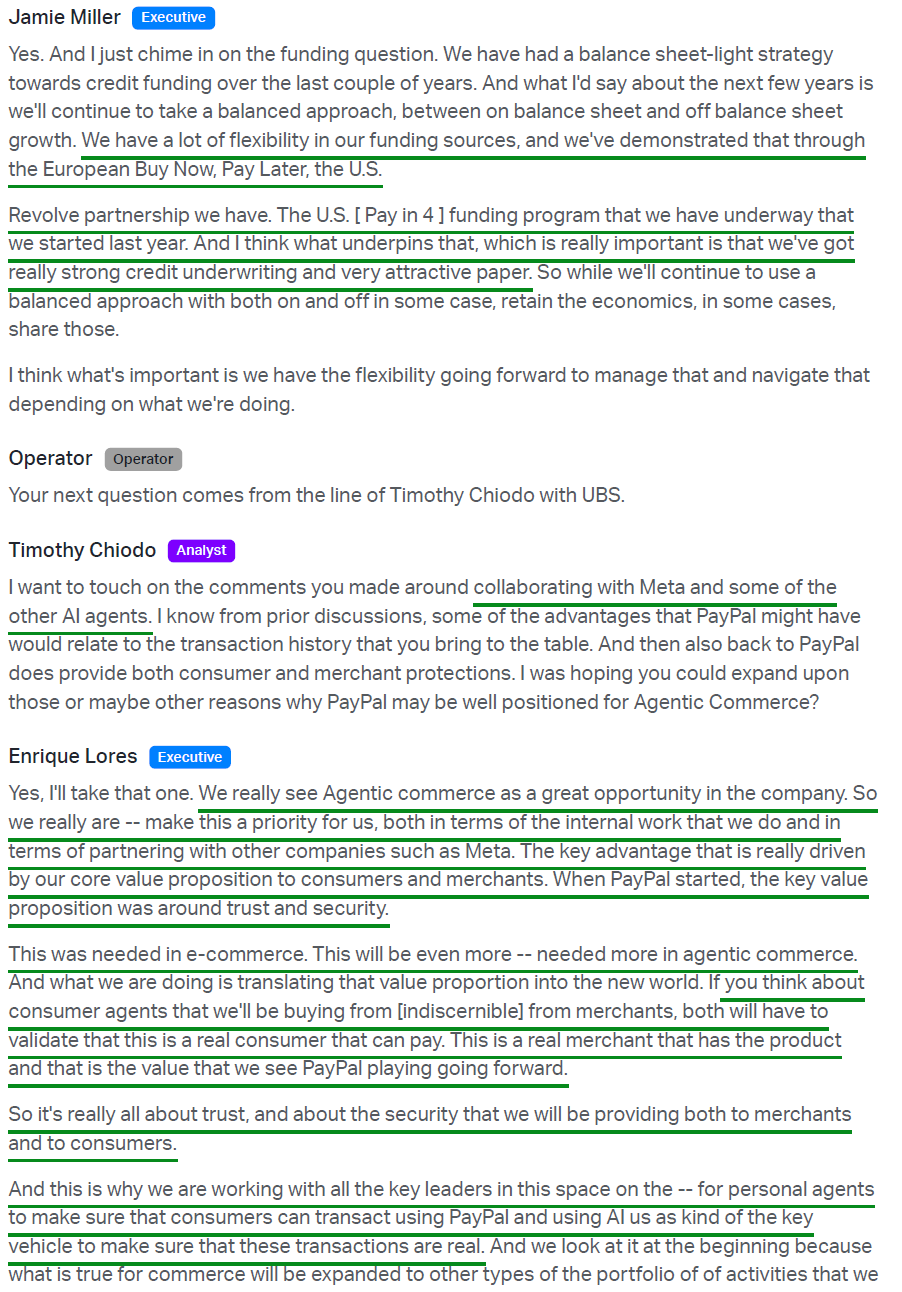
Partnered with Meta to enable checkout via Muse personal AI agents across PayPal merchants worldwide (Muse hit No. 1 on Apple’s App Store 10 days after launch)
No meaningful sales volumes expected from agentic commerce until 2028
AI accelerating tech stack modernization, with work that previously took three to four years now achievable in the next 18 months
Buy Now, Pay Later
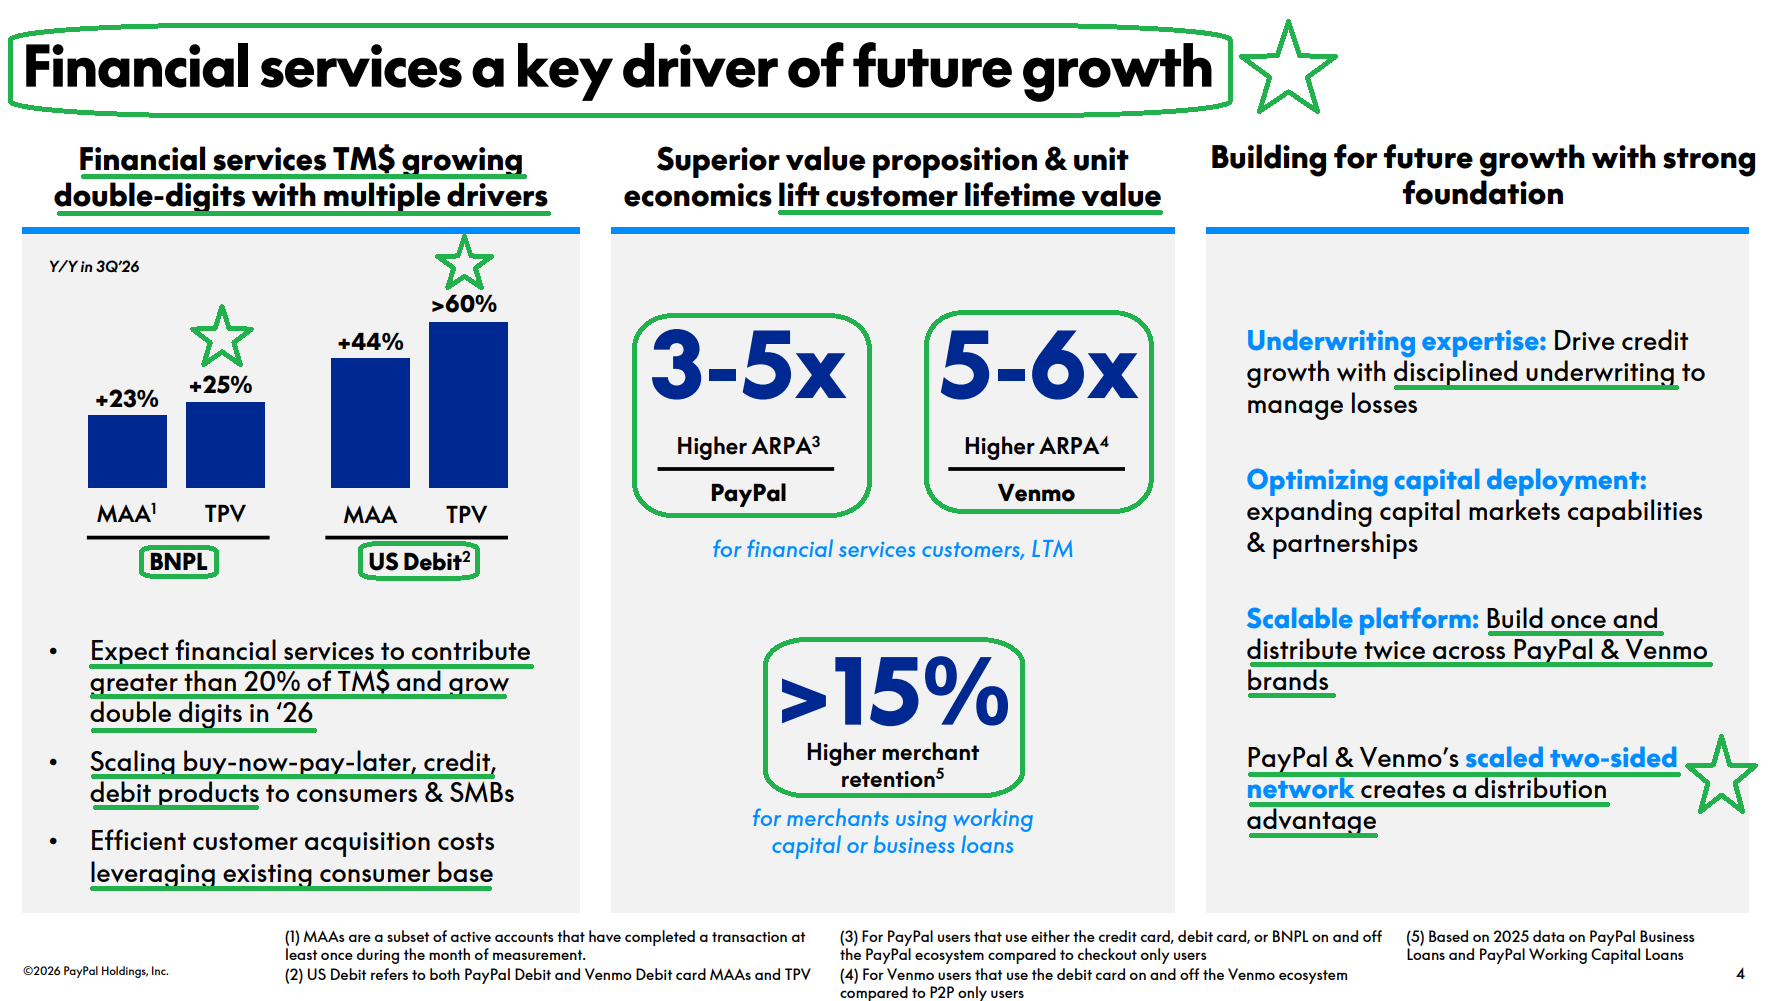
Q3 BNPL TPV +25% (vs. +26% in Q2), with BNPL MAAs +23% and continued share gains, outpacing the market. BNPL TPV exceeded $40B in 2025 — growing 23% Y/Y, outpacing the broader BNPL market.
Expanding distribution and presentment: Temu launched BNPL in Canada (now 8 markets globally) and Home Depot Canada added upstream presentment. Q3 additions include American Eagle, Aerie, and Dick’s Sporting Goods.
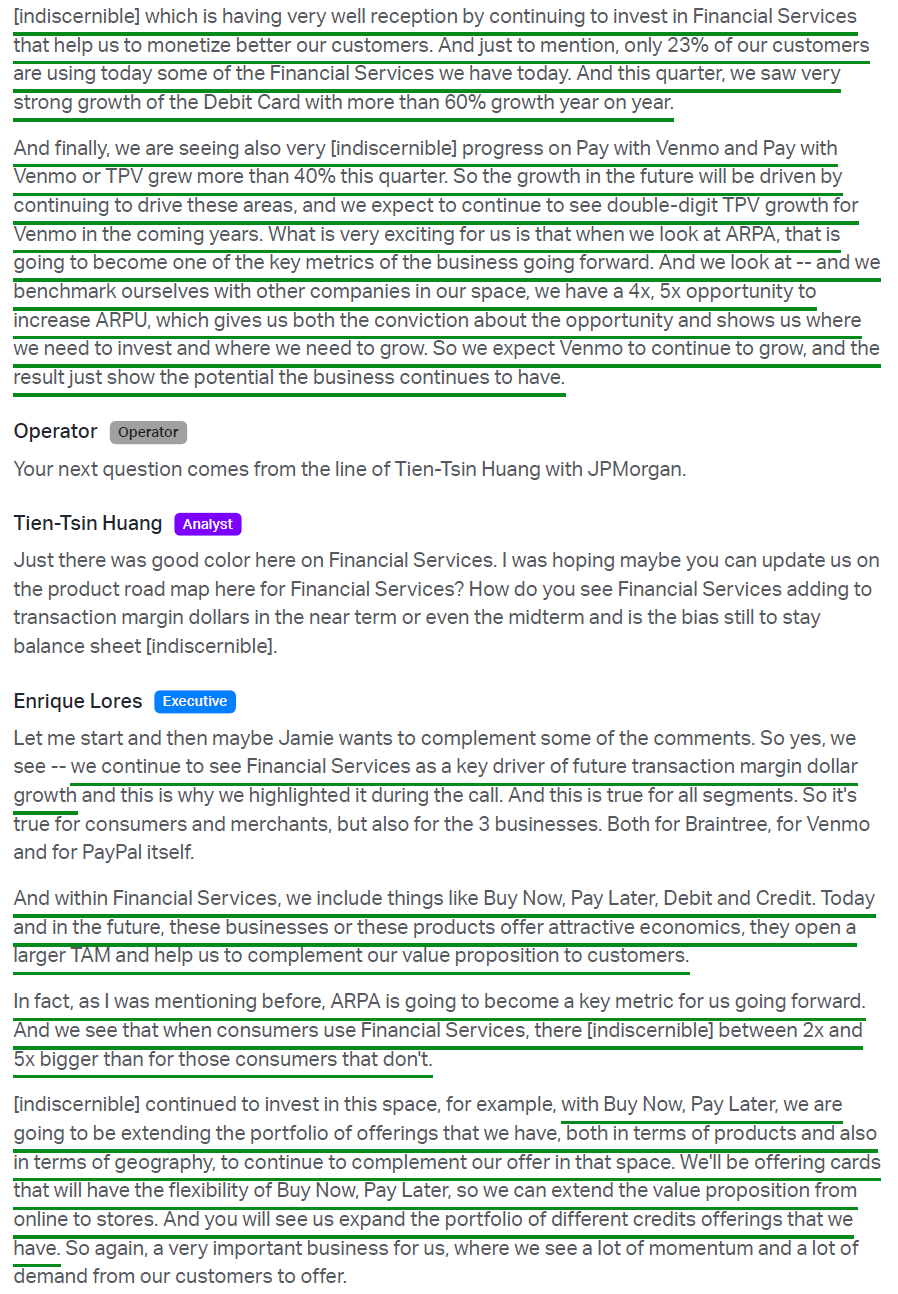
Financial services (BNPL, credit, debit, merchant lending) expected to exceed 20% of transaction margin dollars in 2026 while growing double digits. Customers using financial services generate 2-5x the ARPA of those who don’t.
Integrated consumer lending partnership with Amazon in Germany and Austria now launched and off to a strong start.
Roadmap: broader BNPL products and geographies, cards with built-in BNPL flexibility to extend from online to in-store, and an expanded credit portfolio.
BNPL users transact ~5x more often than standard checkout customers, with average order value 80%+ higher than a standard checkout transaction.
Economics on par with or better than pure-play BNPL peers.
BNPL is becoming a core part of holiday spending: 55% of consumers have used or considered BNPL, and 75% of those consumers plan to use or are considering using BNPL for holiday shopping.
NRF forecasts November and December retail sales up 4.2% Y/Y to $1.013T, the fastest growth since 2021 (+12.6%); compares with 2025 holiday sales up 3.1% to $972B
Enterprise Payments (Braintree)
PayPal’s enterprise PSP powering payments for Uber, Airbnb, DoorDash, Target, and others.
Q3 PSP volume +8% (from +13% in Q2), with Braintree +10% and the segment holding at ~45% of total TPV.
Previously weighed down by an intentional exit from unprofitable, low-margin volume — a 5-6% revenue headwind that fed the slowing growth narrative.
That headwind is now fully lapped, with growth driven by profitable front book wins, high retention, and expansion alongside existing merchants. Management’s focus is profitable growth, not simply volume.
Now contributing meaningfully to TM$ growth following the multi-quarter reset; net processing yield nearly doubled Y/Y. Validates management’s price-to-value strategy — winning volume even after repricing contracts to be more profitable.
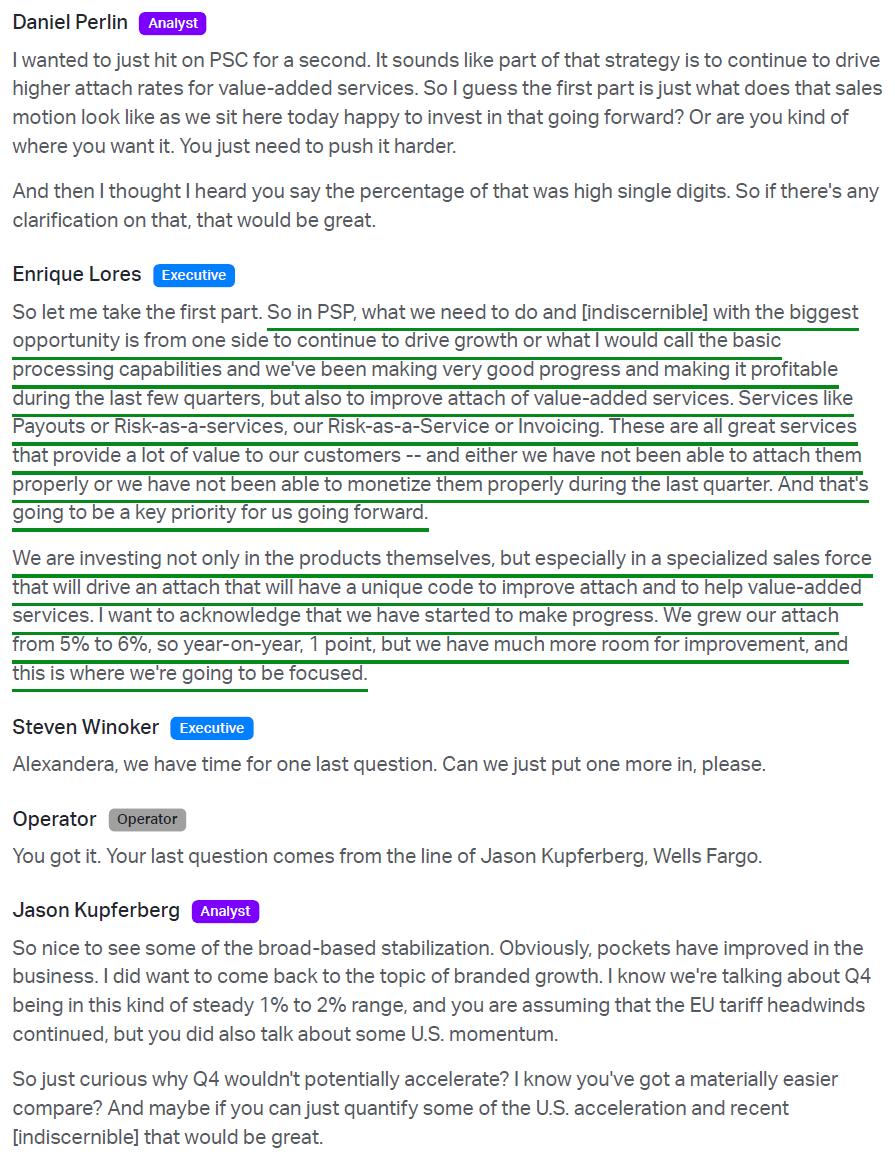
Focus now on lifting attachment of value-added services (payouts, risk as a service, invoicing, merchant lending) and unifying Braintree, PayPal Complete Payments, and Hyperwallet onto a single modernized platform.
Attach rate rose to 6% from 5% a year ago, with a specialized sales force now being built to drive it.
Key Financials & Valuation
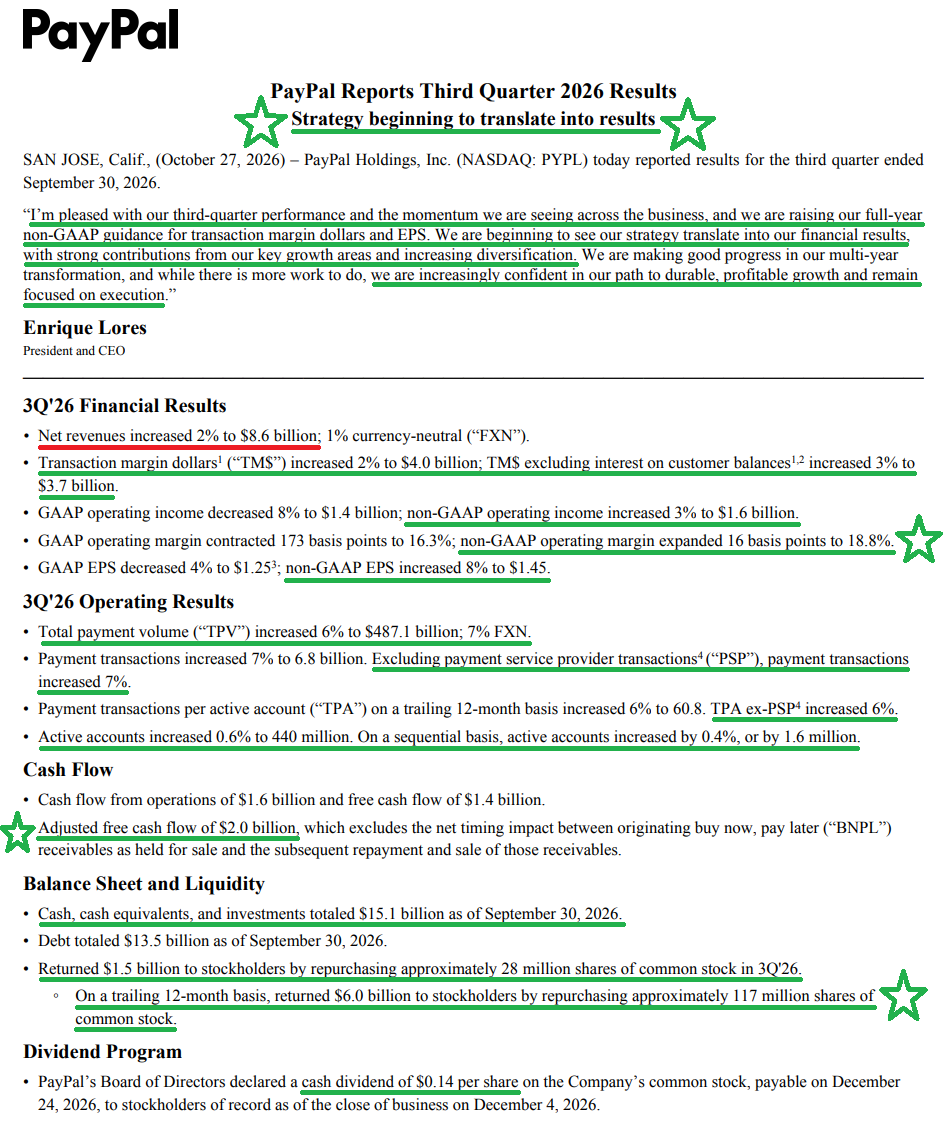
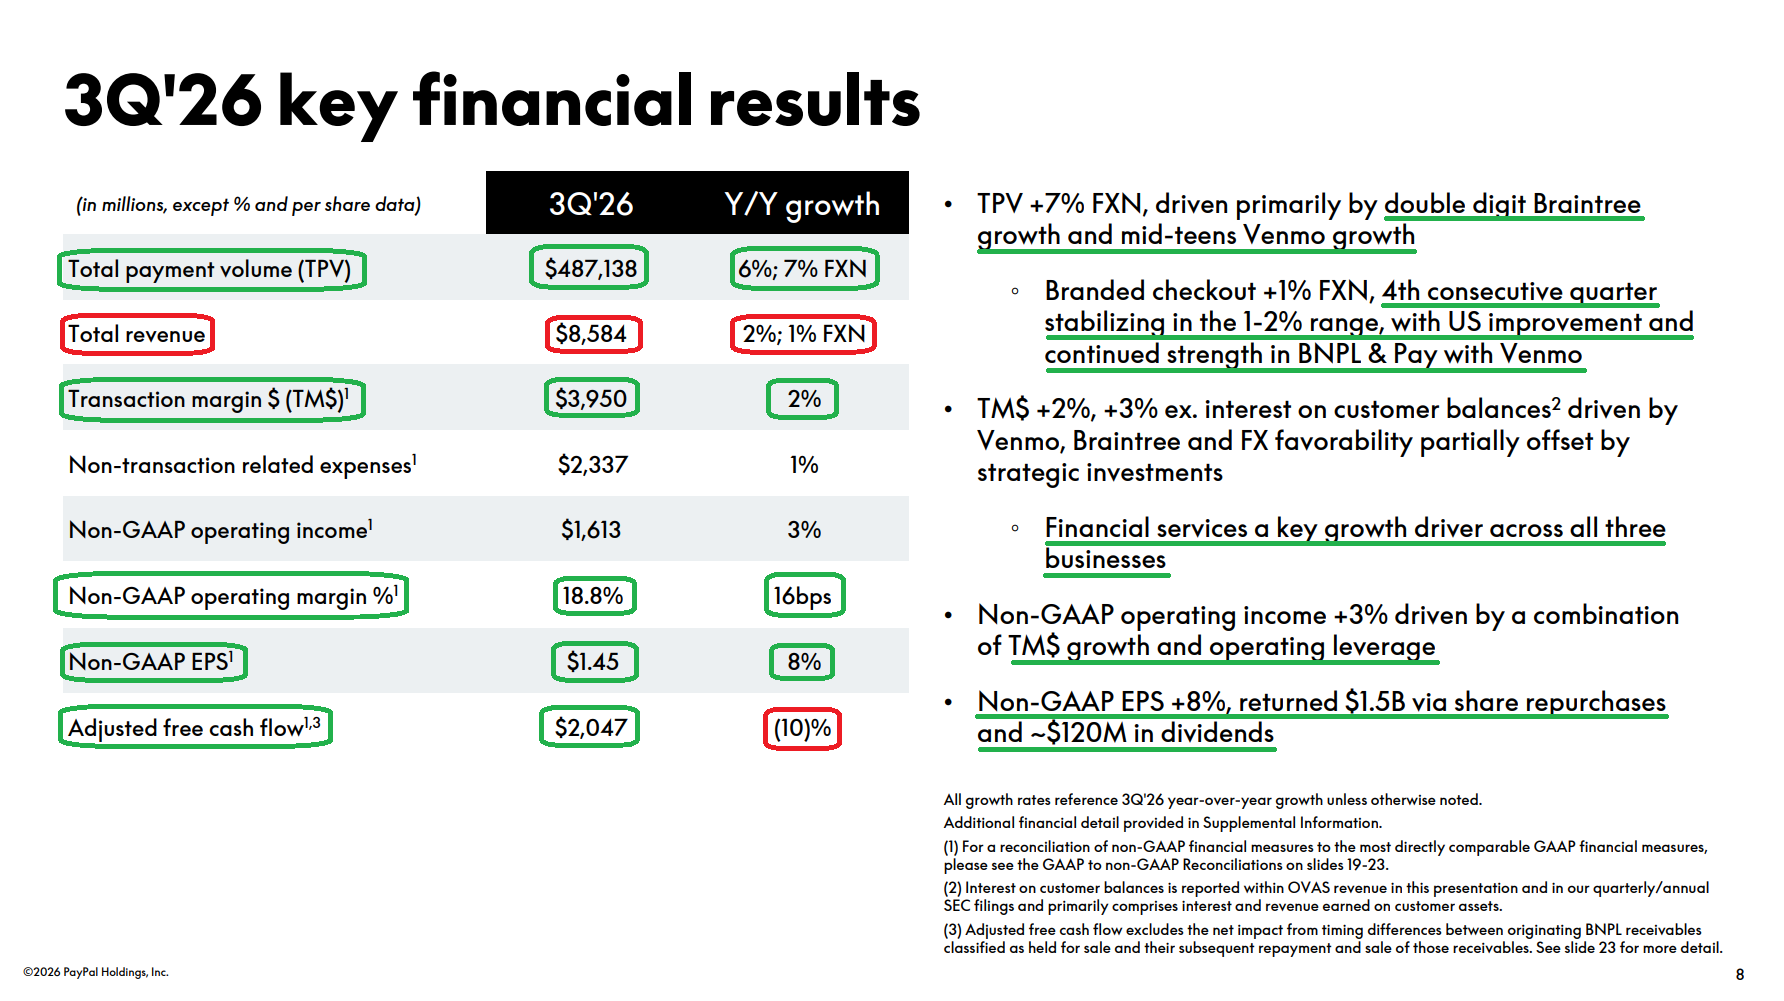
Q3 revenue $8.58B (+2% Y/Y, +1% FXN), missing consensus ~$8.71B by ~$126M.
U.S. revenue grew 5% to $5.00B; international revenue down 2% reported (-4% FXN) to $3.58B.
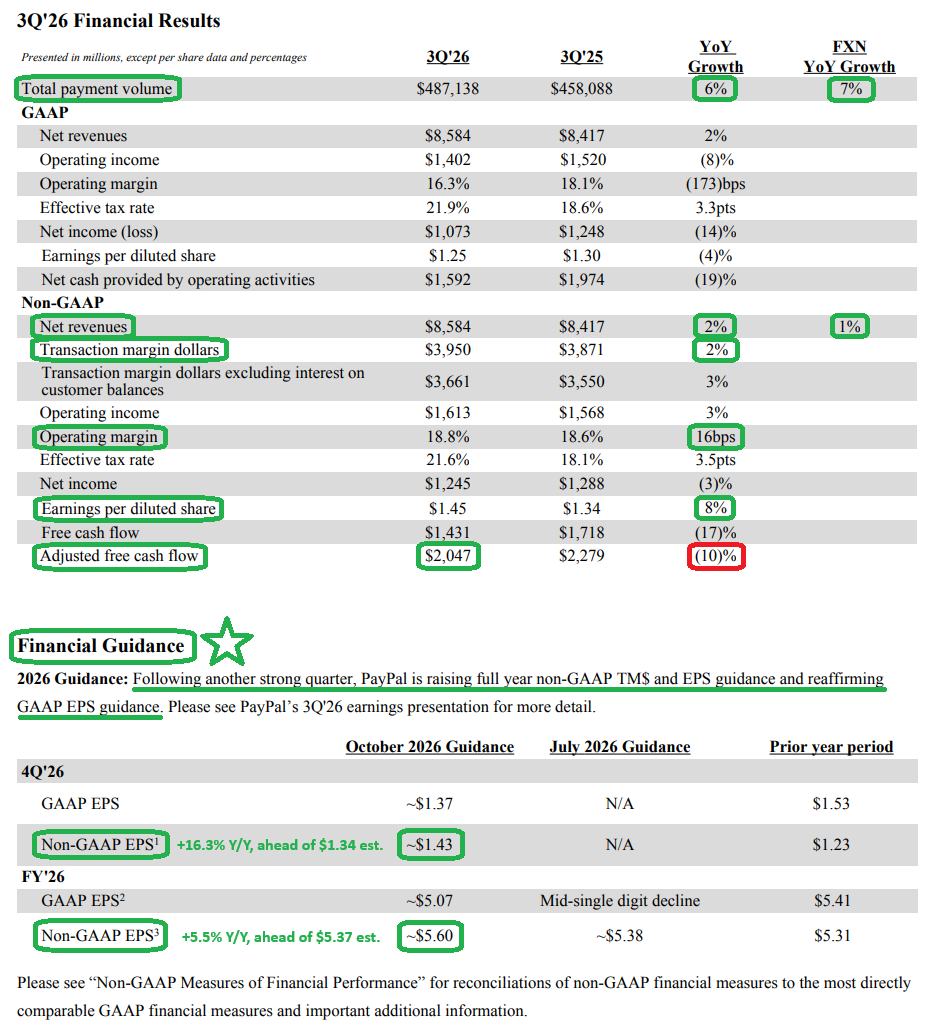
Q3 adjusted EPS $1.45 (+8% Y/Y), beating consensus ~$1.31 by $0.14.
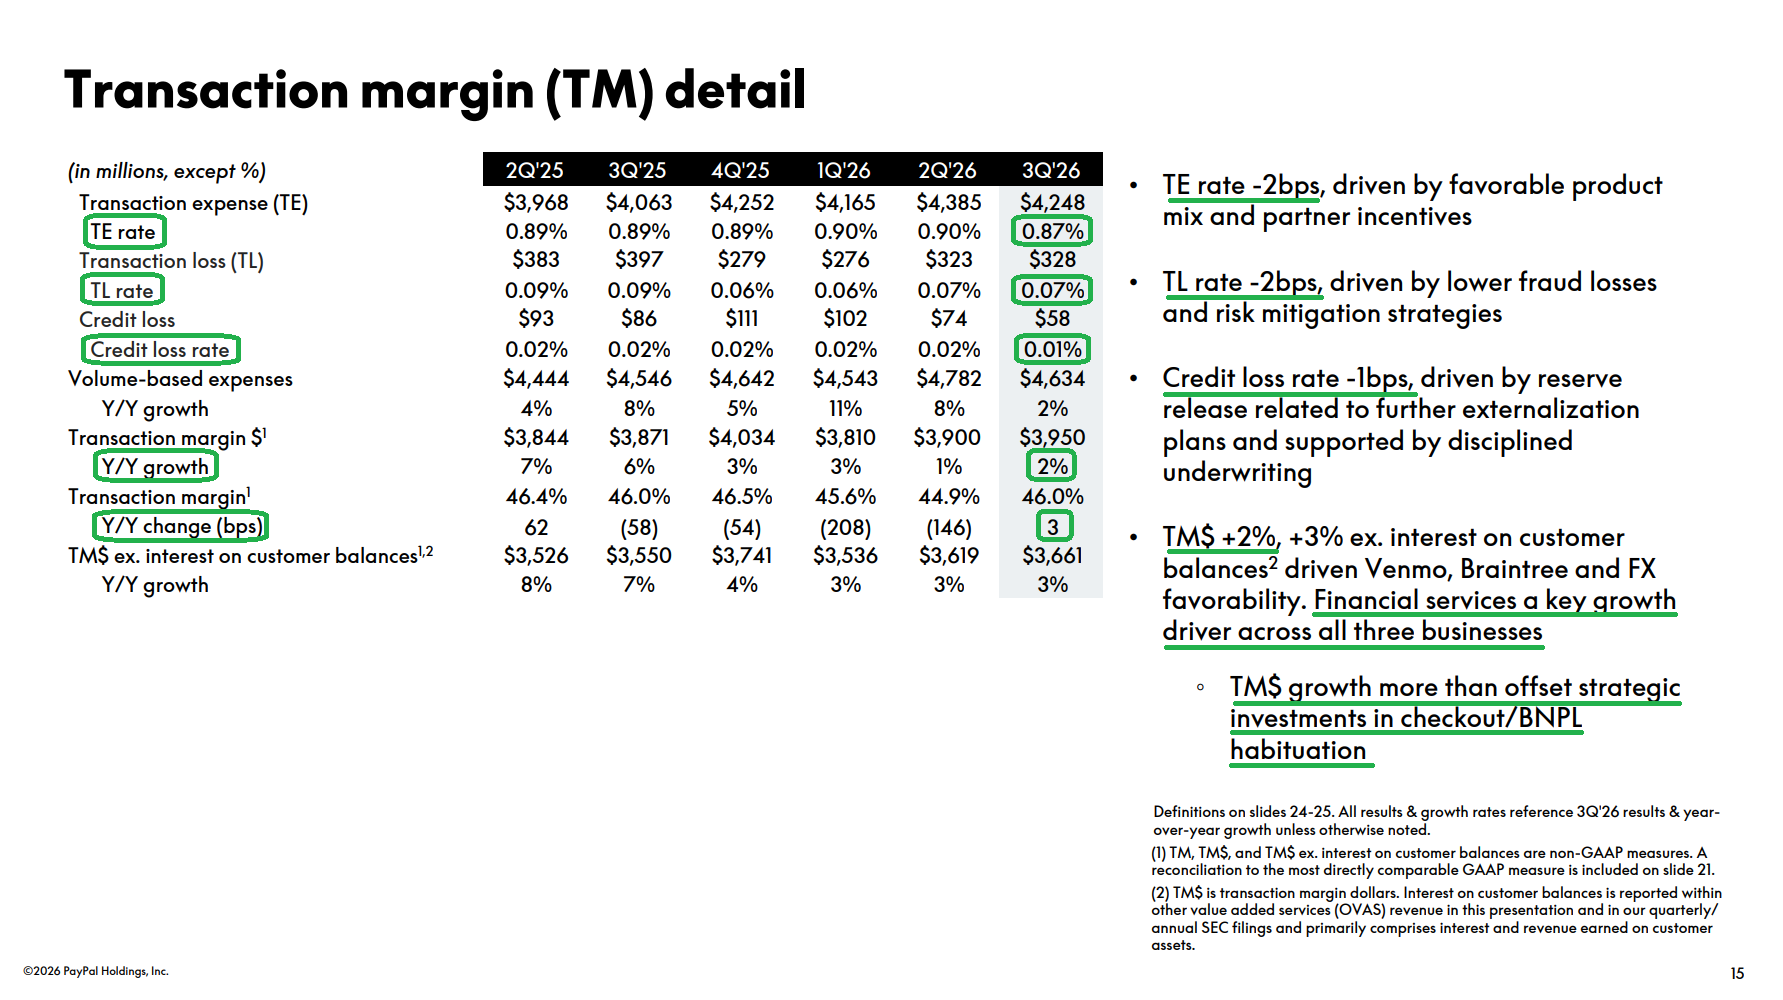
Q3 TM$ $3.95B (+2% Y/Y), beating consensus ~$3.89B by ~$60M; ex-interest on customer balances +3% to $3.66B.
Transaction margin of 46.0%, expanding 3 bps Y/Y (first expansion after four straight quarters of contraction).
Non-GAAP operating margin 18.8%, +16 bps Y/Y (vs. ~16.3% consensus).
2025: revenue $33.2B (+4% Y/Y). Transaction margin dollars $15.5B (+6% Y/Y) — accelerating from +5% in 2024 and following two straight years of declines (-5% in 2023, -3% in 2022). 2025 adjusted EPS $5.31 (+14% Y/Y). Adjusted FCF $6.4B.
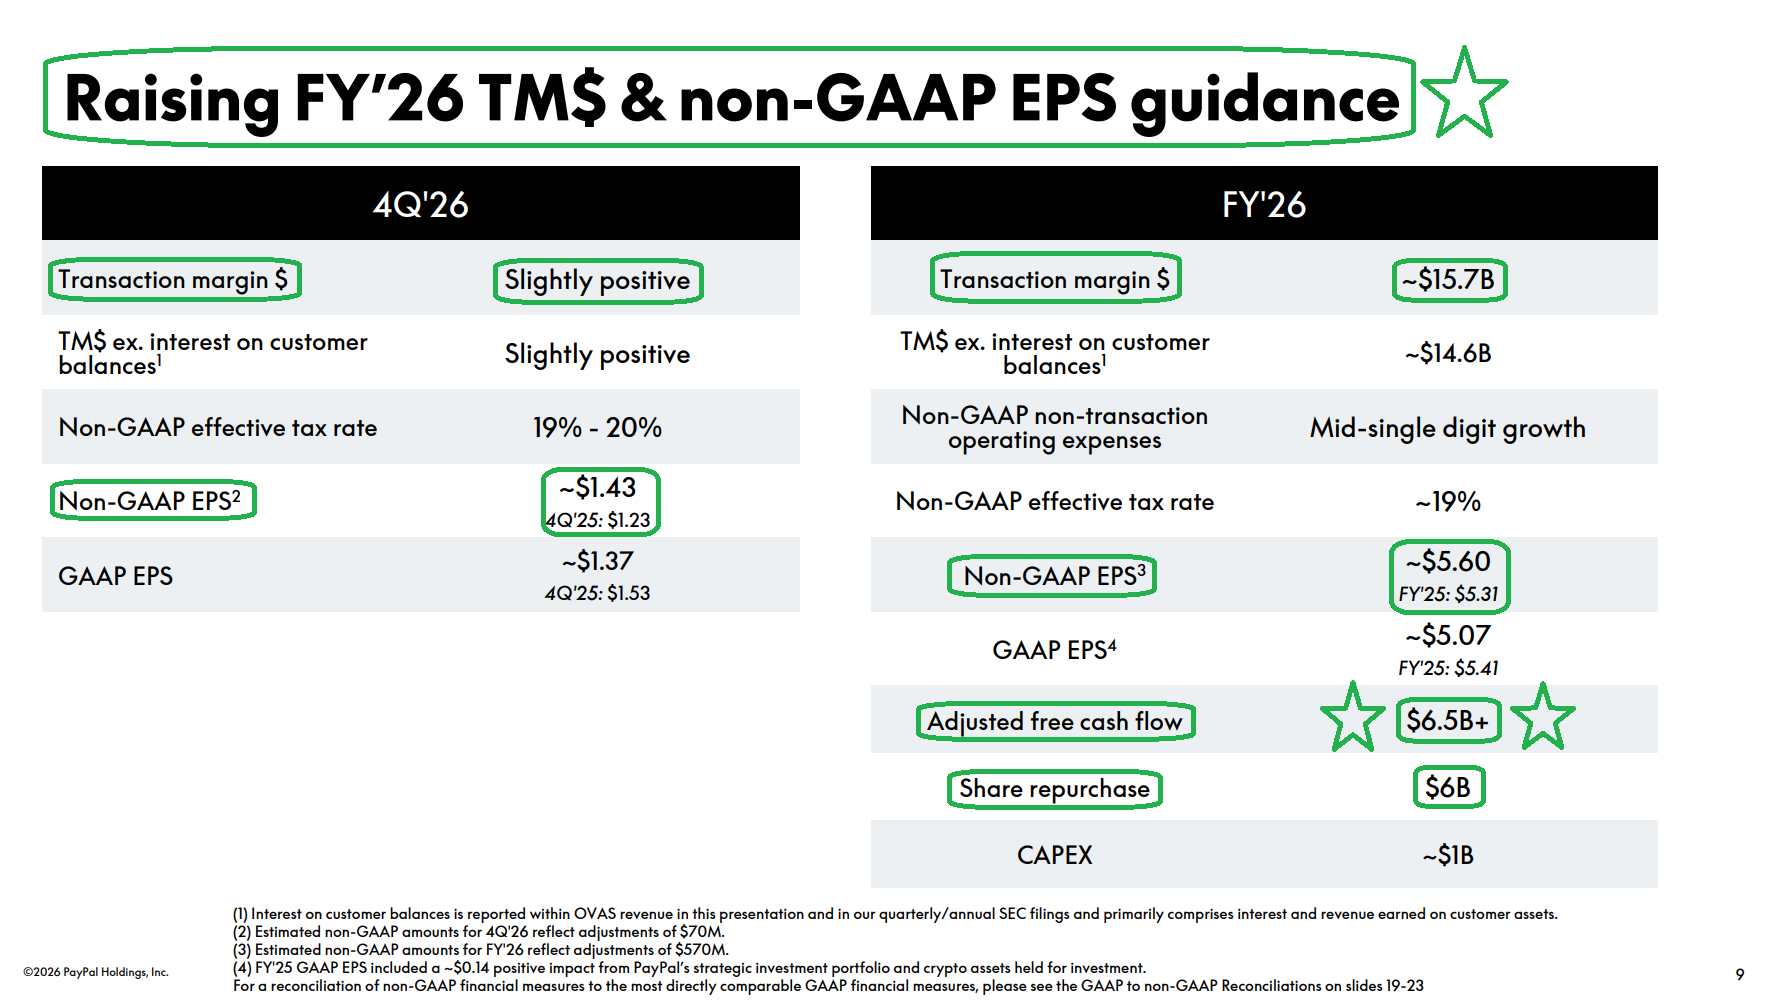
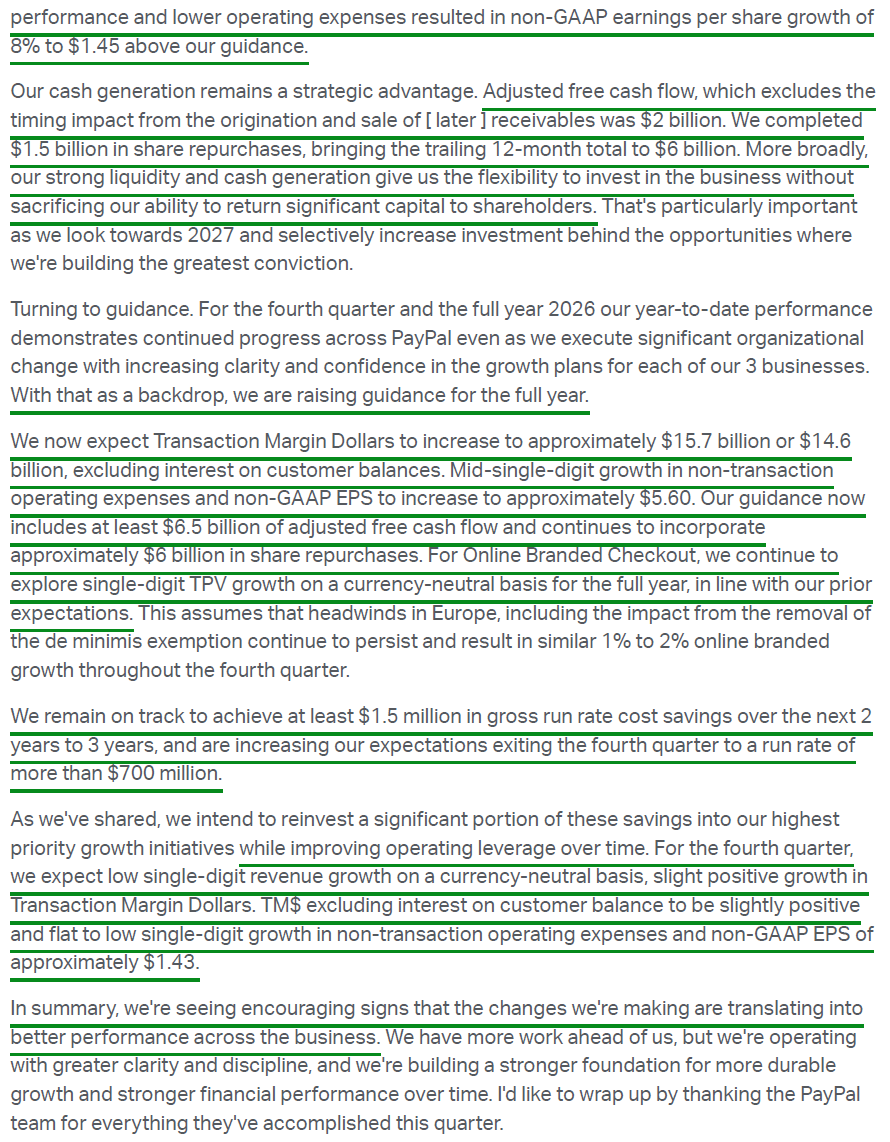
FY26 guidance raised again: non-GAAP EPS ~$5.60 (from ~$5.38), above ~$5.37 consensus; transaction margin dollars ~$15.7B (~1.5% growth, from ~$15.6B). Adjusted FCF raised to $6.5B+; ~$6B in buybacks reiterated. Q4 non-GAAP EPS guided to ~$1.43 (vs. ~$1.34 consensus).
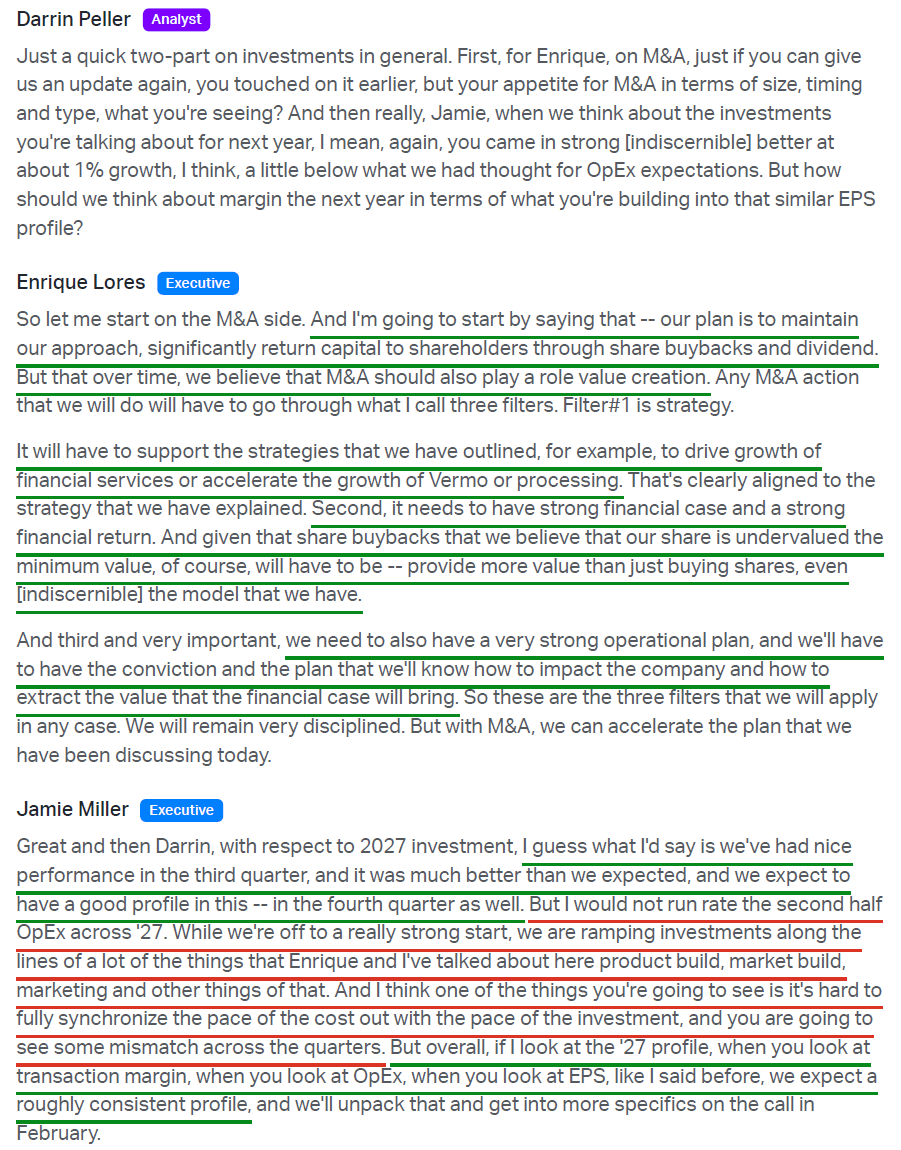
2027: targeting non-GAAP EPS growth similar to 2026 despite further TM$ and opex investment, implying ~$5.91 (vs. ~$5.77 consensus). Formal guidance on the Q4 call.
Trading at ~9.4x 2027 earnings (based on management’s implied ~$5.91) vs. 5-year average of 17x.
Q3 Commentary
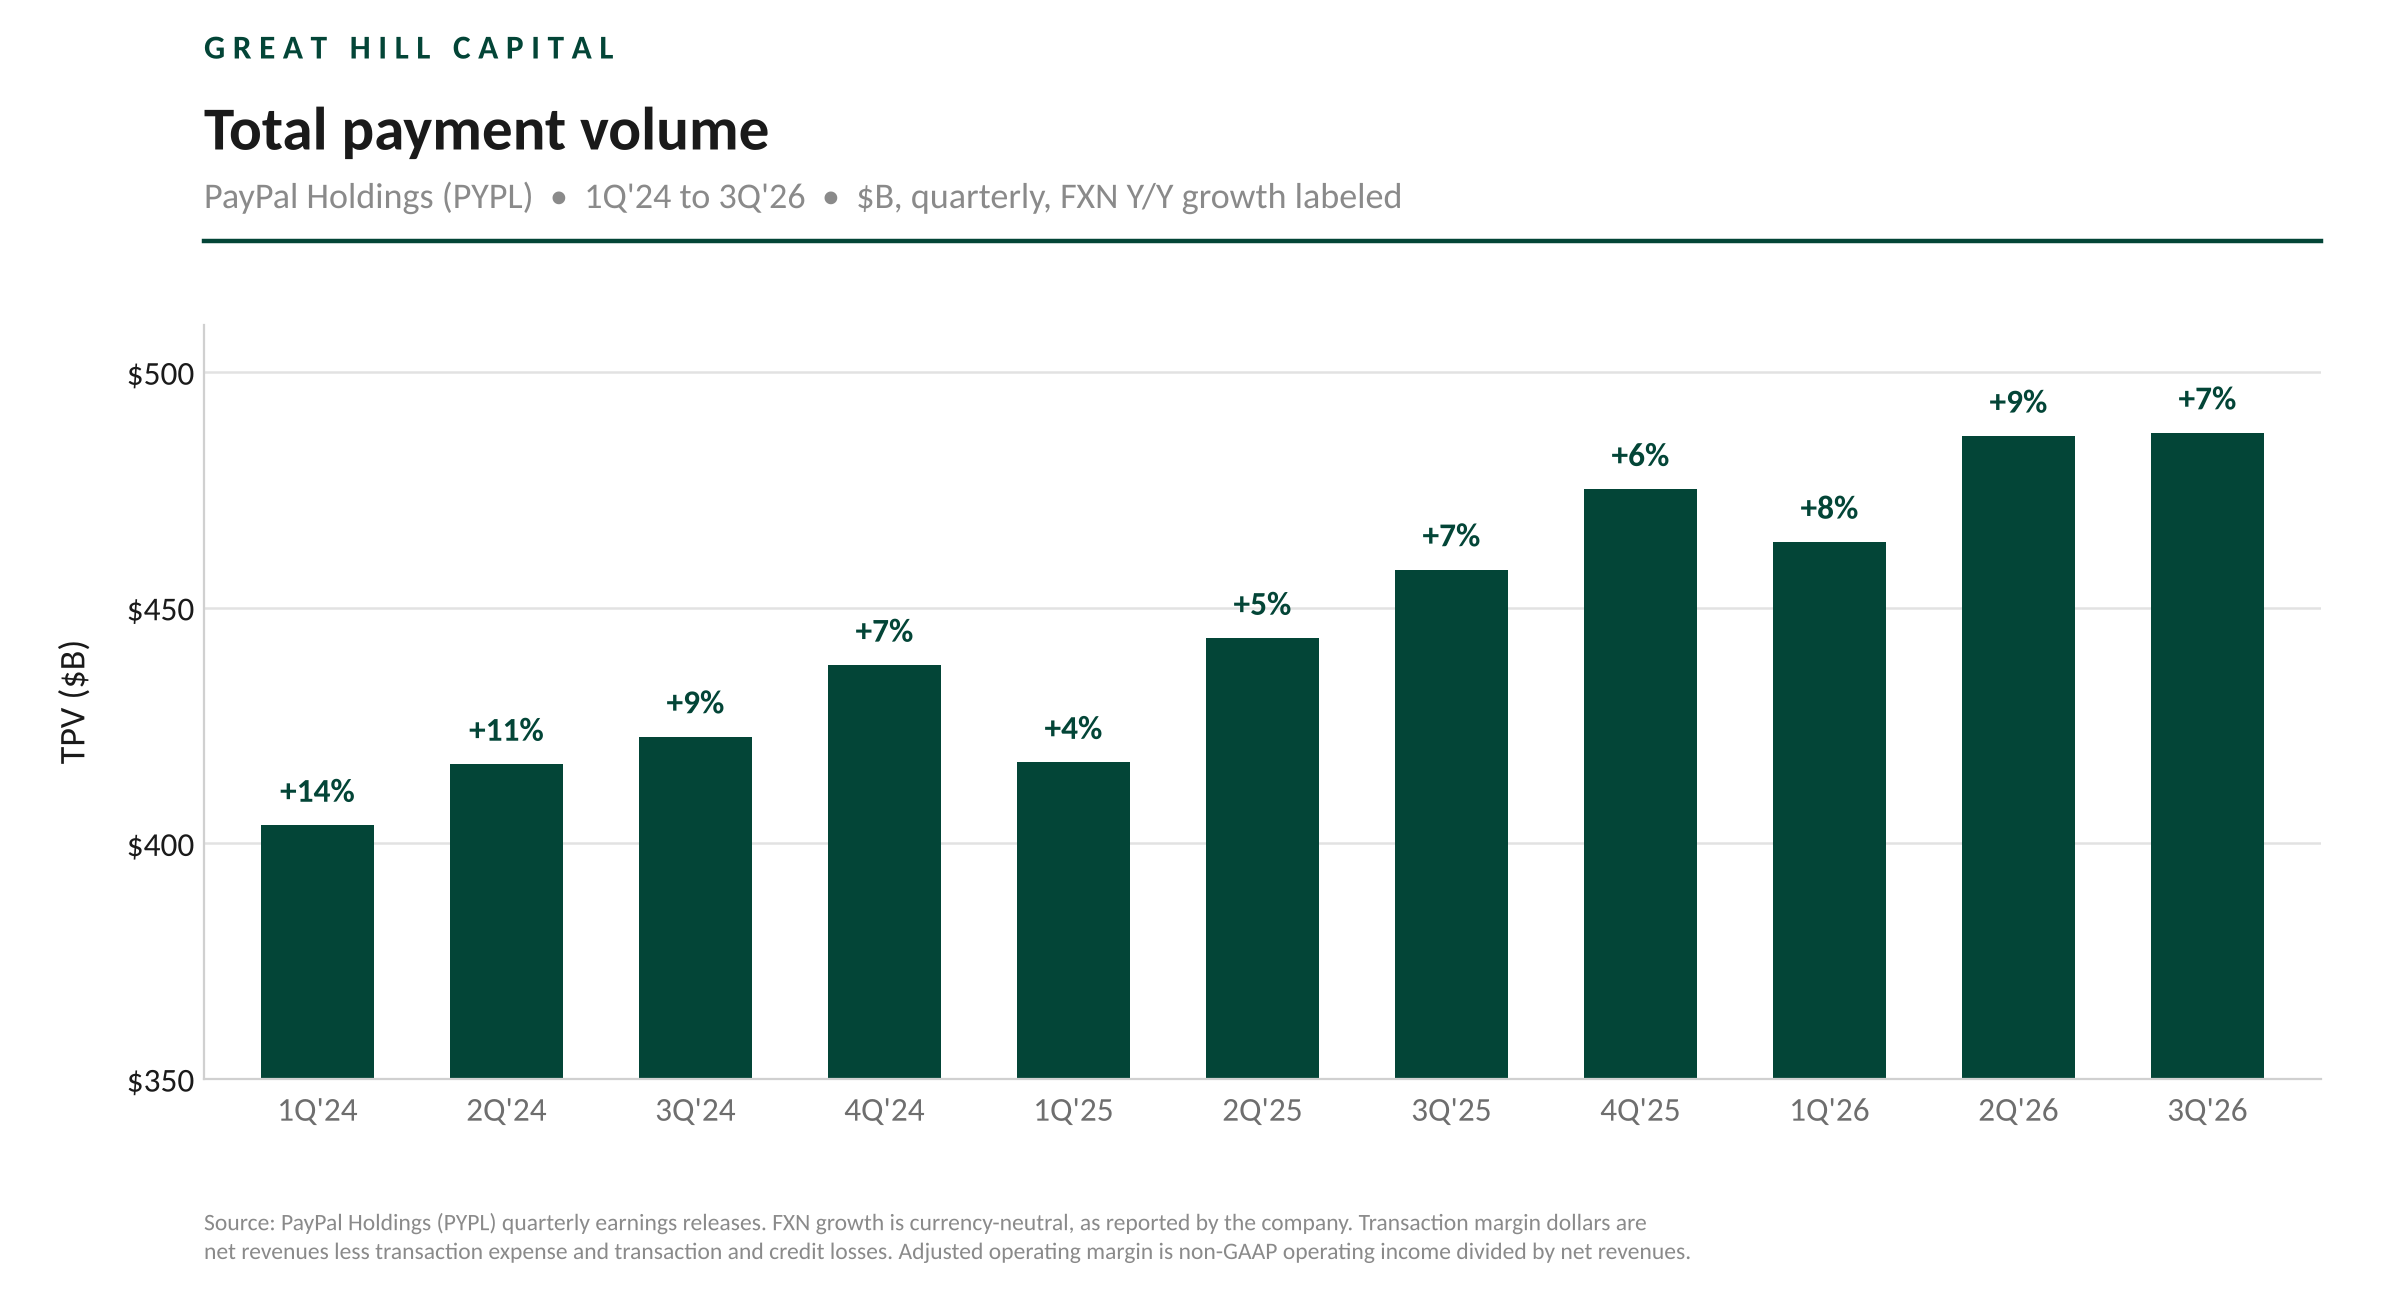
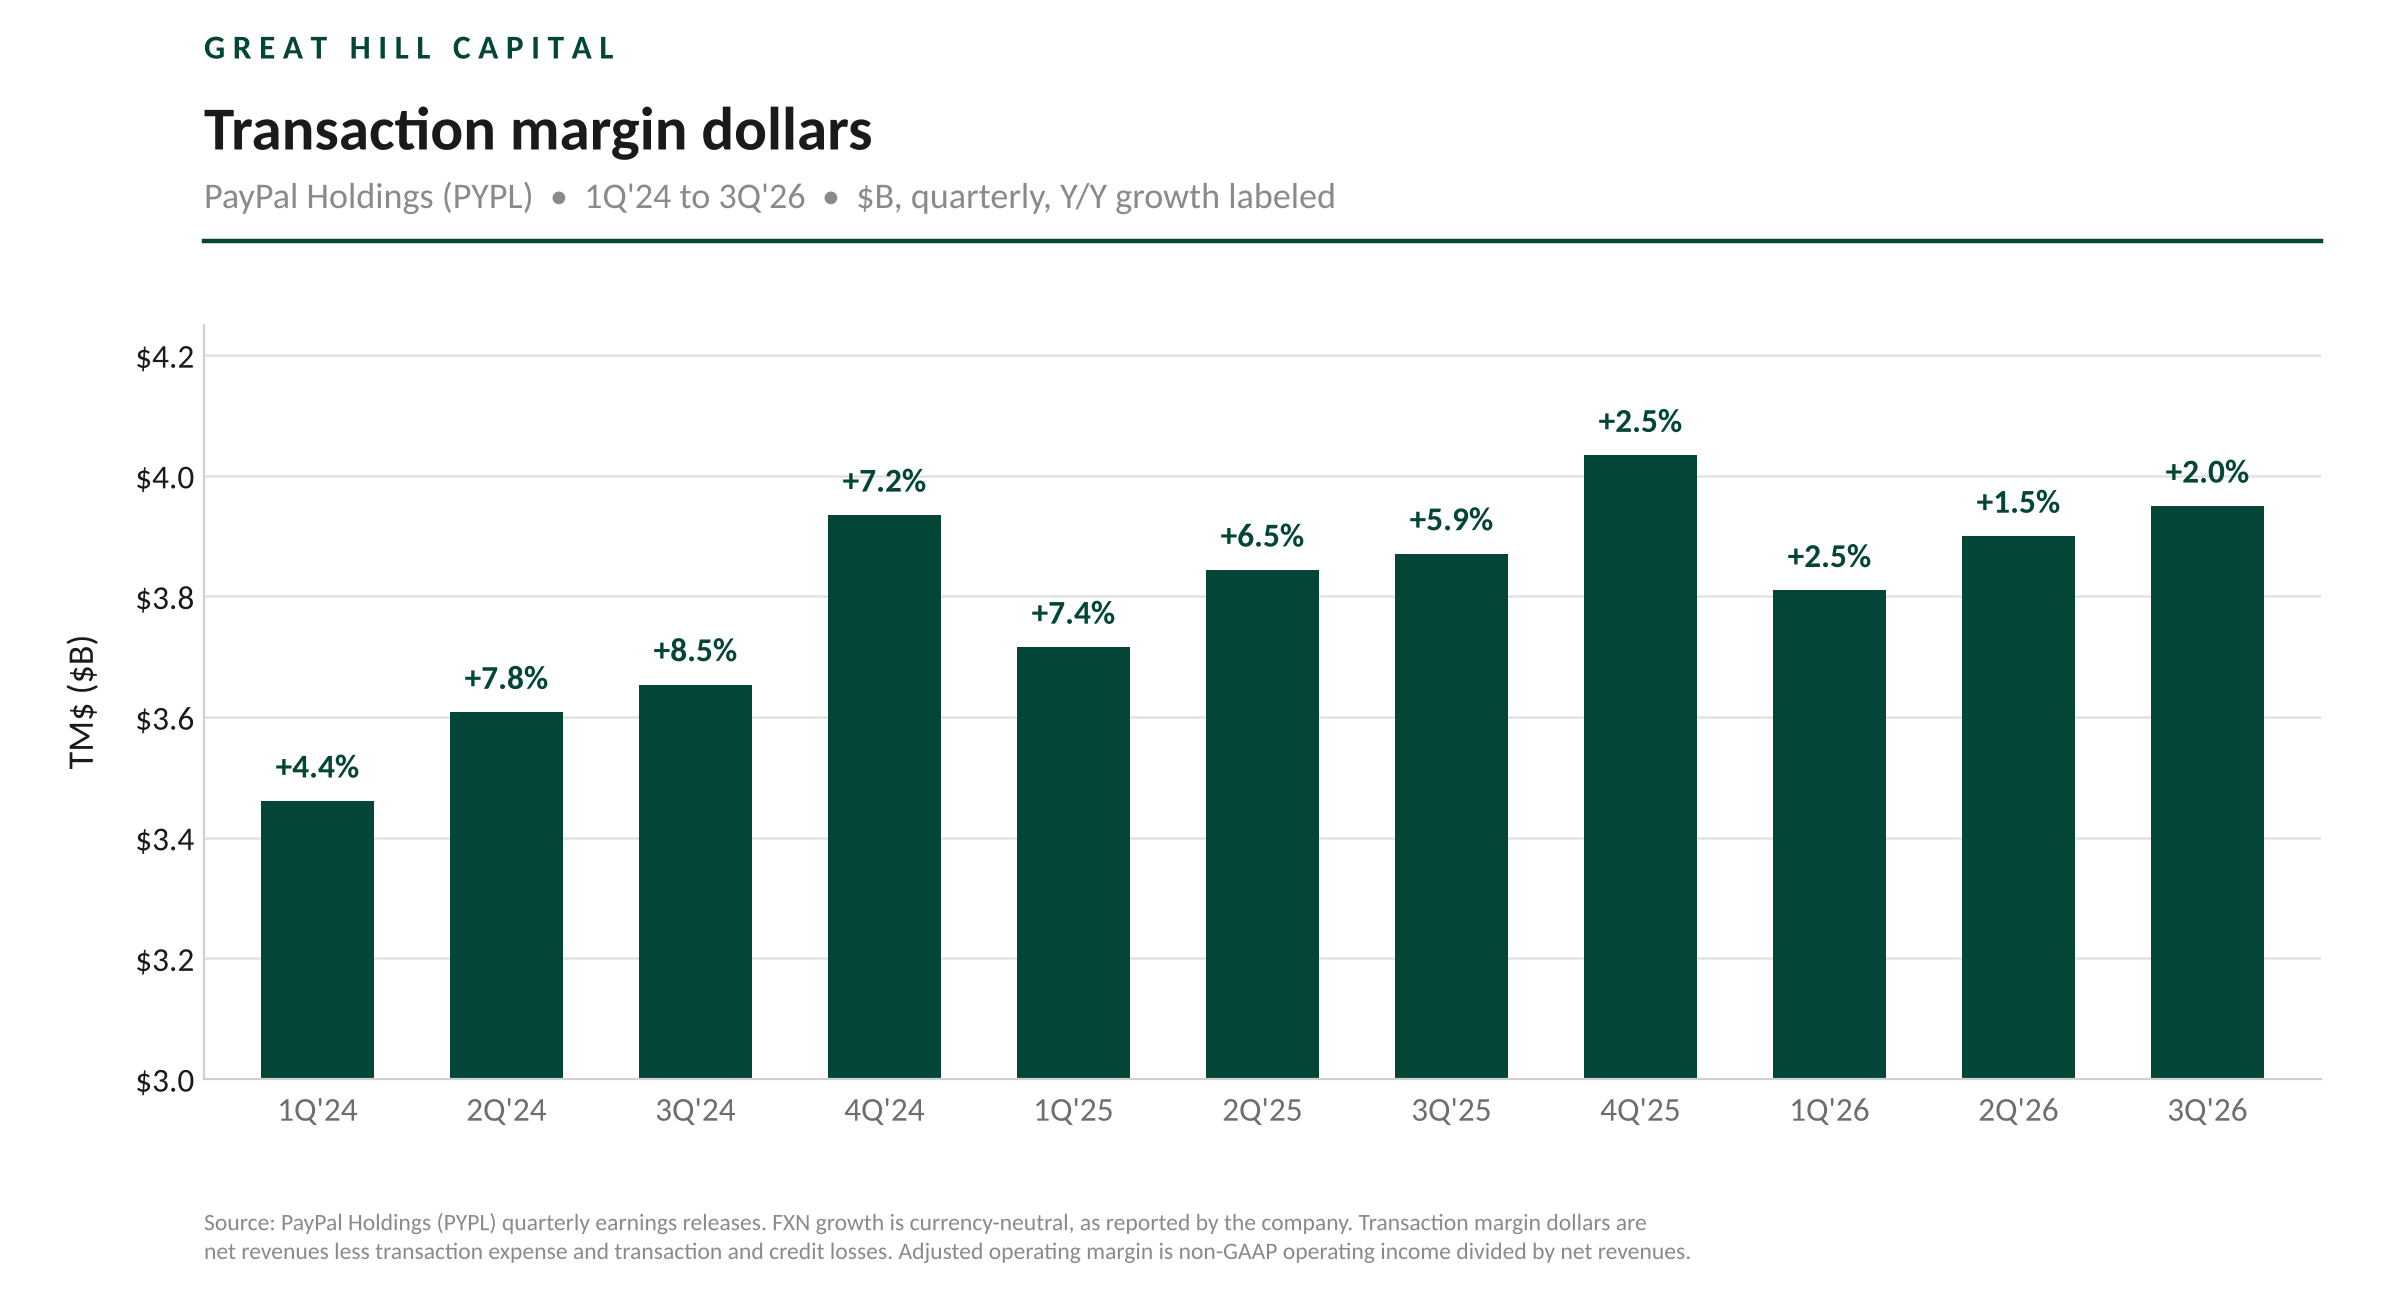
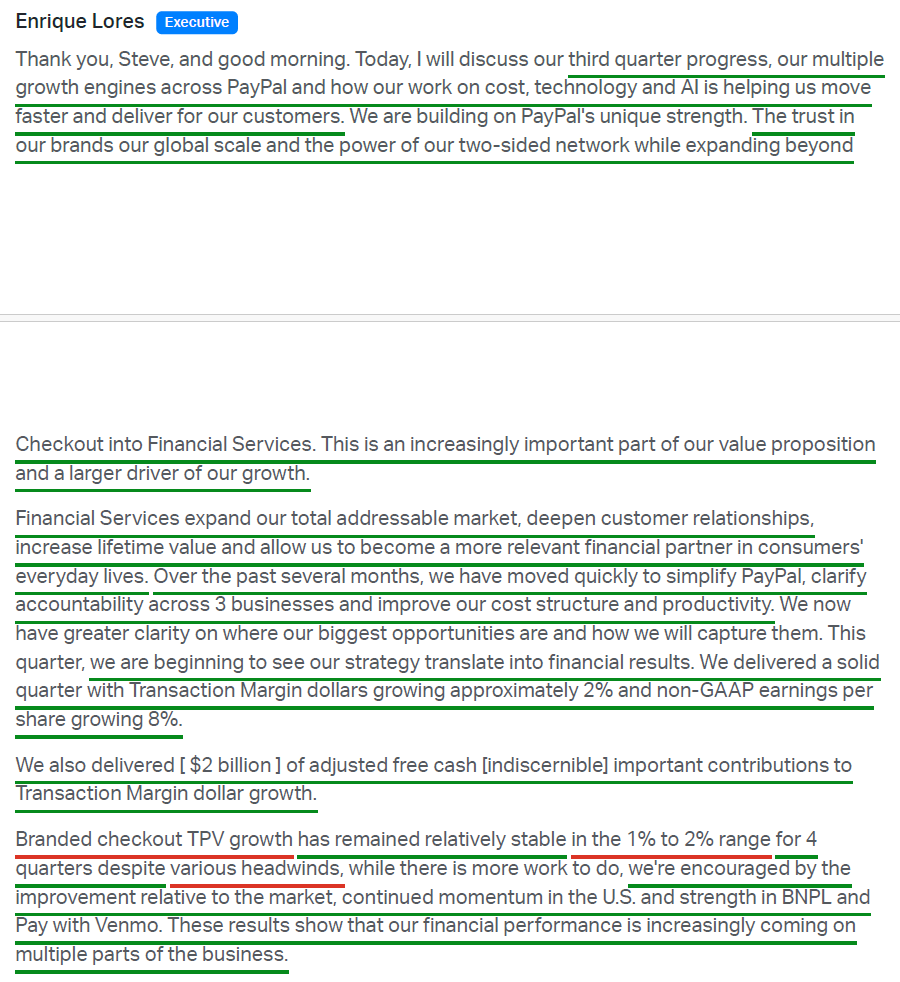
For a turnaround that has spent years asking investors for patience, PayPal’s third quarter offered something far more persuasive: progress. While revenue of $8.58B (+2% Y/Y) and total payment volume of $487.1B (+7% FXN) came in a touch light, the rest of the report pointed to a business moving firmly in the right direction. Transaction margin dollars of $3.95B (+2% Y/Y) beat consensus by ~$60M, while disciplined cost control held non-transaction operating expense growth to just 1%. That combination drove adjusted EPS up 8% Y/Y to $1.45, well ahead of the $1.31 consensus, marking a third straight beat under CEO Enrique Lores. Management followed with a second guidance raise in as many quarters, lifting full-year EPS to ~$5.60 from ~$5.38 (+5.5% Y/Y), transaction margin dollars to ~$15.7B from ~$15.6B (+1.5% Y/Y), and adjusted free cash flow to $6.5B+ from $6B+ (+1.4% Y/Y).
Despite the solid progress, many investors remain on the sidelines in “show me” mode after years of false starts, unwilling to commit to the turnaround until they see branded checkout inflect higher.
That focus is understandable. Branded checkout accounts for just ~27% of TPV but generates more than half of PayPal’s profit dollars. With competitors like Apple Pay and others competing for the same checkout real estate, the market has treated the slowdown in PayPal’s core checkout button as the slow melt of the entire business. The problem with that framing is that it is backward-looking, judging PayPal by the company it USED to be rather than the business it is BECOMING.
From day one, CEO Enrique Lores has focused on building a business that is far more than a checkout button, diversifying toward growth drivers that make up a steadily larger share of transaction margin dollars. This quarter was a proof point that the strategy works. Branded checkout grew just 1%, yet PayPal still beat on earnings, grew transaction margin Y/Y for the first time in a year, and raised guidance across the board. The PayPal of the past could never have pulled that off.
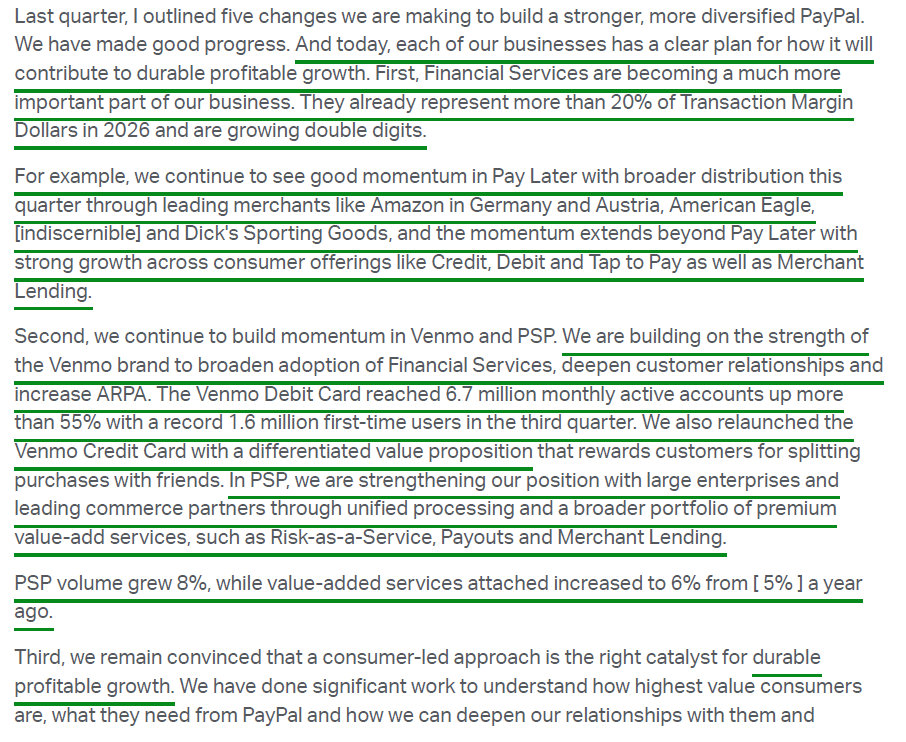
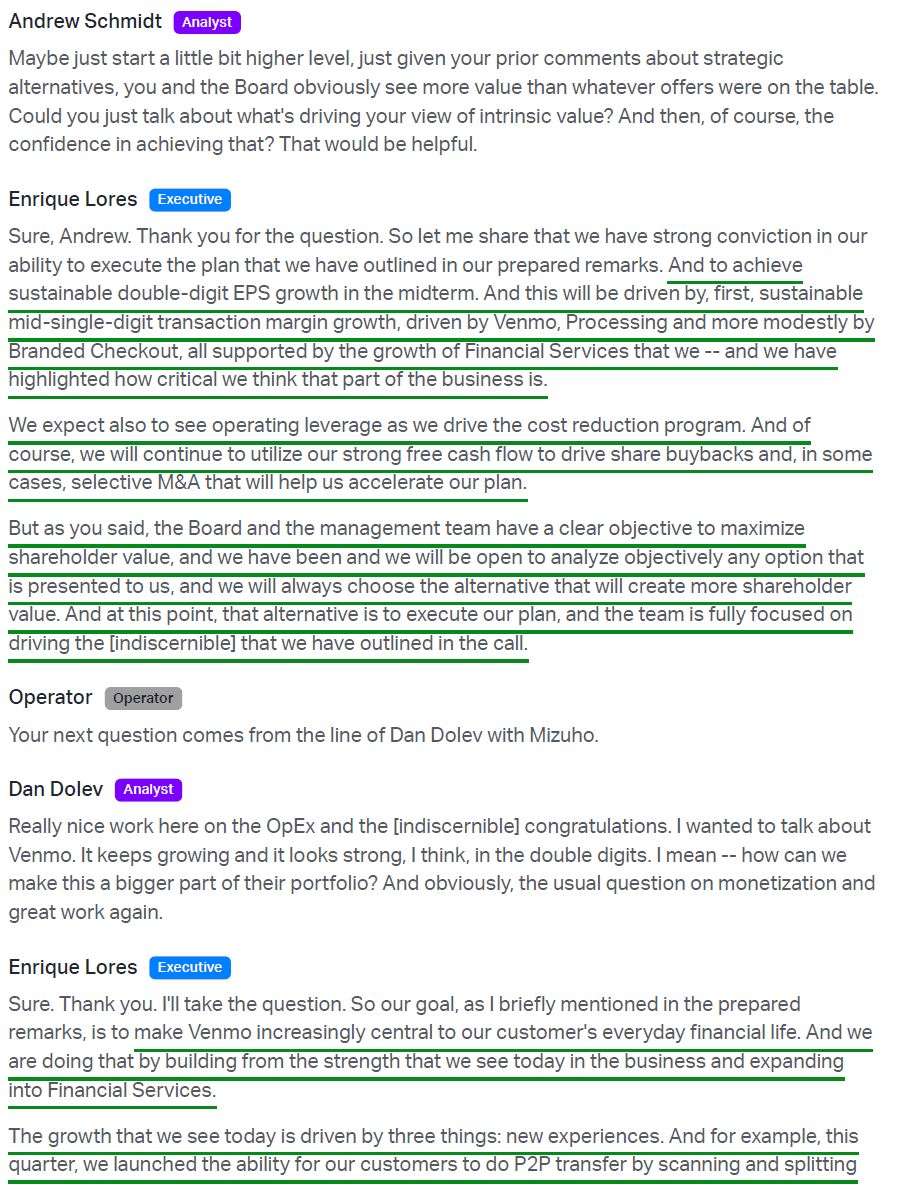
The difference is a set of new growth drivers that management expects to each grow double digits and account for a significantly greater share of transaction margin dollar growth over time, starting with financial services. The category spans all three businesses, with offerings that include BNPL, PayPal and Venmo credit and debit cards, and working capital and business loans for merchants. Management expects financial services to account for >20% of transaction margin dollars this year while growing double digits, with good reason to keep pushing.
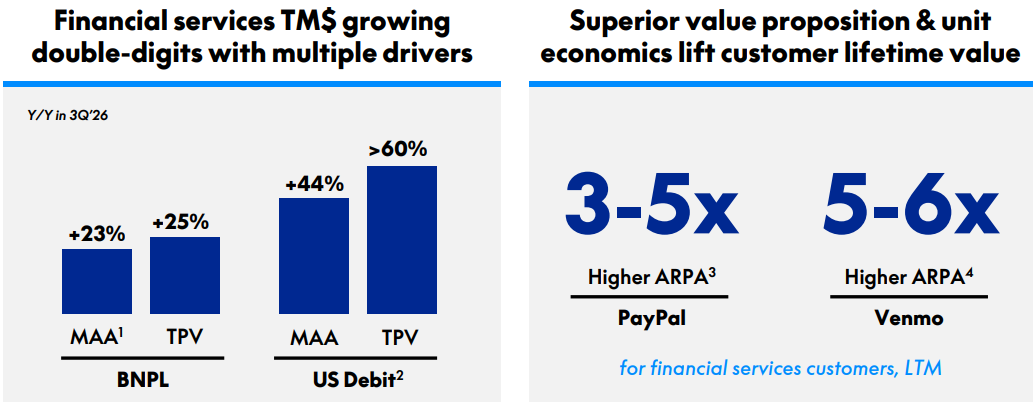
Customers who use these products generate 3-6x the ARPA of those who don’t, while PayPal can acquire them at minimal cost by selling into its existing base of 440M active accounts. Each product makes a customer more valuable and harder to lose, gradually turning a button people use a few times a month into a platform they engage with every day.
BNPL is the furthest along. Volume topped $40B in 2025 (+23% Y/Y) and has grown in the mid-20s every quarter this year (+23%, +26%, and +25%), consistently outpacing the broader market with unit economics on par with or better than the pure-play competitors. The customers it attracts are among the most valuable PayPal has, transacting ~5x more often than standard checkout users with average order values more than 80% higher. Already live in eight markets globally, management continues to expand its reach, adding Amazon in Germany and Austria, American Eagle, Aerie, and Dick’s Sporting Goods this quarter, with cards that carry BNPL flexibility from online checkout into physical stores coming next.
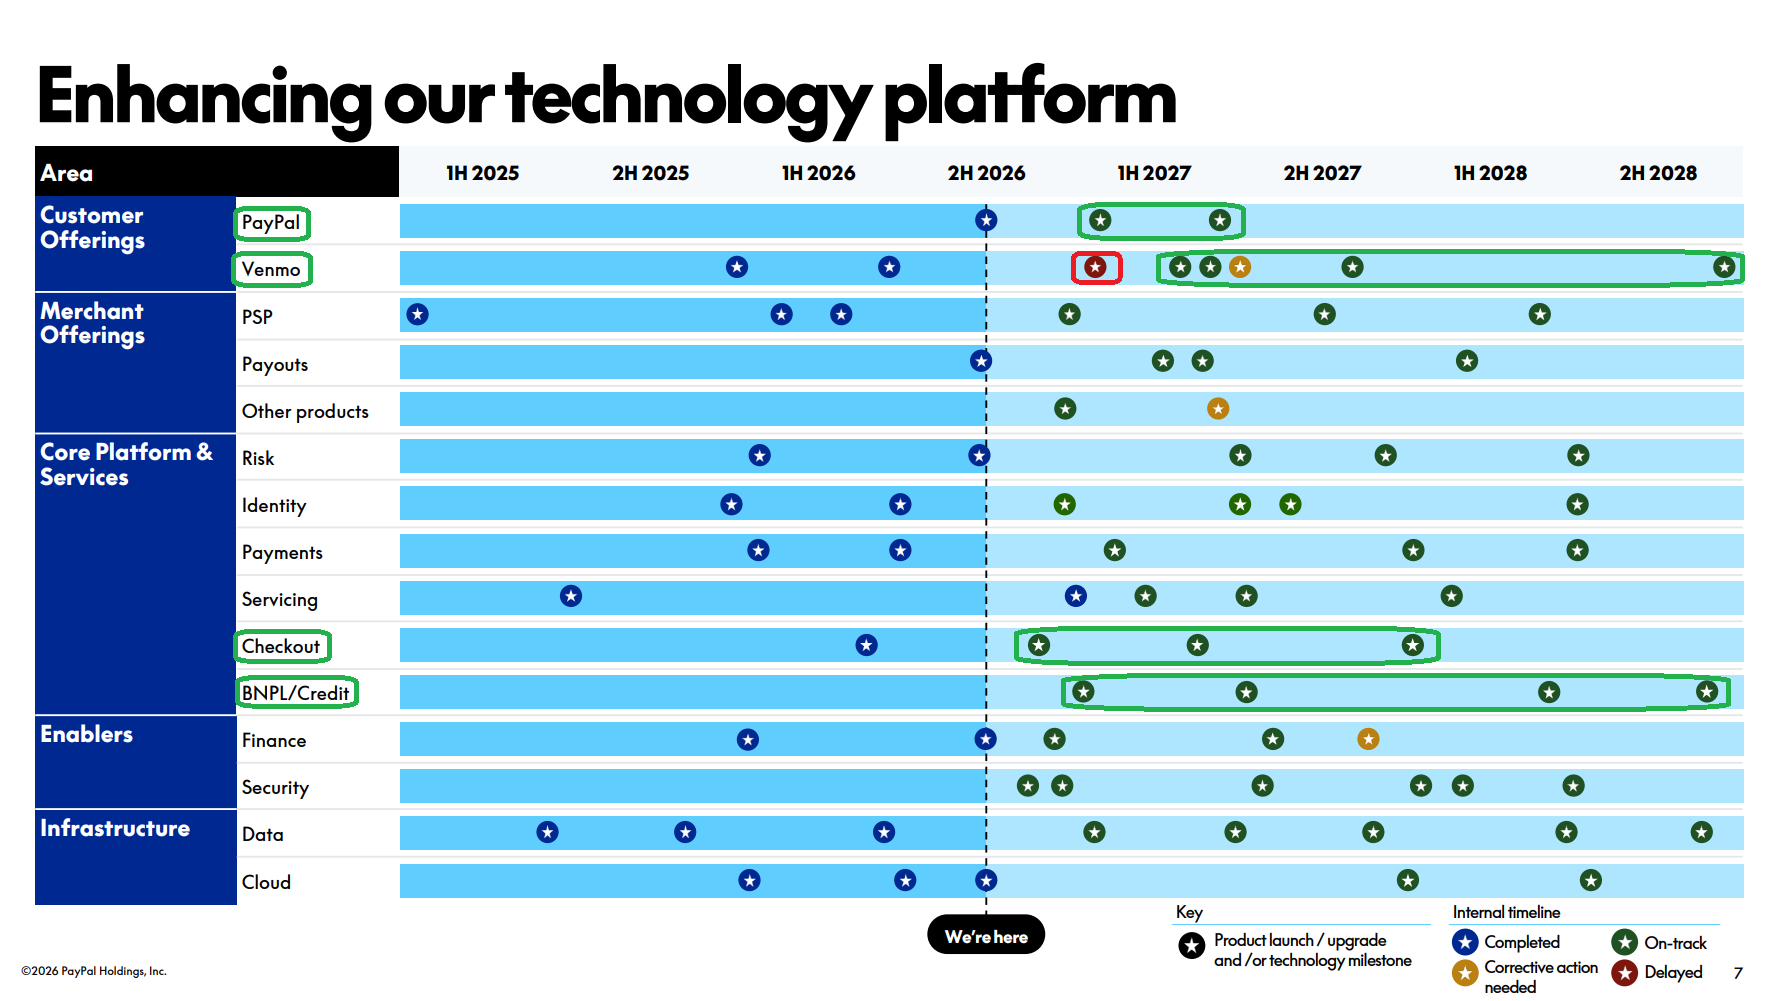
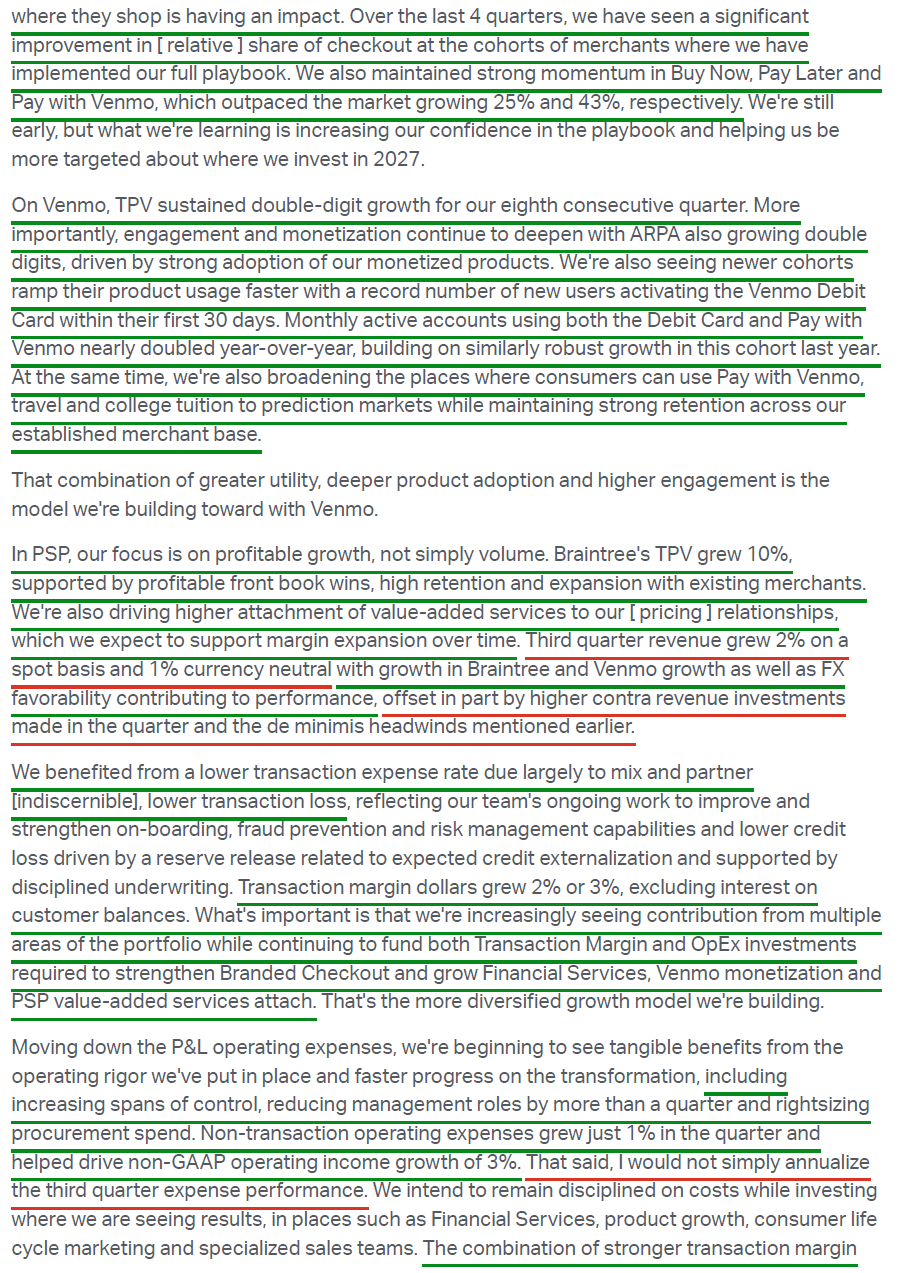
Venmo monetization is the next major lever. Engagement has never been the issue, with eight straight quarters of double-digit TPV growth (+14% to a record $96.8B in Q3) and more than 100M active accounts. The opportunity now is to convert that engagement into higher revenue and transaction margin dollars as more users adopt Venmo’s growing suite of financial services. Q3 brought further progress, with debit card monthly active accounts jumping 55% to 6.7M, including a record 1.6M first-time users, while Pay with Venmo volume grew 43% as acceptance expanded into travel, college tuition, and prediction markets. A relaunched Venmo credit card adds another product to the lineup, with six more product launches, upgrades, or technology milestones planned through 2H’28 as management works to turn Venmo into an all-in-one money management platform. Just 23% of Venmo users currently use any of its financial services, which is why management sees room to grow ARPA 4-5x from current levels while expecting double-digit TPV growth to continue in the coming years.
The third driver is PSP, led by Braintree. Under former CEO Alex Chriss, PayPal made the tough but necessary decision to “fire” unprofitable enterprise customers by repricing contracts to reflect the value of its services. That reset weighed on reported growth for several quarters and fed the slowing-growth narrative. It was fully lapped last year, and the payoff has shown up in spades since. Braintree volume grew 10% in Q3, its fourth straight quarter of double-digit growth, on profitable new business wins, high retention, and expansion with existing merchants. Most importantly, Braintree has become an important contributor to transaction margin dollar growth. The next leg comes from attaching value-added services such as payouts, risk-as-a-service, and invoicing to those processing relationships, where attach rates rose to 6% from 5% a year ago as PayPal builds a specialized sales force dedicated to pushing them higher.
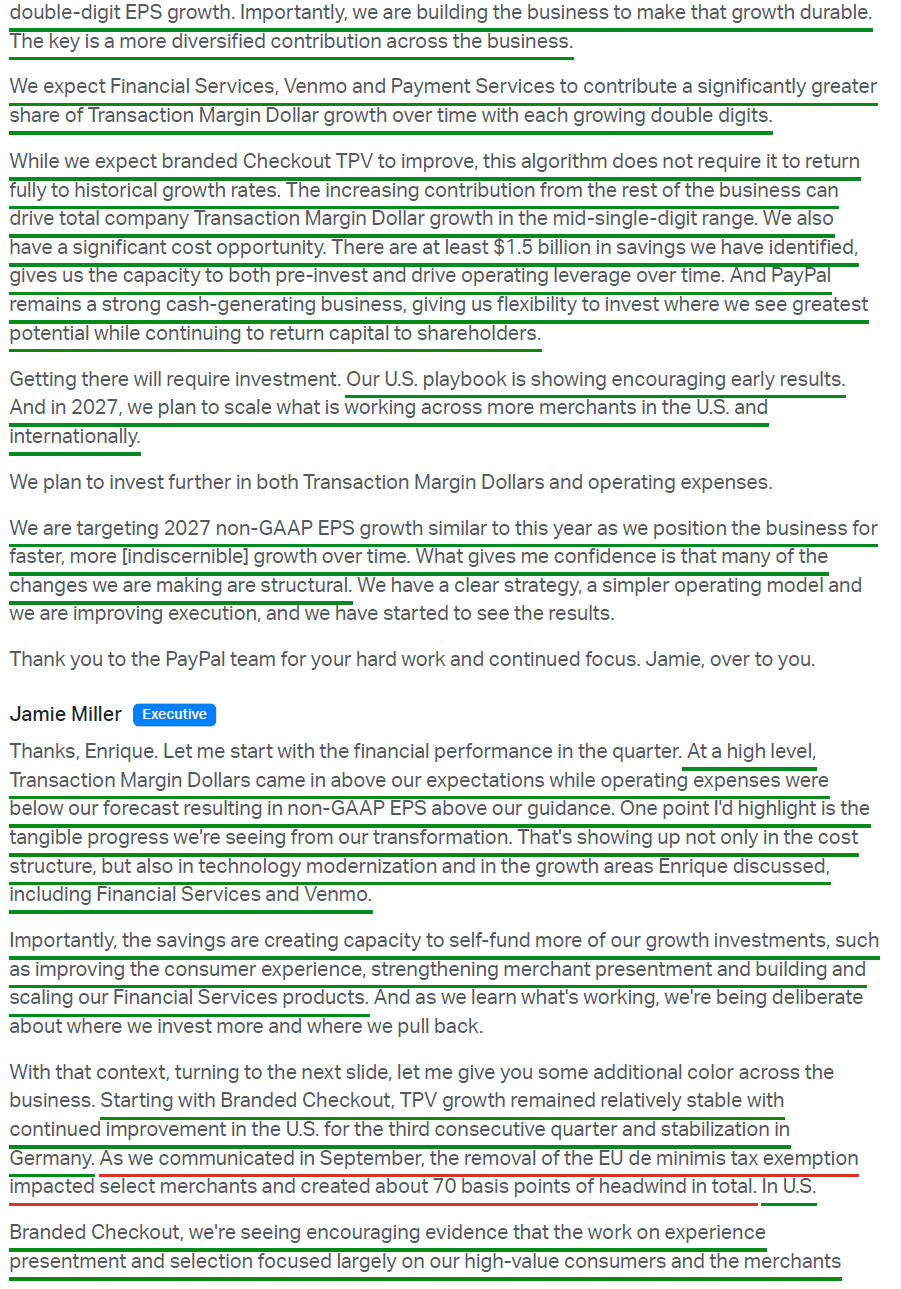
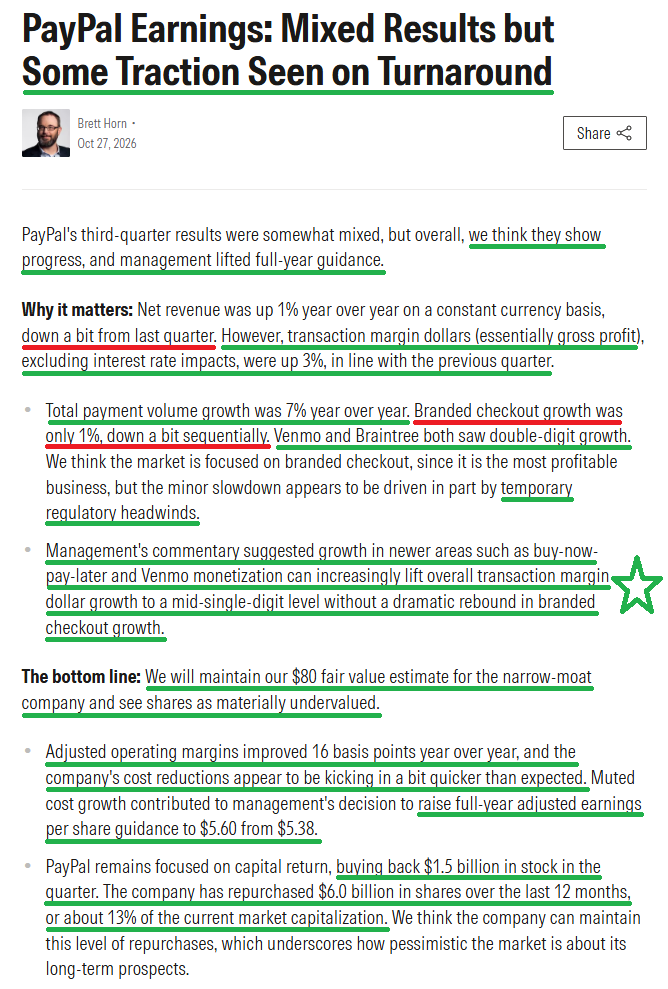
Over the medium term, management expects these new growth drivers to support sustainable mid-single-digit growth in transaction margin dollars which, combined with operating leverage and buybacks, should translate into solid double-digit EPS growth. Most importantly, management expects to deliver this earnings growth even without a meaningful reacceleration in branded checkout toward its historical mid-single-digit growth rates.
That does not mean we expect branded checkout to stay muted forever. The biggest undertaking of former CEO Alex Chriss’s tenure was overhauling the legacy checkout experience, a project that required untangling more than a decade of integrations and rolled out far slower than planned.
Much like Pat Gelsinger got Intel to the 10-yard line before the board handed the ball to Lip-Bu Tan, Chriss laid the groundwork for the checkout turnaround, leaving Lores to punch it into the end zone. He is doing so with a merchant playbook that pairs the latest checkout experience, including biometrics and vaulted payment methods, with upstream BNPL messaging and co-marketing. The early signs are very encouraging. Across 11 large merchants representing ~20% of U.S. branded volume, PayPal’s branded growth is now keeping pace with or outpacing the merchants’ own U.S. e-commerce growth wherever the playbook has been deployed.
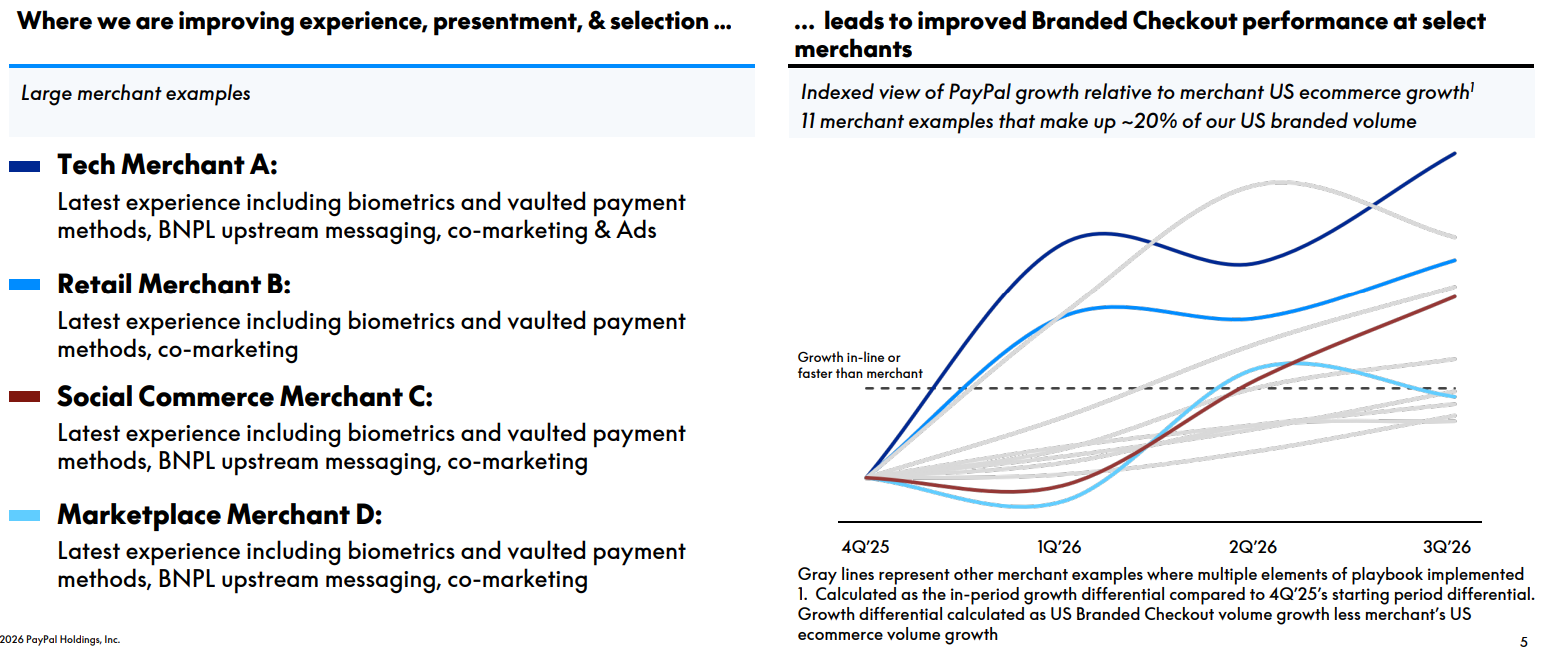
Branded checkout has now held in the 1-2% range for a fourth straight quarter despite ~70 bps of drag from EU tariff impacts tied to the removal of the de minimis exemption. Beneath that 1% headline growth sits a third straight quarter of improvement in the U.S., along with stabilization and slight improvement in Germany, PayPal’s second-largest branded checkout market.
Management plans to bring the playbook to additional U.S. and European merchants in 2027, which it is framing as another investment year as it ramps spending in both transaction margin and operating expenses. With those investments underwritten on a two- to three-year horizon, 2028 is when they should begin to bear fruit. Should PayPal execute as management expects, any meaningful rebound in branded checkout is pure upside nobody is paying for today.
Funding all of that investment while still growing earnings requires a leaner PayPal, which is exactly the job Lores was brought in to do. At HP, he built his reputation by stripping out bloated structures, removing management layers, and simplifying operations. PayPal had plenty of room for similar changes. Earlier this year, management unveiled a $1.5B+ gross run-rate savings target (~16.5% of the 2025 non-transaction operating expense base). It has since raised its year-end exit rate to more than $700M from ~$400M last quarter, having cut more than 2,000 roles (~8% of the workforce), reduced managerial positions by more than 25%, and removed three organizational layers across most of the company. Those efforts helped hold non-transaction operating expense growth to just 1%, lifting adjusted operating margin to 18.8% (+16 bps Y/Y) while allowing PayPal to grow EPS 8% on 2% revenue growth.
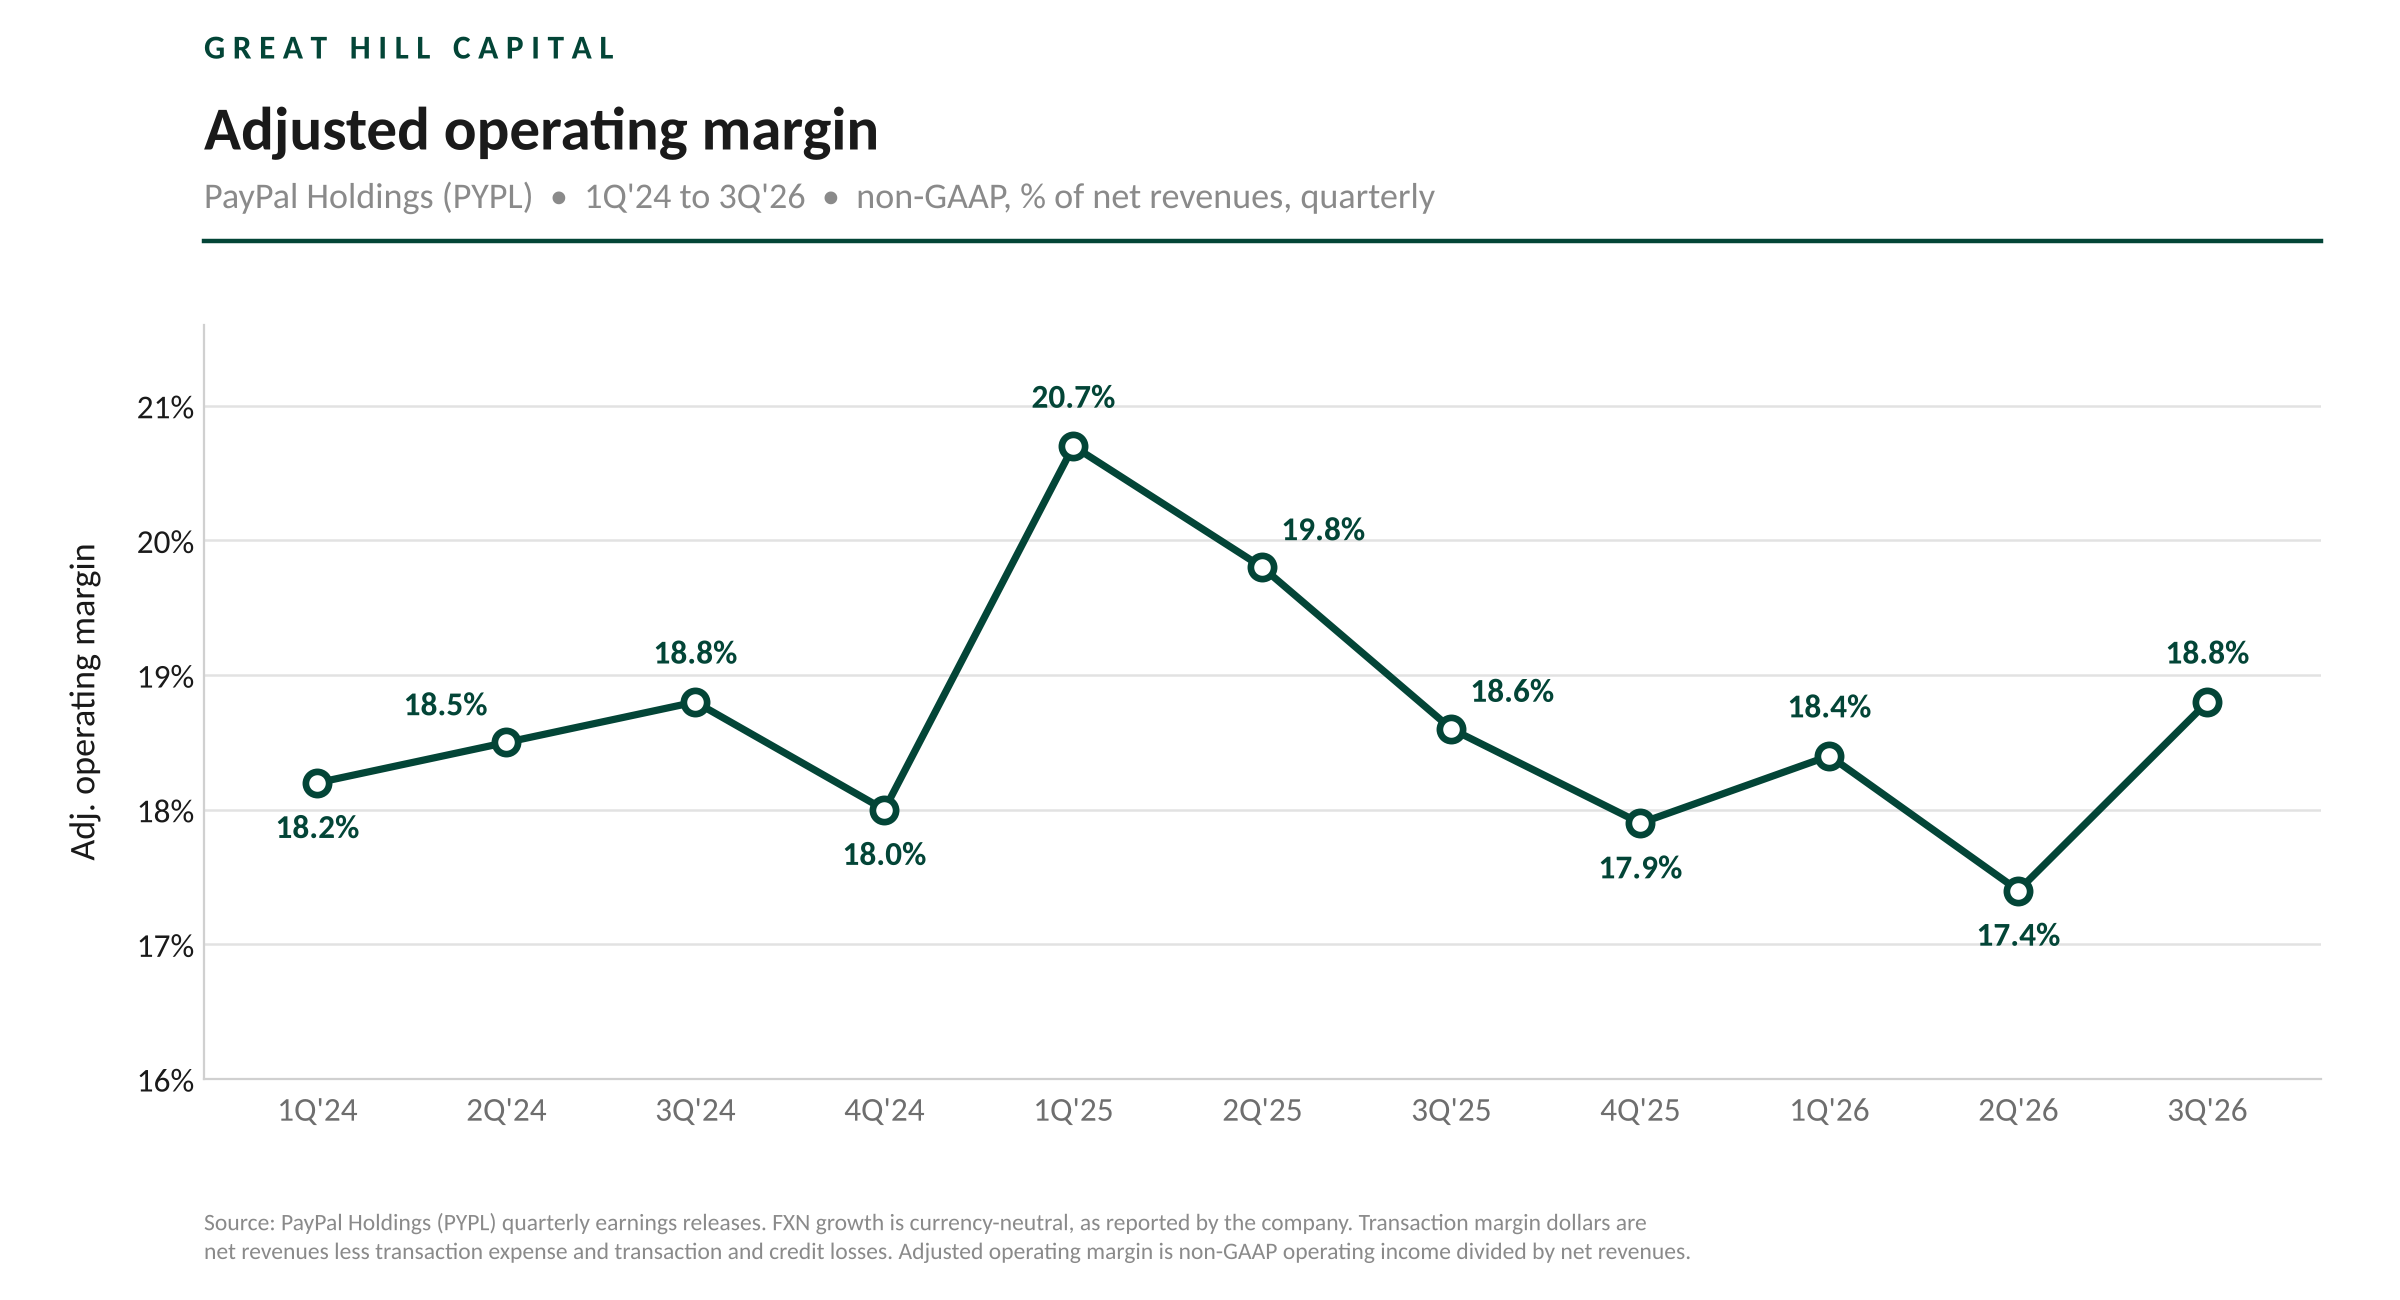
That cost program also makes PayPal one of the clearest examples of our AI cost center versus AI beneficiary thesis. While the hyperscalers write ever-larger checks for AI infrastructure, we believe the biggest winners will be the everyday businesses that put those tools to work, capturing the efficiency gains without carrying the capex burden. PayPal is one of those winners, with management expecting ~40% of its targeted savings (~$600M) to come from AI adoption.
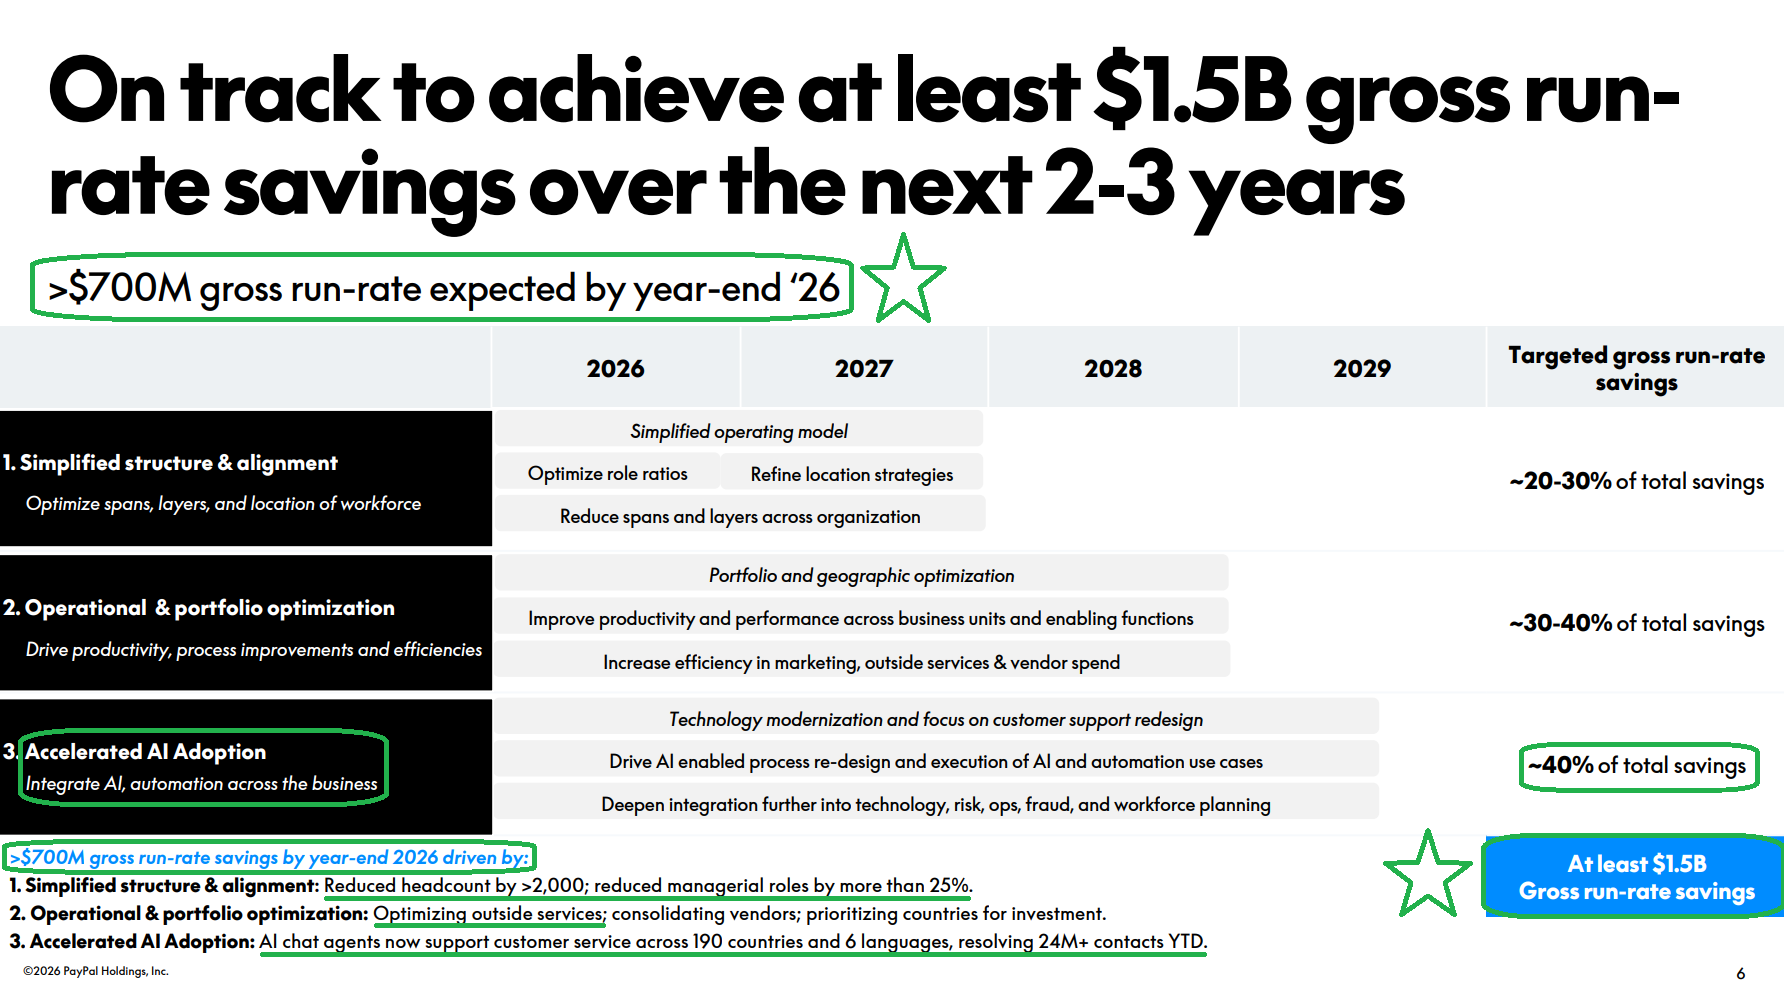
That works out to ~$0.70 per share on a pre-tax basis, making PayPal one of the few companies to put a hard number on what AI is worth to the bottom line. The tools are already at work across the business, with AI chat agents resolving more than 24M customer contacts YTD across 190 countries and AI-assisted coding cutting implementation time by 25%. Agentic commerce is the cherry on top, with PayPal becoming the first wallet integrated into ChatGPT, building partnerships spanning Perplexity, Google, and Microsoft, and most recently partnering with Meta to power checkout through its Muse personal AI agents.
Even that leaves out the part of the business we continue to be surprised more investors are not focused on: ads. About two and a half years ago, PayPal hired Mark Grether to build its ads business from scratch. He helped build Amazon’s advertising juggernaut, one of the most profitable businesses in tech, before scaling Uber’s ad business from ~$141M in 2021 to more than $2B in 2025. At PayPal, he now has 440M active accounts and trillions of purchase-level data points to work with. Ads businesses typically command 80%+ margins, compared with PayPal’s ~46% transaction margin, creating the potential for a multi-billion-dollar, high-margin business that almost no one is talking about.
In the meantime, PayPal remains the cash machine it has always been. Adjusted free cash flow reached $2.05B this quarter, with full-year guidance now raised to $6.5B+ (~14% free cash flow yield). With $15.1B of cash and investments against $13.5B of debt, PayPal has the flexibility to buy back stock aggressively when it is actually cheap, unlike many management teams that find their hands tied by leverage when shares are beaten down.
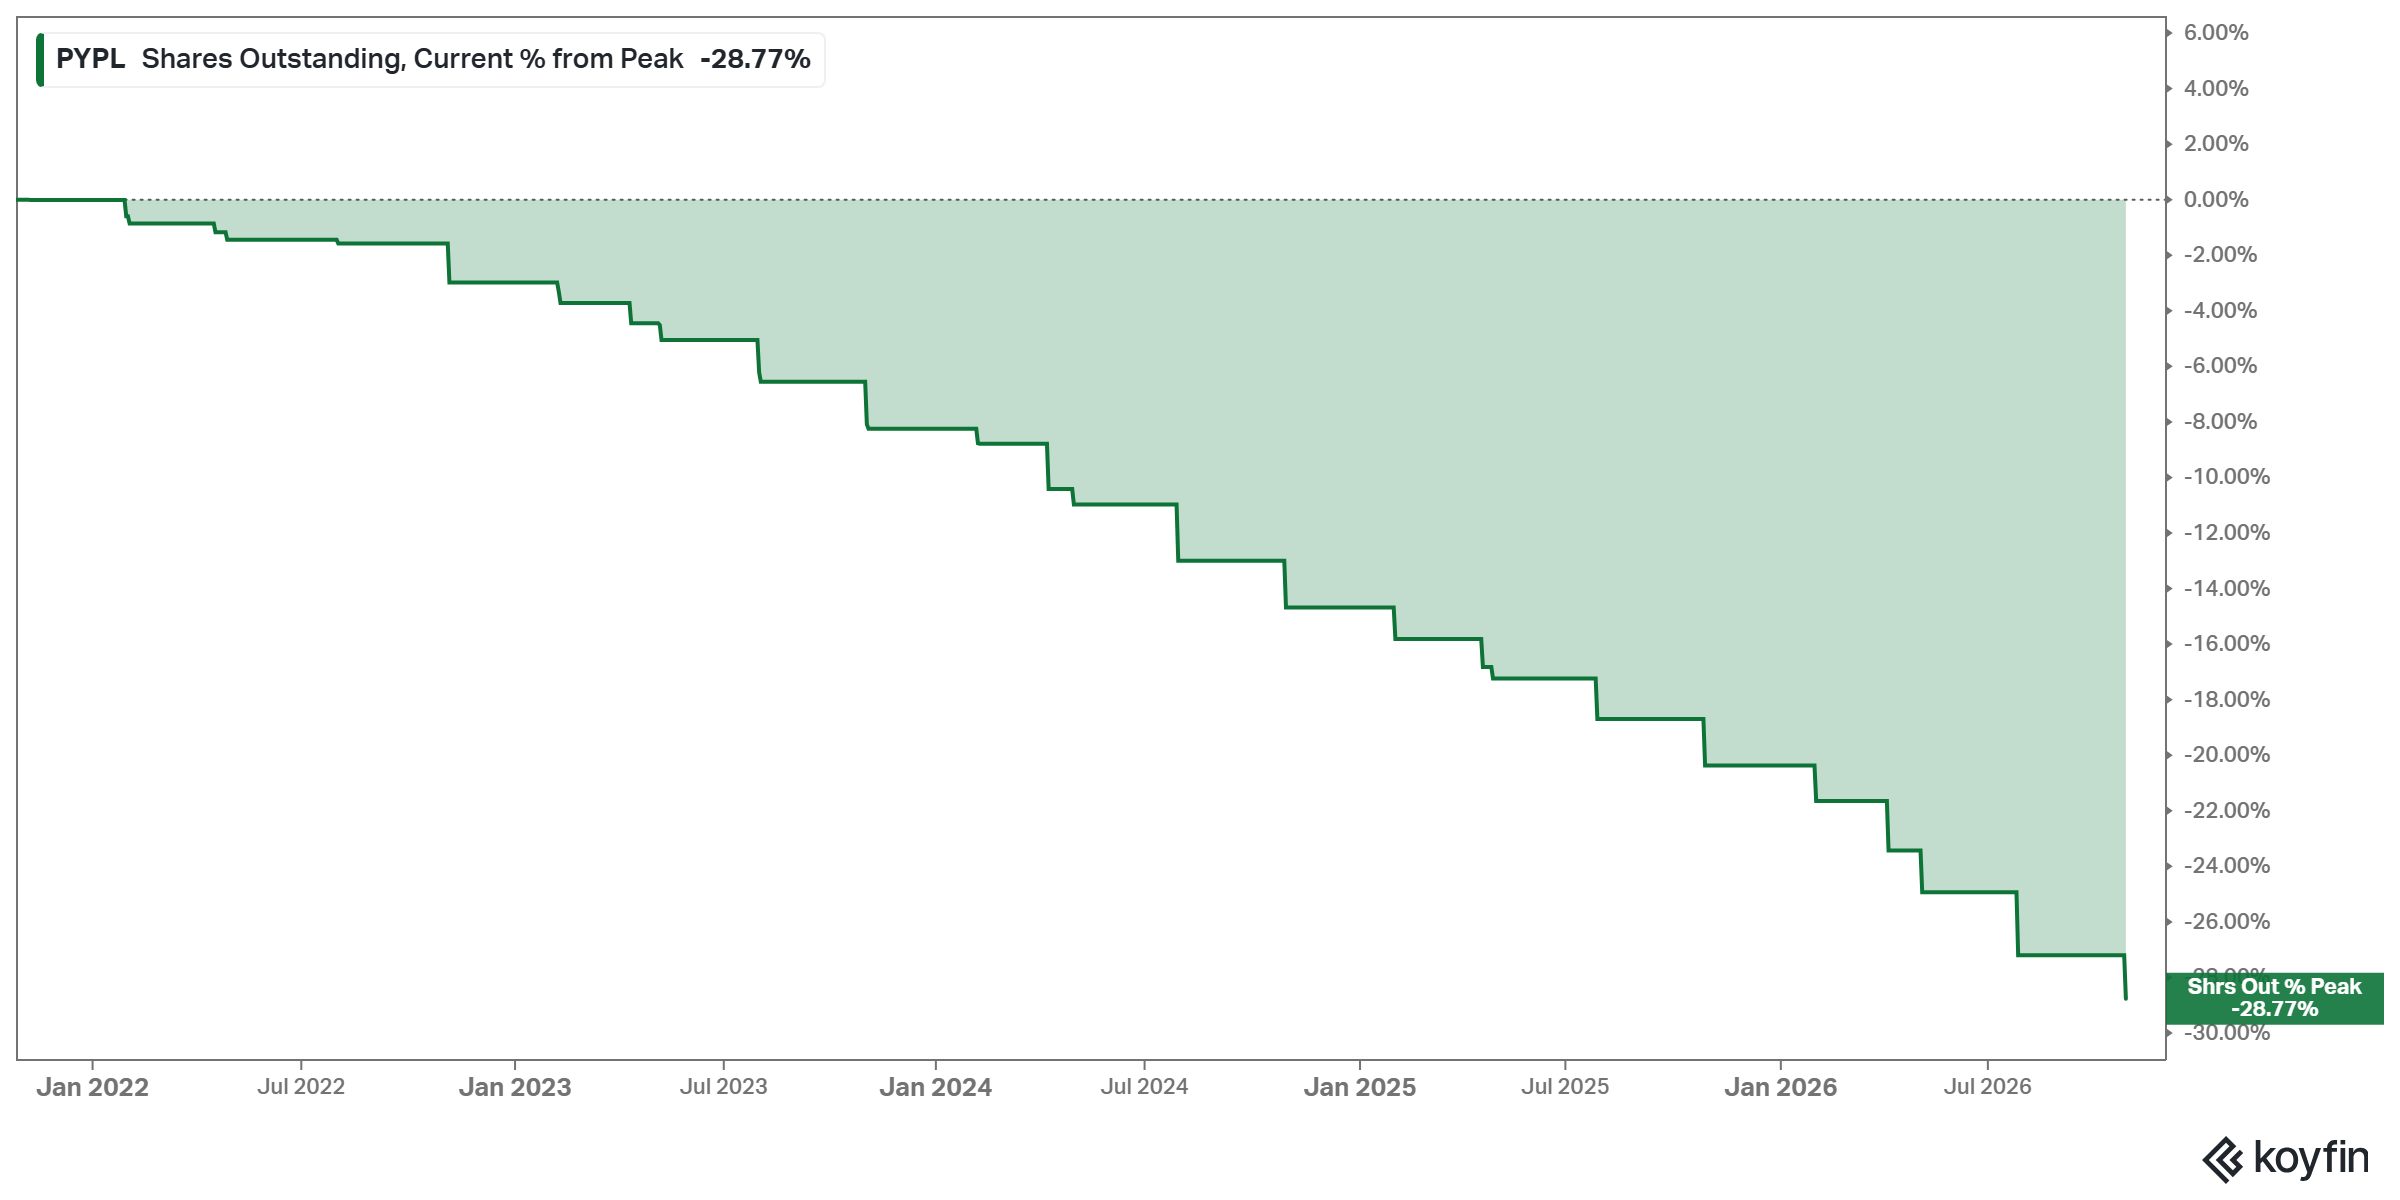
On a TTM basis, the company has returned $6.0B through buybacks, retiring ~117M shares and reducing its weighted average diluted share count by 11% Y/Y, bringing the decline in shares outstanding to 28.8% over the past five years. With ~$6B in repurchases still on track for this year and the stock trading at just ~9.4x management’s 2027 EPS target, few uses of capital can match the return on buying back its own shares. Management is well aware, stating plainly that any acquisition must clear the bar of simply buying back more stock.
The market has made clear it wants to see the button turn before it gives PayPal credit for the turnaround. We think investors are waiting for the wrong signal. The business that will drive PayPal’s next decade of earnings is already taking shape in Venmo, BNPL, Braintree, and financial services, while the company retires 3%+ of its shares every quarter at a single-digit multiple. By the time branded checkout finally gives those on the sidelines the green light they are looking for, we suspect investors will be paying a very different price for it.
Q3 Earnings Breakdown
10 Key Points
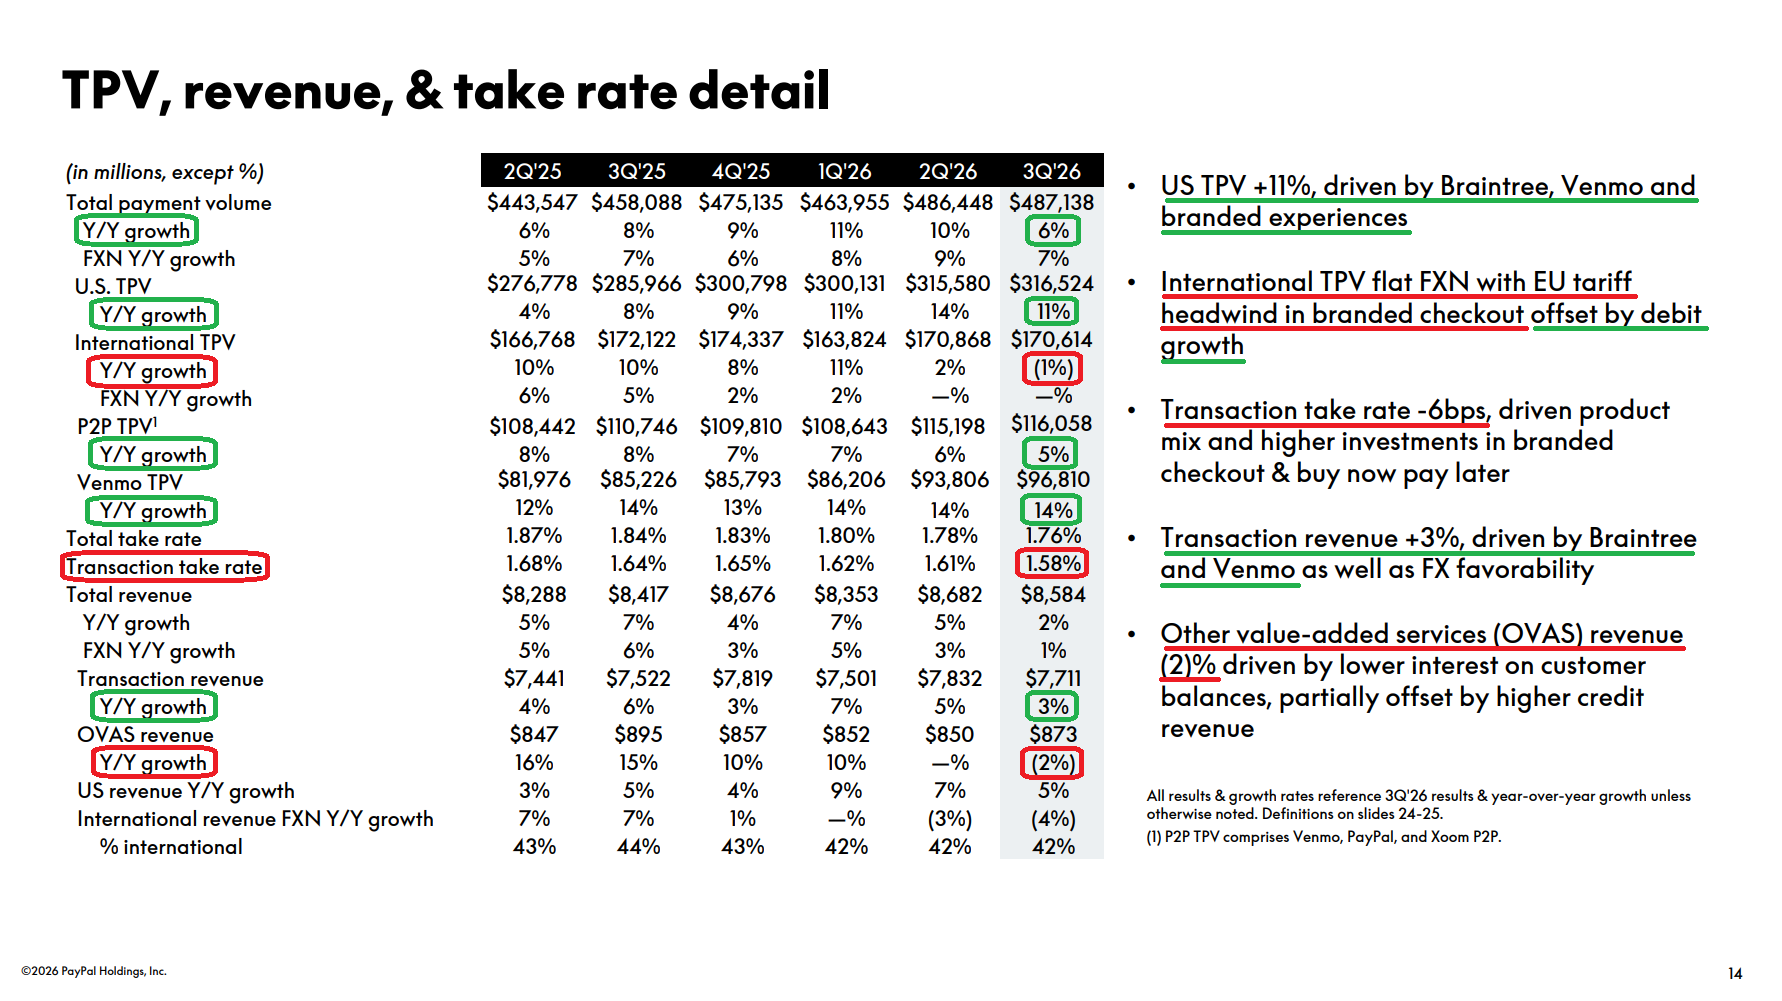
1) PayPal reported Q3 revenue of $8.58B (+2% Y/Y, +1% FXN), missing consensus of ~$8.71B by ~$126M. Transaction revenue grew 3% to $7.71B, while other value-added services revenue declined 2% to $873M as lower interest on customer balances more than offset higher credit revenue. By geography, U.S. revenue grew 5% to $5.0B, with international revenue declining 2% on a reported basis and 4% on an FXN basis to $3.58B. Non-GAAP EPS of $1.45 grew 8% Y/Y, beating the ~$1.31 consensus by $0.14 and coming in well ahead of management’s own guidance for a low-single-digit decline.
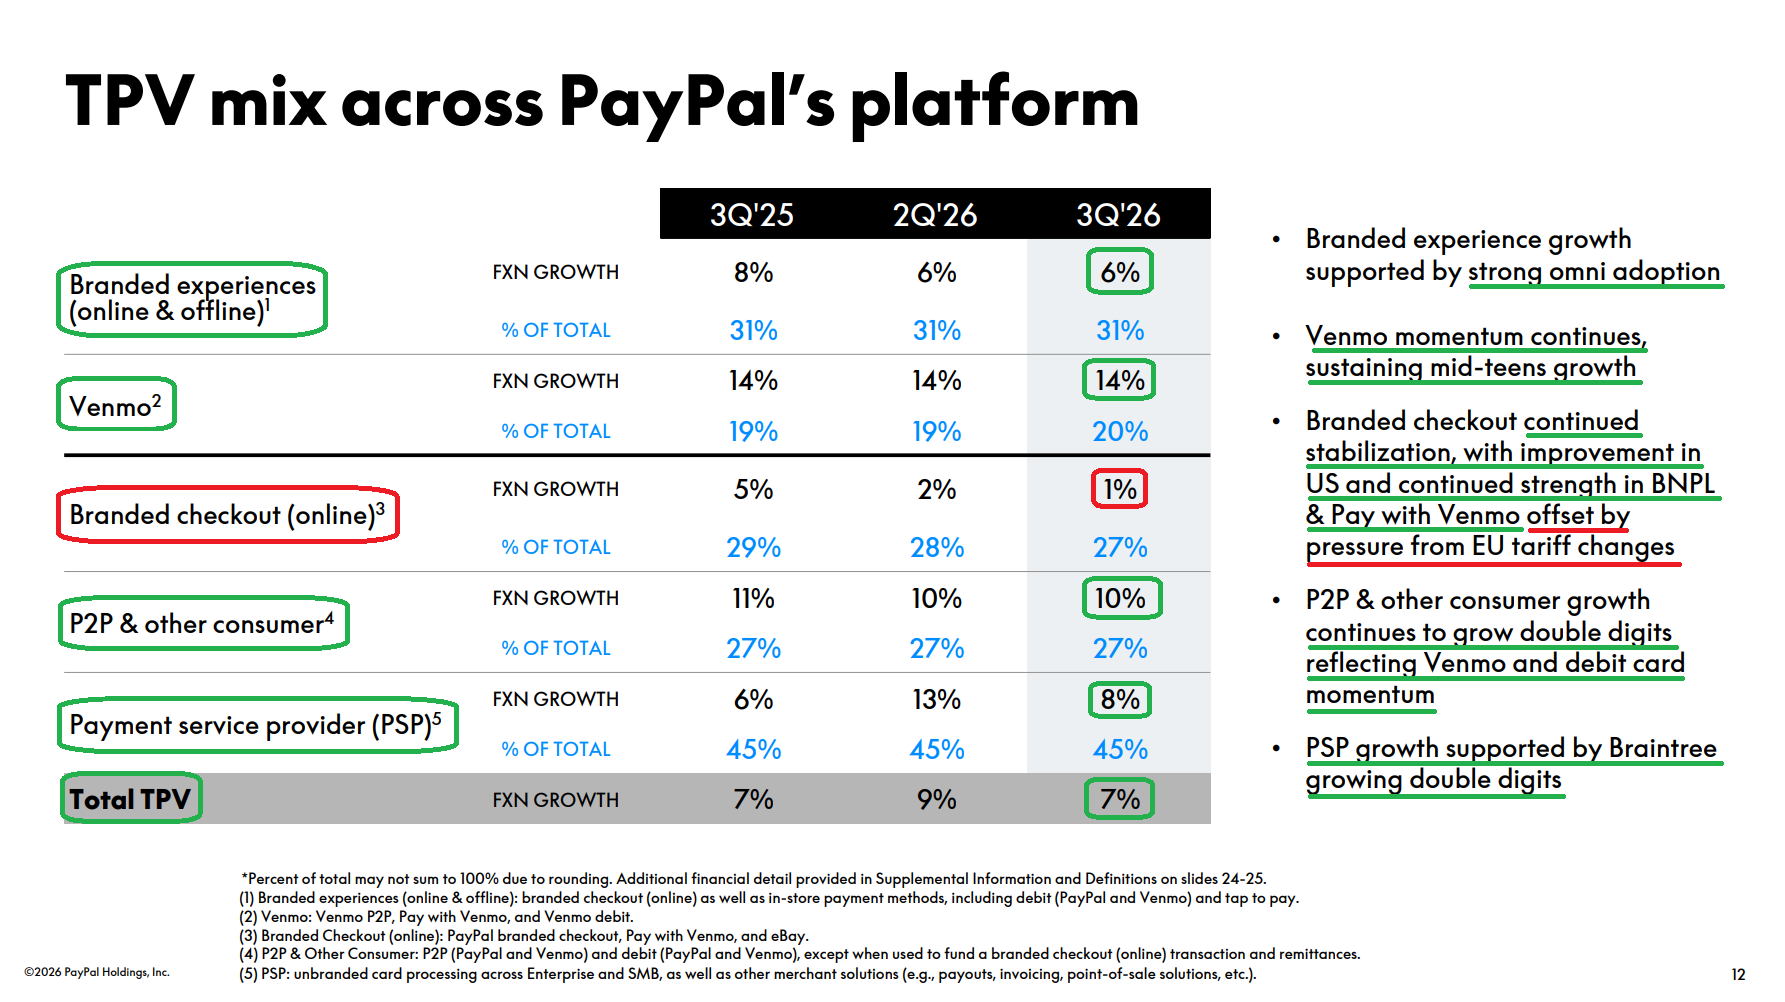
2) Venmo TPV grew 14% Y/Y to a record $96.81B, ahead of Street expectations of ~11%, marking an eighth consecutive quarter of double-digit growth. Adoption of its monetized products continued to grow, led by a >55% increase in debit card monthly active accounts to 6.7M (including a record 1.6M first-time users) alongside 43% growth in Pay with Venmo TPV. Monthly active accounts using both products nearly doubled Y/Y, while newer cohorts are activating the debit card faster than ever, helping drive double-digit ARPA growth during the quarter. Monetization still has a long runway ahead, as only 23% of Venmo customers currently use its financial services even though debit card users generate 5-6x the ARPA of P2P-only users.
3) Online branded checkout TPV grew 1% FXN, slightly below Street expectations of ~2% and down from 2% in Q2, holding within the 1-2% range for a fourth consecutive quarter. The removal of the EU de minimis tax exemption created ~70 bps of headwind, offsetting a third straight quarter of improvement in the U.S. along with continued strength in BNPL (+25%) and Pay with Venmo (+43%), both of which outpaced the market. Branded experiences TPV, which adds PayPal and Venmo debit and tap-to-pay to online checkout, grew 6% FXN, in line with Q2, supported by U.S. debit TPV growth of more than 60%. Management is seeing early traction from its merchant playbook of updated checkout pages, biometrics, vaulted payment methods, upstream BNPL messaging, and co-marketing, with PayPal improving its relative share across 11 large merchants that make up ~20% of U.S. branded volume. For Q4, it expects branded checkout growth to hold at 1-2% as European headwinds persist.
4) PSP TPV grew 8% FXN, slowing from 13% in Q2, with the segment holding steady at ~45% of total TPV. Braintree TPV grew 10%, down from mid-teens growth last quarter, supported by profitable front-book wins, high retention, and expansion within its existing merchant base as management continues to prioritize profitable growth over volume. That focus has Braintree making an important contribution to TM$ growth, with management now looking to lift yield through higher attachment of value-added services such as payouts, risk as a service, invoicing, and merchant lending. Attach rates rose to 6% from 5% a year ago, with management seeing significant room for further improvement. To drive it, PayPal is building a specialized sales force dedicated solely to selling value-added services, which management expects to support margin expansion over time.
5) Total payment volume reached a record $487.14B (+6% reported, +7% FXN), missing consensus of ~$491.3B by ~$4.2B and slowing from 9% FXN growth in Q2. Venmo led growth at +14%, followed by P2P and other consumer at +10% and PSP at +8%, with branded experiences (+6%) and branded checkout (+1%) trailing, all on an FXN basis. The U.S. continued to drive the business, with TPV up 11% to $316.52B on strength in Braintree, Venmo, and branded experiences. International TPV declined 1% on a reported basis and was flat on an FXN basis at $170.61B, as the EU tariff headwind in branded checkout offset growth in debit.
6) Transaction margin dollars grew 2% Y/Y to $3.95B, beating consensus of ~$3.89B by ~$60M and topping management’s guidance for slightly positive growth. Excluding interest on customer balances, which fell to $289M from $321M, TM$ grew 3% to $3.66B. Venmo, Braintree, and FX favorability drove the growth, more than offsetting continued strategic investments in branded checkout and BNPL habituation. Transaction margin expanded 3 bps Y/Y to 46.0%, its first Y/Y expansion after four straight quarters of contraction. Lower costs helped on both fronts. The transaction expense rate improved 2 bps to 0.87% on favorable mix and partner incentives, while the transaction and credit loss rate fell to 0.08% from 0.11% on lower fraud losses, risk mitigation, and disciplined underwriting.
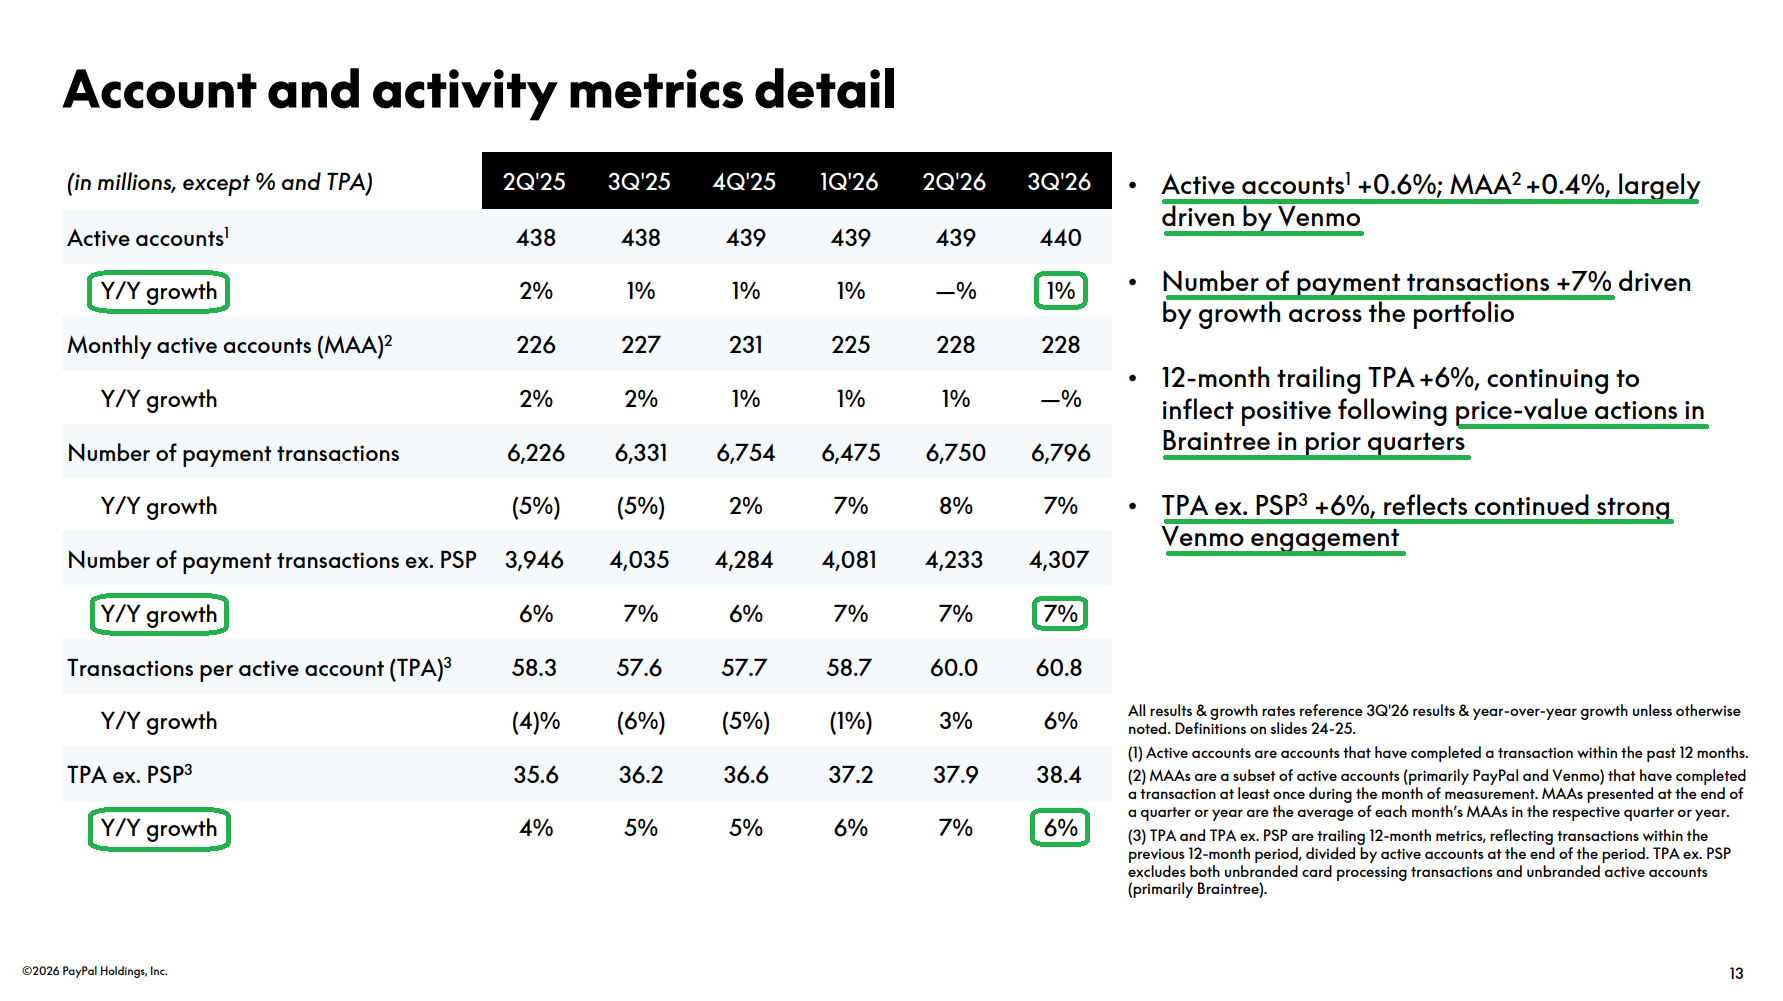
7) Total active accounts reached 440M, up 0.6% Y/Y and 0.4% (~1.6M) sequentially, returning to growth after slight sequential declines in each of the prior two quarters. Monthly active accounts grew 0.4% to 228M, once again led by Venmo. Engagement continued to improve, with transactions per active account on a TTM basis rising 6% to 60.8 as the prior-year Braintree price-to-value actions continued to annualize. Excluding PSP, TPA grew 6% to 38.4 on sustained Venmo engagement. Total payment transactions grew 7% to 6.80B, as well as 7% to 4.31B excluding PSP.
8) PayPal generated adjusted free cash flow of $2.05B, down 10% Y/Y against a strong prior-year comparison, bringing year-to-date adjusted FCF to ~$5.60B. Management put that cash to work by repurchasing $1.5B of stock during the quarter (~28M shares at an average price of ~$54). That brings TTM buybacks to $6.0B (~117M shares) and reduces the weighted average share count by 11% Y/Y, with shares outstanding falling to 837M from 920M at the end of 2025. PayPal also paid ~$120M in dividends, bringing total capital returns for the quarter to ~$1.6B, while declaring another $0.14 per share. The balance sheet remains rock solid, with $15.1B of cash, equivalents, and investments against $13.5B of debt. Management raised full-year adjusted FCF guidance to $6.5B+ from $6B+ (vs. ~$5.84B consensus), implying a ~14% FCF yield on PayPal’s ~$47B market cap, while reiterating plans for ~$6B of buybacks.
9) PayPal is moving faster than planned on its $1.5B+ gross run-rate cost savings program, raising its year-end exit run-rate target to more than $700M from the ~$400M identified last quarter while remaining on track for at least $1.5B over the next 2-3 years. Headcount is down by more than 2,000 (~8% of the workforce), with managerial roles reduced by more than 25% and three organizational layers removed across most of the company. Those efforts helped hold non-transaction operating expense growth to just 1% at $2.34B (vs. ~$2.42B Street), driving non-GAAP operating income up 3% to $1.61B (vs. ~$1.42B consensus) as operating margin expanded 16 bps to 18.8% (vs. ~16.3% consensus). While cautioning against annualizing Q3’s expense performance as growth investments ramp, management lowered its full-year non-transaction operating expense growth outlook to mid-single digits from 7-8%, with the savings expected to fund those investments while supporting operating leverage over time.
10) Management raised full-year 2026 guidance, lifting transaction margin dollars to ~$15.7B (~1.5% growth) from ~$15.6B. Non-GAAP EPS guidance rose to ~$5.60 (+5.5% Y/Y) from ~$5.38, above the ~$5.37 consensus, with plans for ~$6B of buybacks and ~$1B of capex reiterated. For Q4, management expects low-single-digit FXN revenue growth, slightly positive TM$ growth, and online branded checkout TPV growth of 1-2%, with non-GAAP EPS of ~$1.43 (+16% Y/Y) coming in ahead of the ~$1.34 consensus. Looking to 2027, management is targeting non-GAAP EPS growth similar to 2026 despite further investment in TM$ and operating expenses, implying ~$5.91 versus the ~$5.77 consensus, with formal guidance to come on the Q4 call.
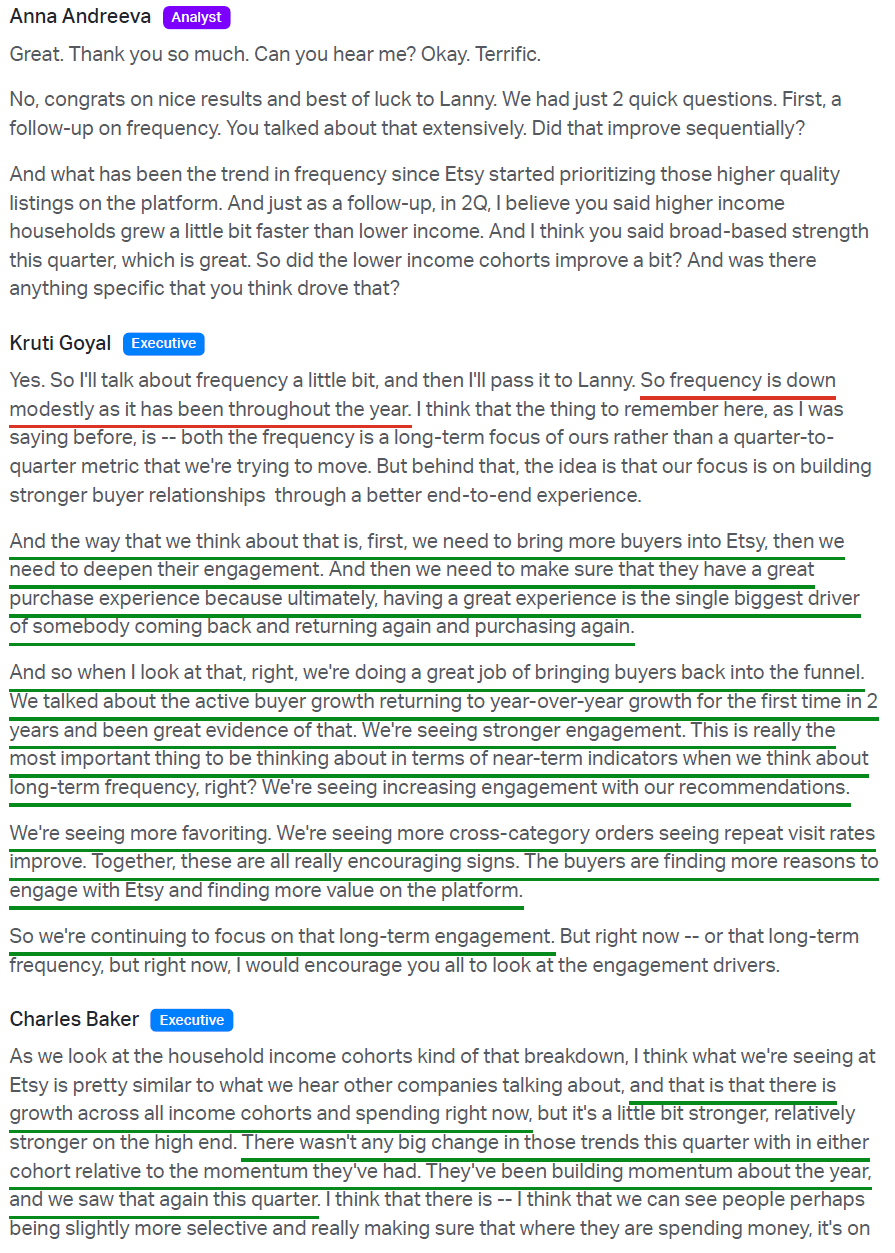
Earnings Call Highlights
Morningstar Analyst Note
Etsy Update
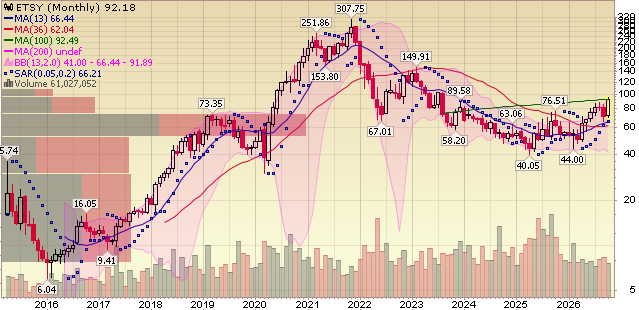
For newer readers, here’s a brief overview of the key drivers behind our Etsy thesis, an asset-light online marketplace inflecting back to growth after digesting the pandemic pull-forward, while aggressively buying back stock along the way:
Company Overview
Founded in 2005. Headquartered in Brooklyn, NY. The leading global online marketplace for unique, handmade, vintage, and craft items.
Two-sided platform: ~5.8M active sellers and ~87.5M active buyers (vs. just 46M in 2019). 100M product listings, mostly non-SKU and artisanal/custom.
$11.92B GMS in 2025 (74% U.S. buyers, 26% non-U.S.).
Revenue $2.88B: marketplace ~69.6% (transaction/payment/listing fees), services ~30.4% (ads/shipping labels/other).
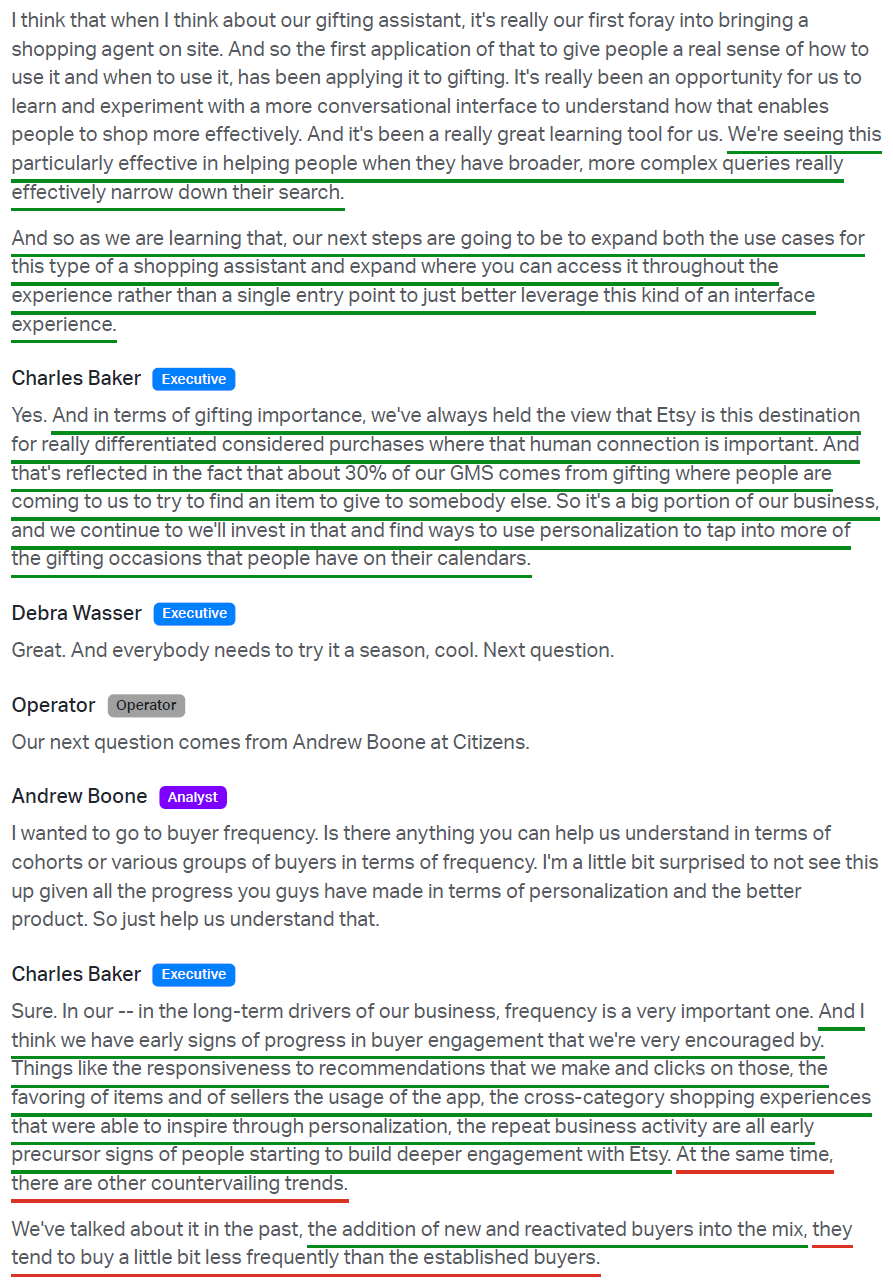
Largest category Home & Living (38% of GMS). ~30% of GMS is made-to-order/custom. ~30% of GMS comes from gifting. 81% of buyers agree Etsy has items found nowhere else; 82% shop to support real people. Insulated from the cheaper/faster fulfillment “race to the bottom.”
Shares down ~69% from the 2021 peak $297/share
~$550B TAM across relevant retail categories.
Management
CEO Kruti Patel Goyal (effective start of 2026).
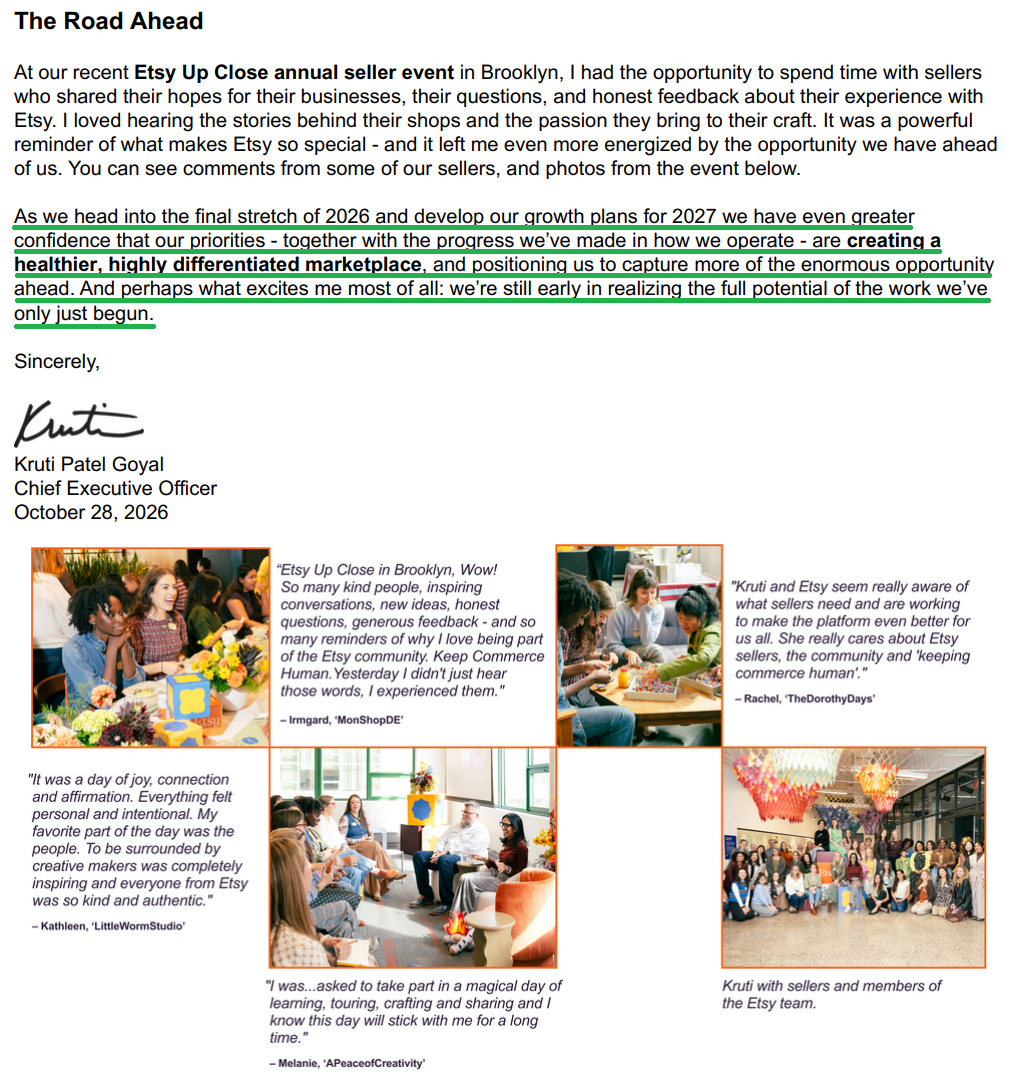
Spent 15+ years at Etsy; former CEO of Depop (GMS/buyer base nearly doubled); most recently President & Chief Growth Officer.
Josh Silverman (CEO since 2017) becomes Executive Chair through the end of 2026 for a smooth transition.
CFO Lanny Baker departing March 1, 2027, staying on as an advisor through July 1, 2027; executive search firm retained for his successor.
Returning to Growth
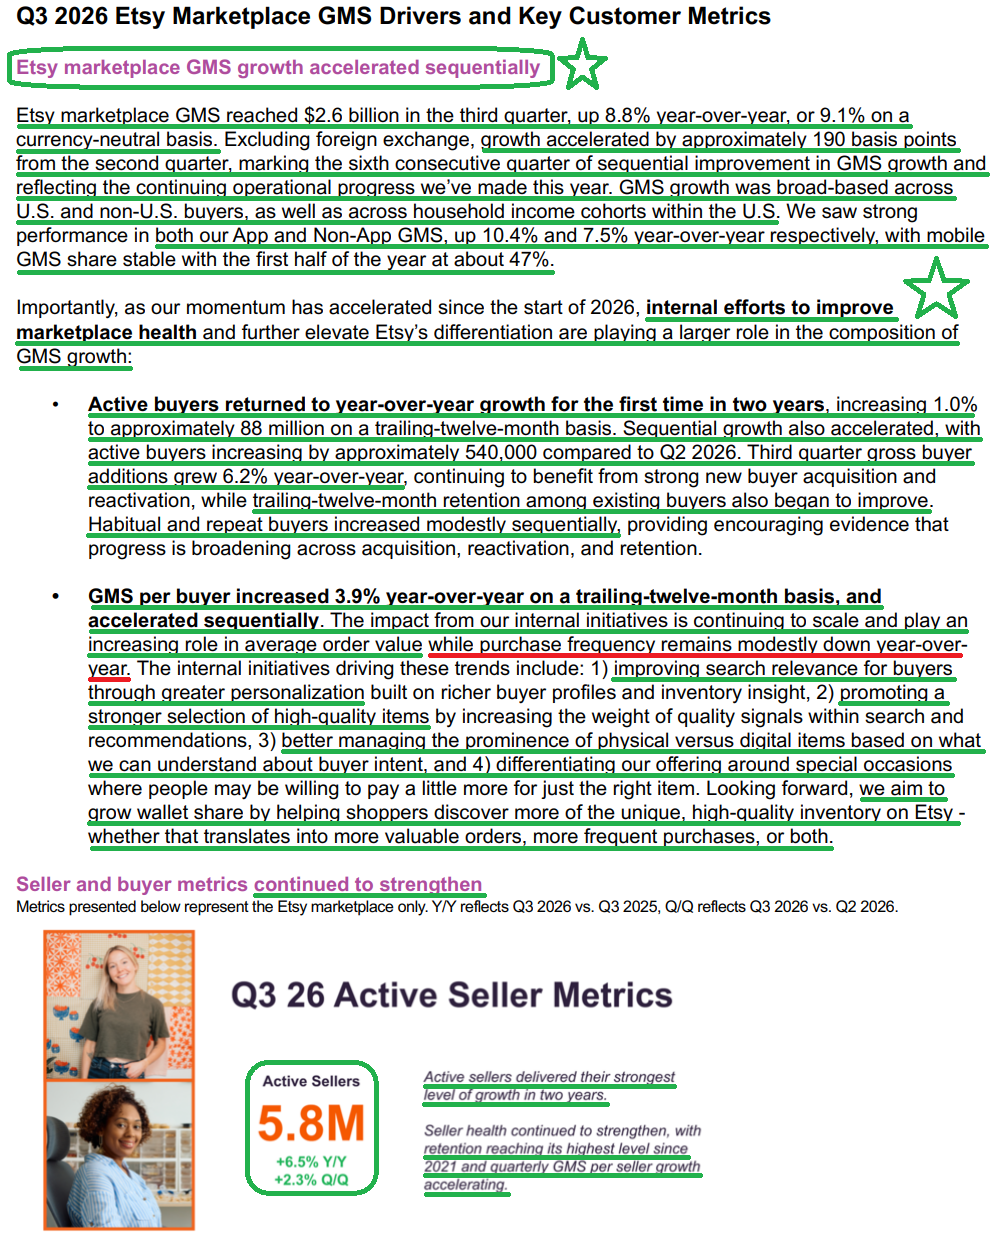
Etsy marketplace GMS +8.8% Y/Y to $2.65B in Q3 2026 (+9.1% currency neutral), the fourth consecutive quarter of Y/Y growth. Ex-FX, growth accelerated ~190 bps from Q2, the sixth consecutive quarter of sequential improvement, with the growth rate up more than 11 percentage points from the -2.4% posted a year ago.
Growth broad-based across U.S. and non-U.S. buyers and all U.S. household income cohorts, with internal initiatives playing a larger role as external tailwinds (FX, tariff-driven listing prices, easy comps) fade. Personalization alone contributed ~2 percentage points to annualized GMS growth by Q3.
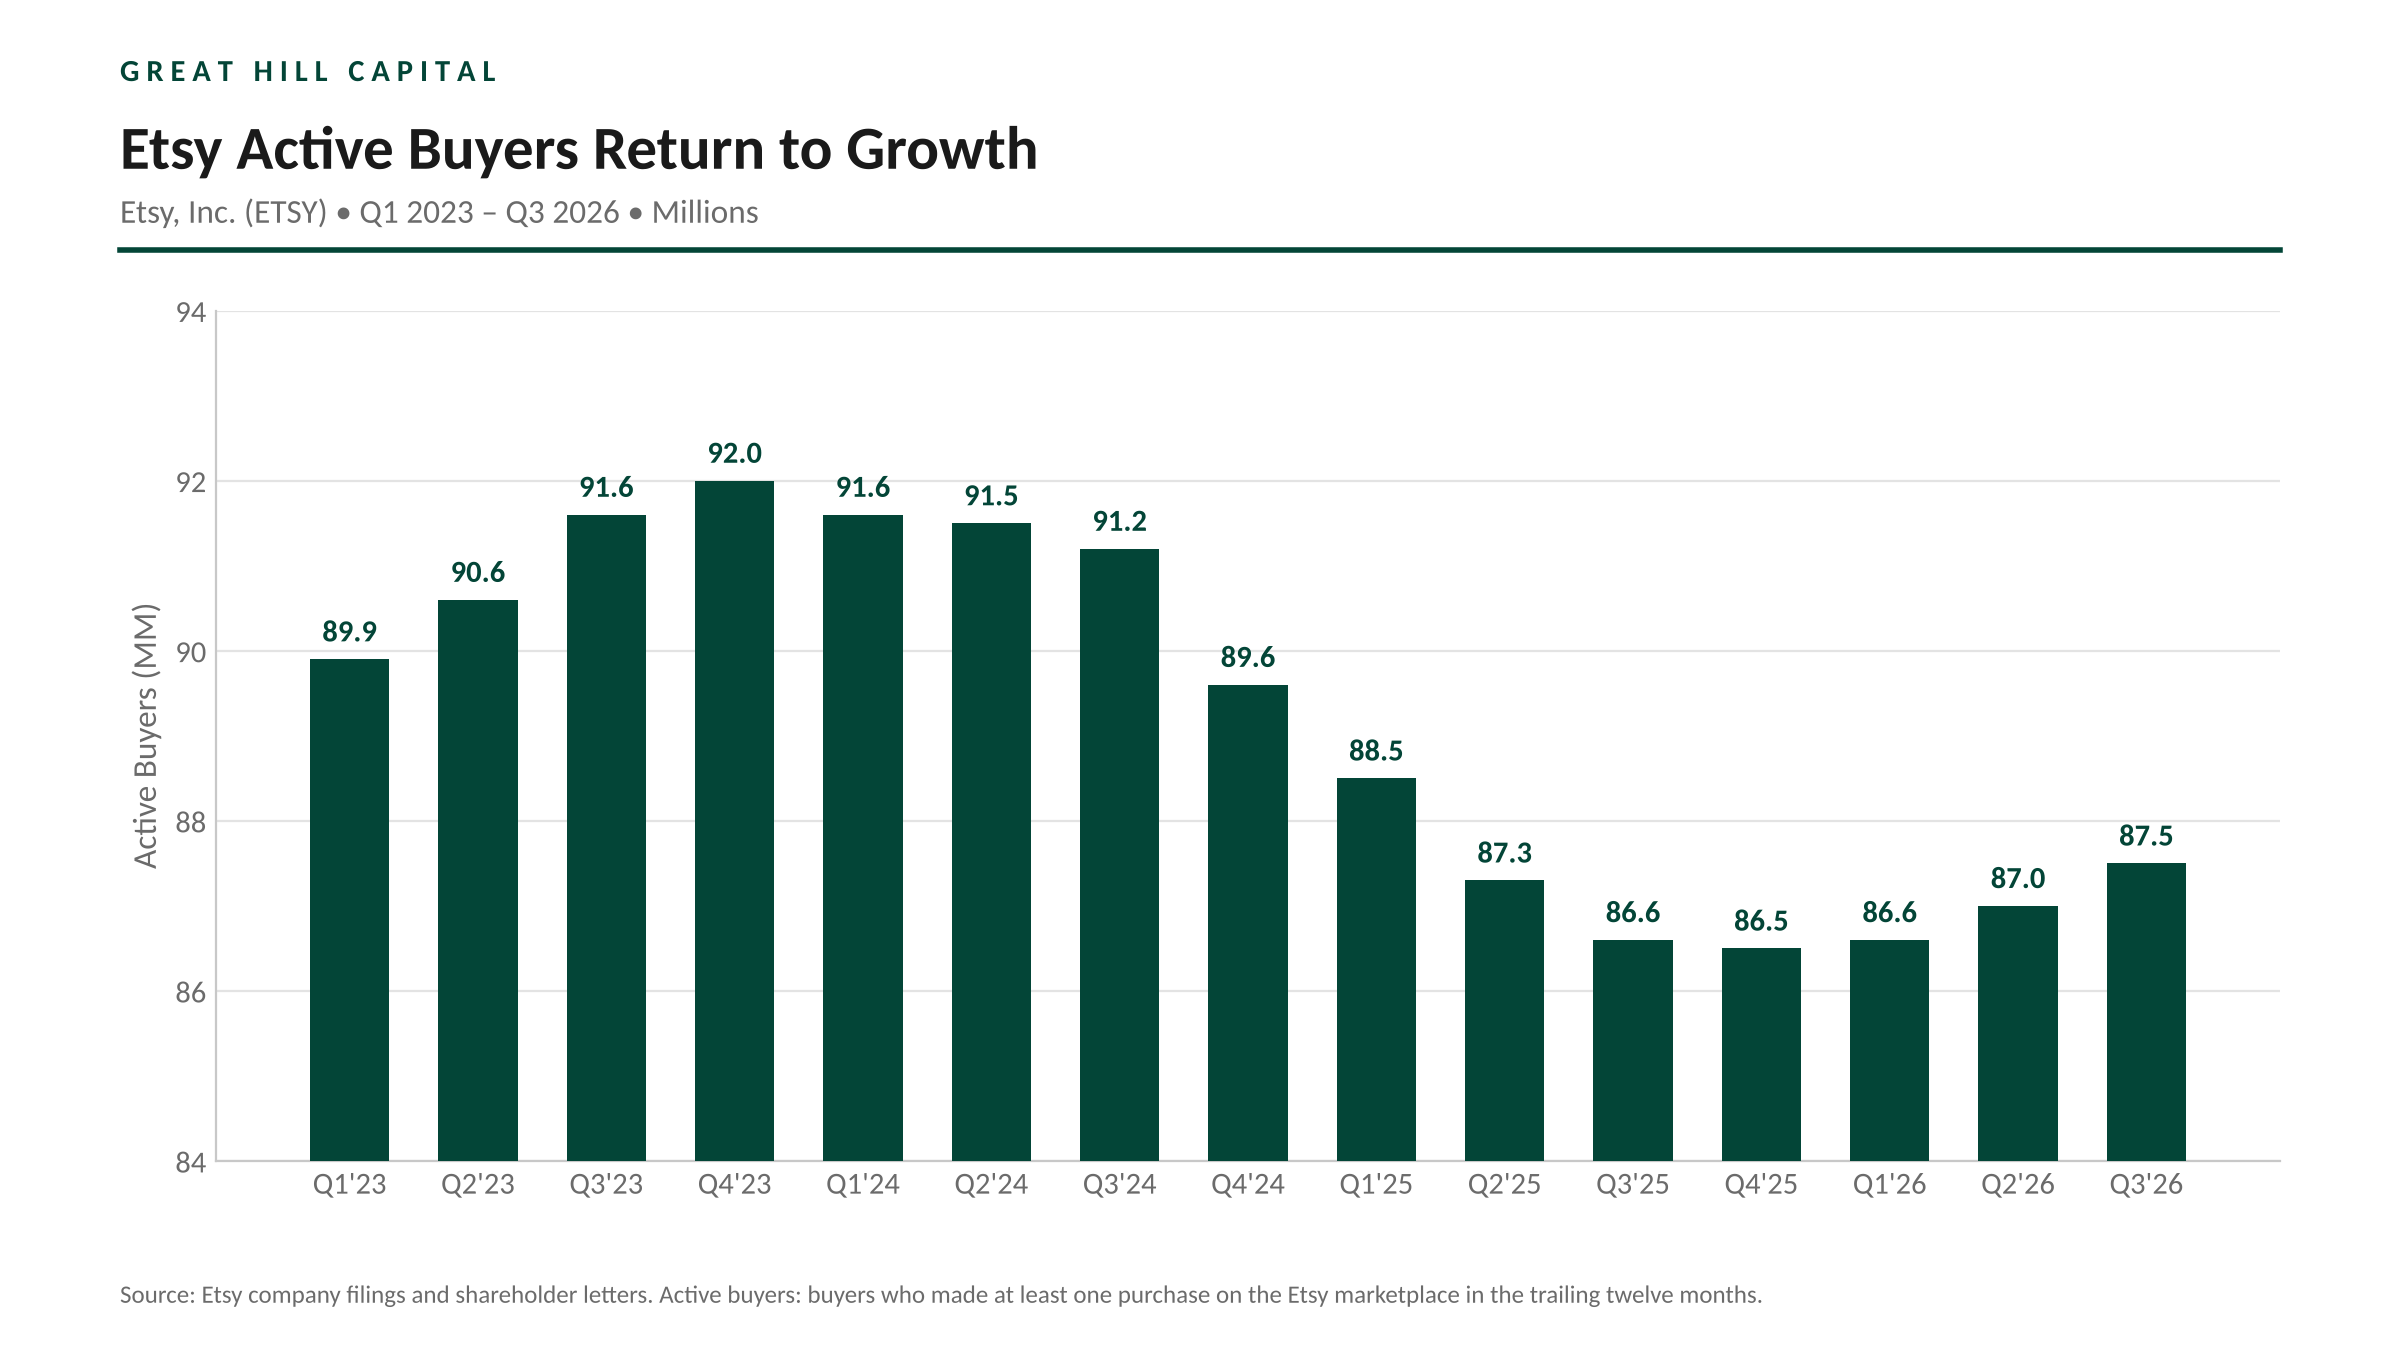
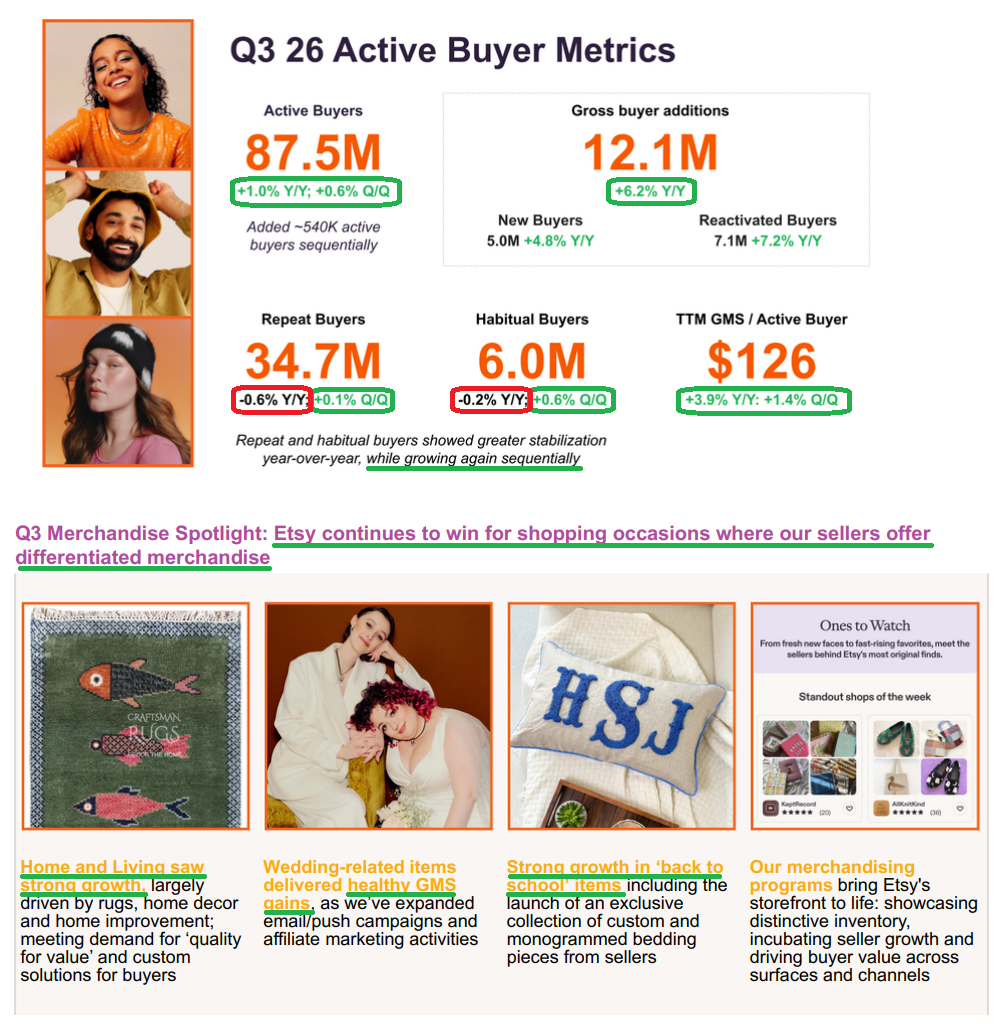
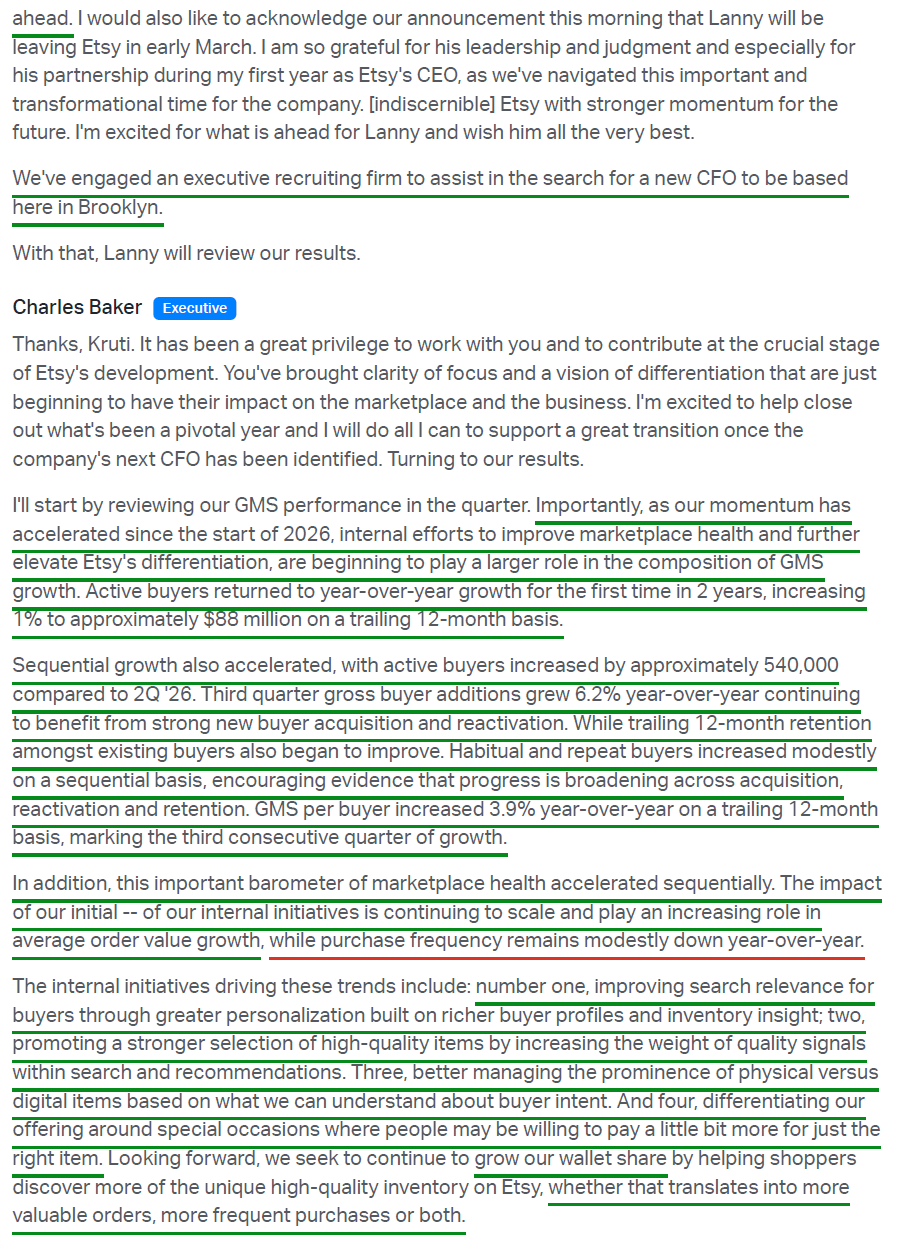
Active buyers returned to Y/Y growth for the first time in two years, rising +1.0% to 87.5M (+540K sequentially), with gross buyer additions (new + reactivated) of 12.1M (+6.2% Y/Y; new buyers 5.0M +4.8%, reactivated 7.1M +7.2%).
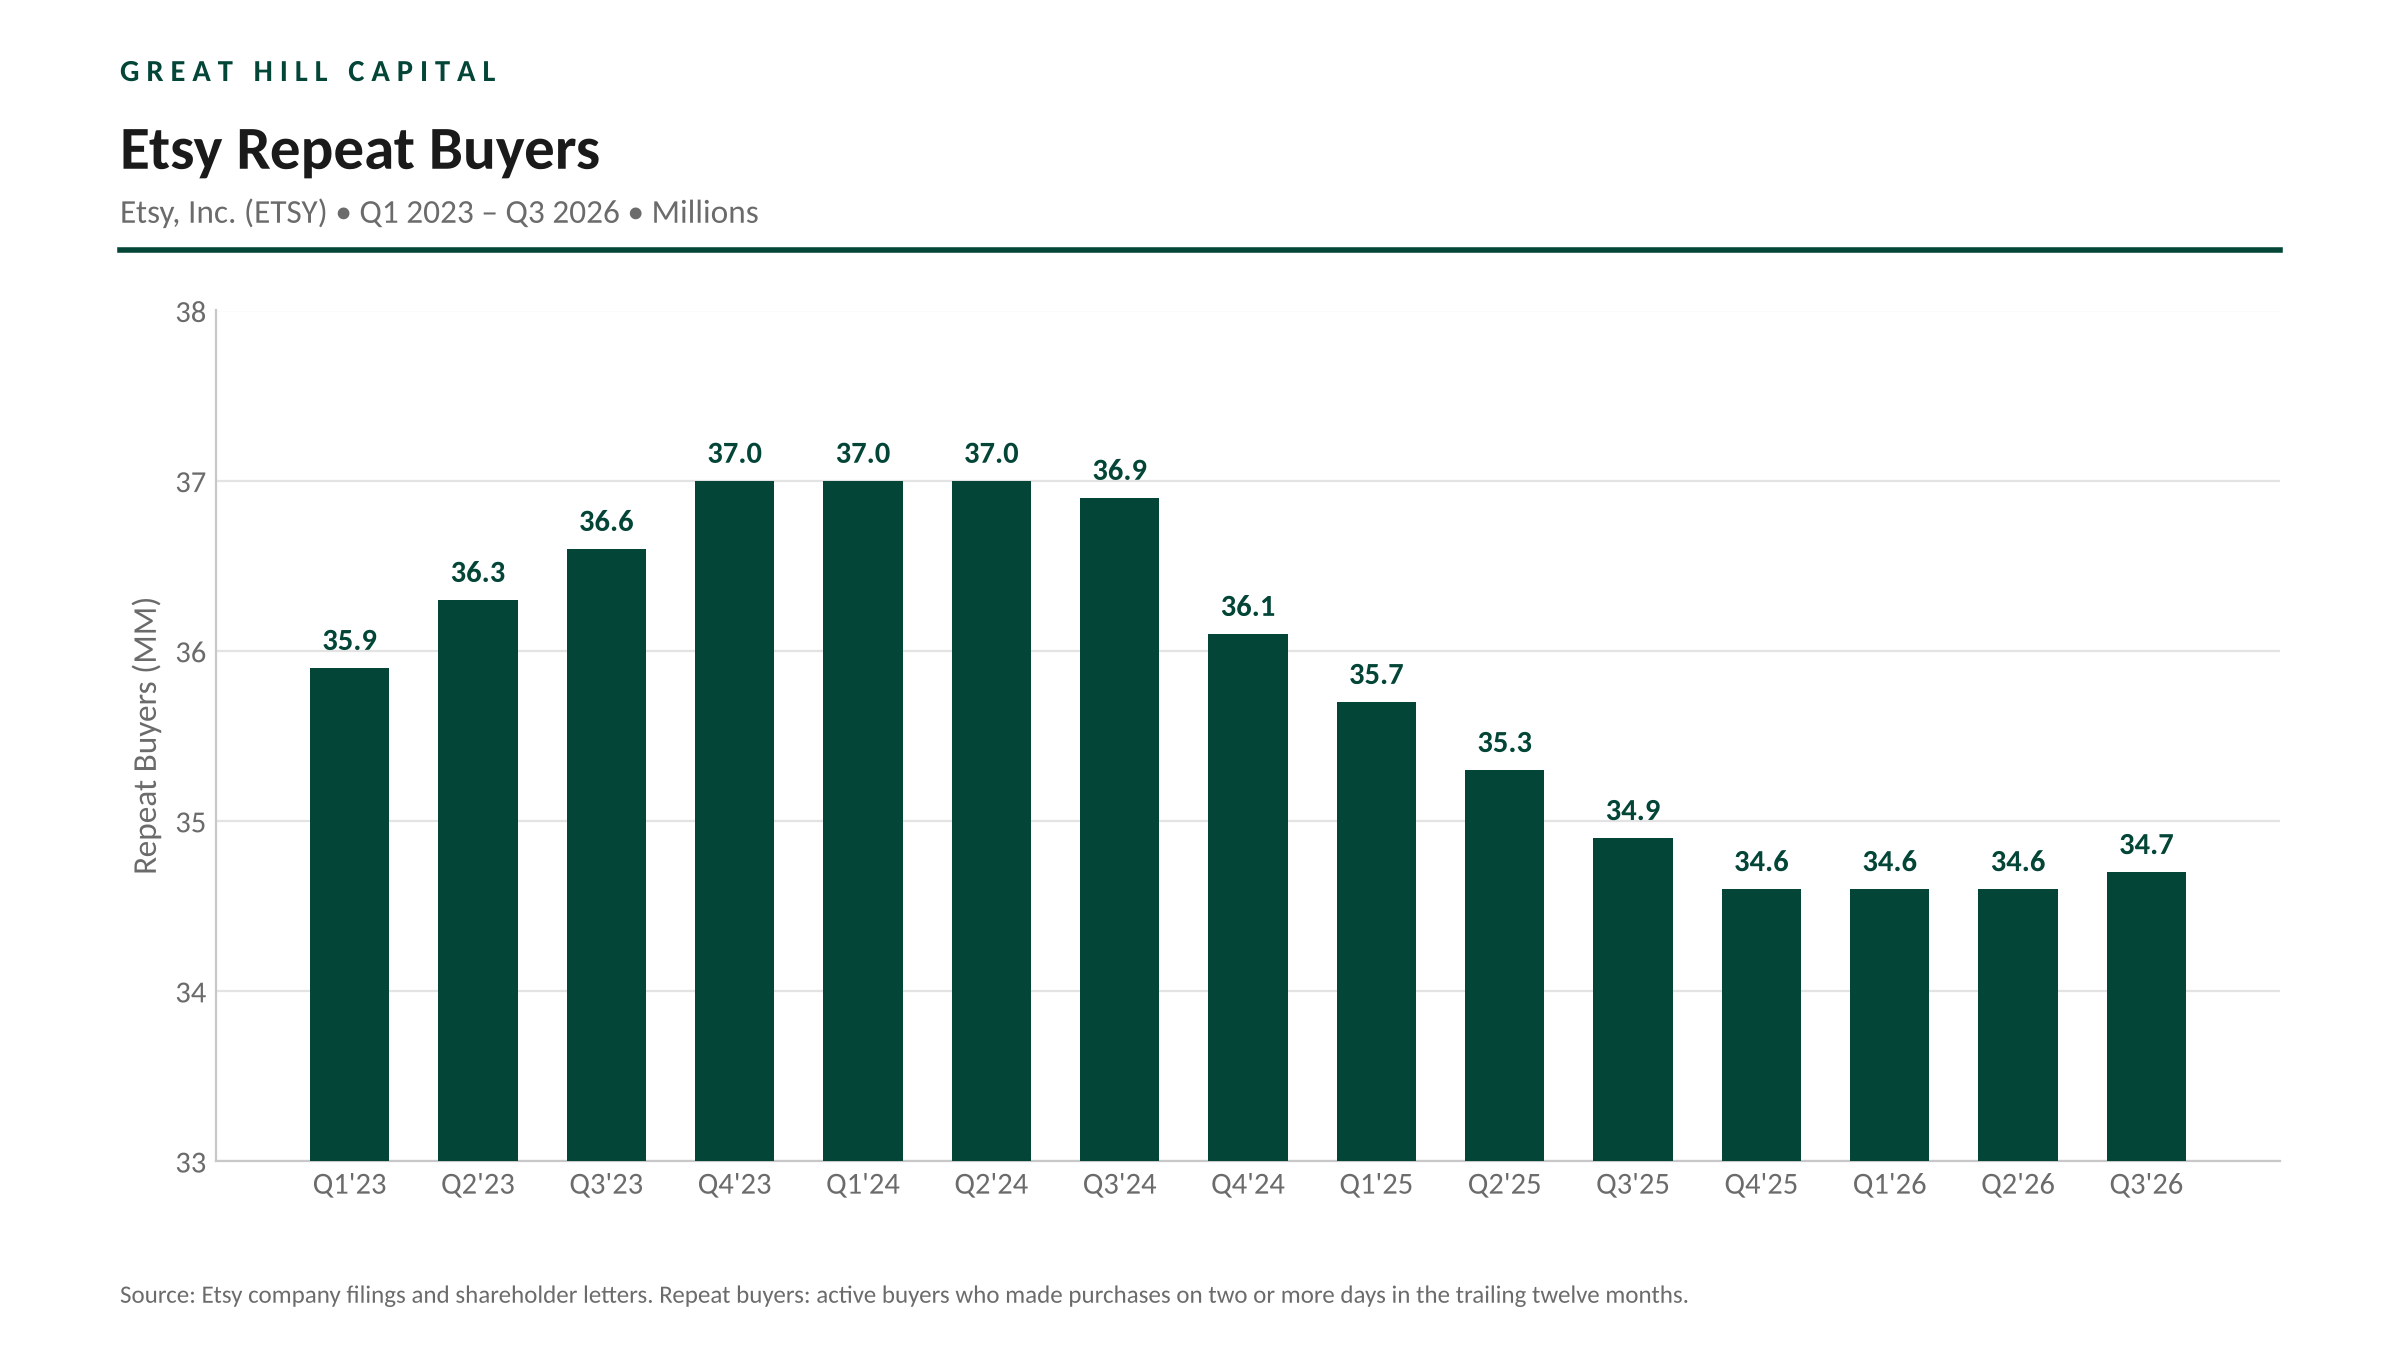
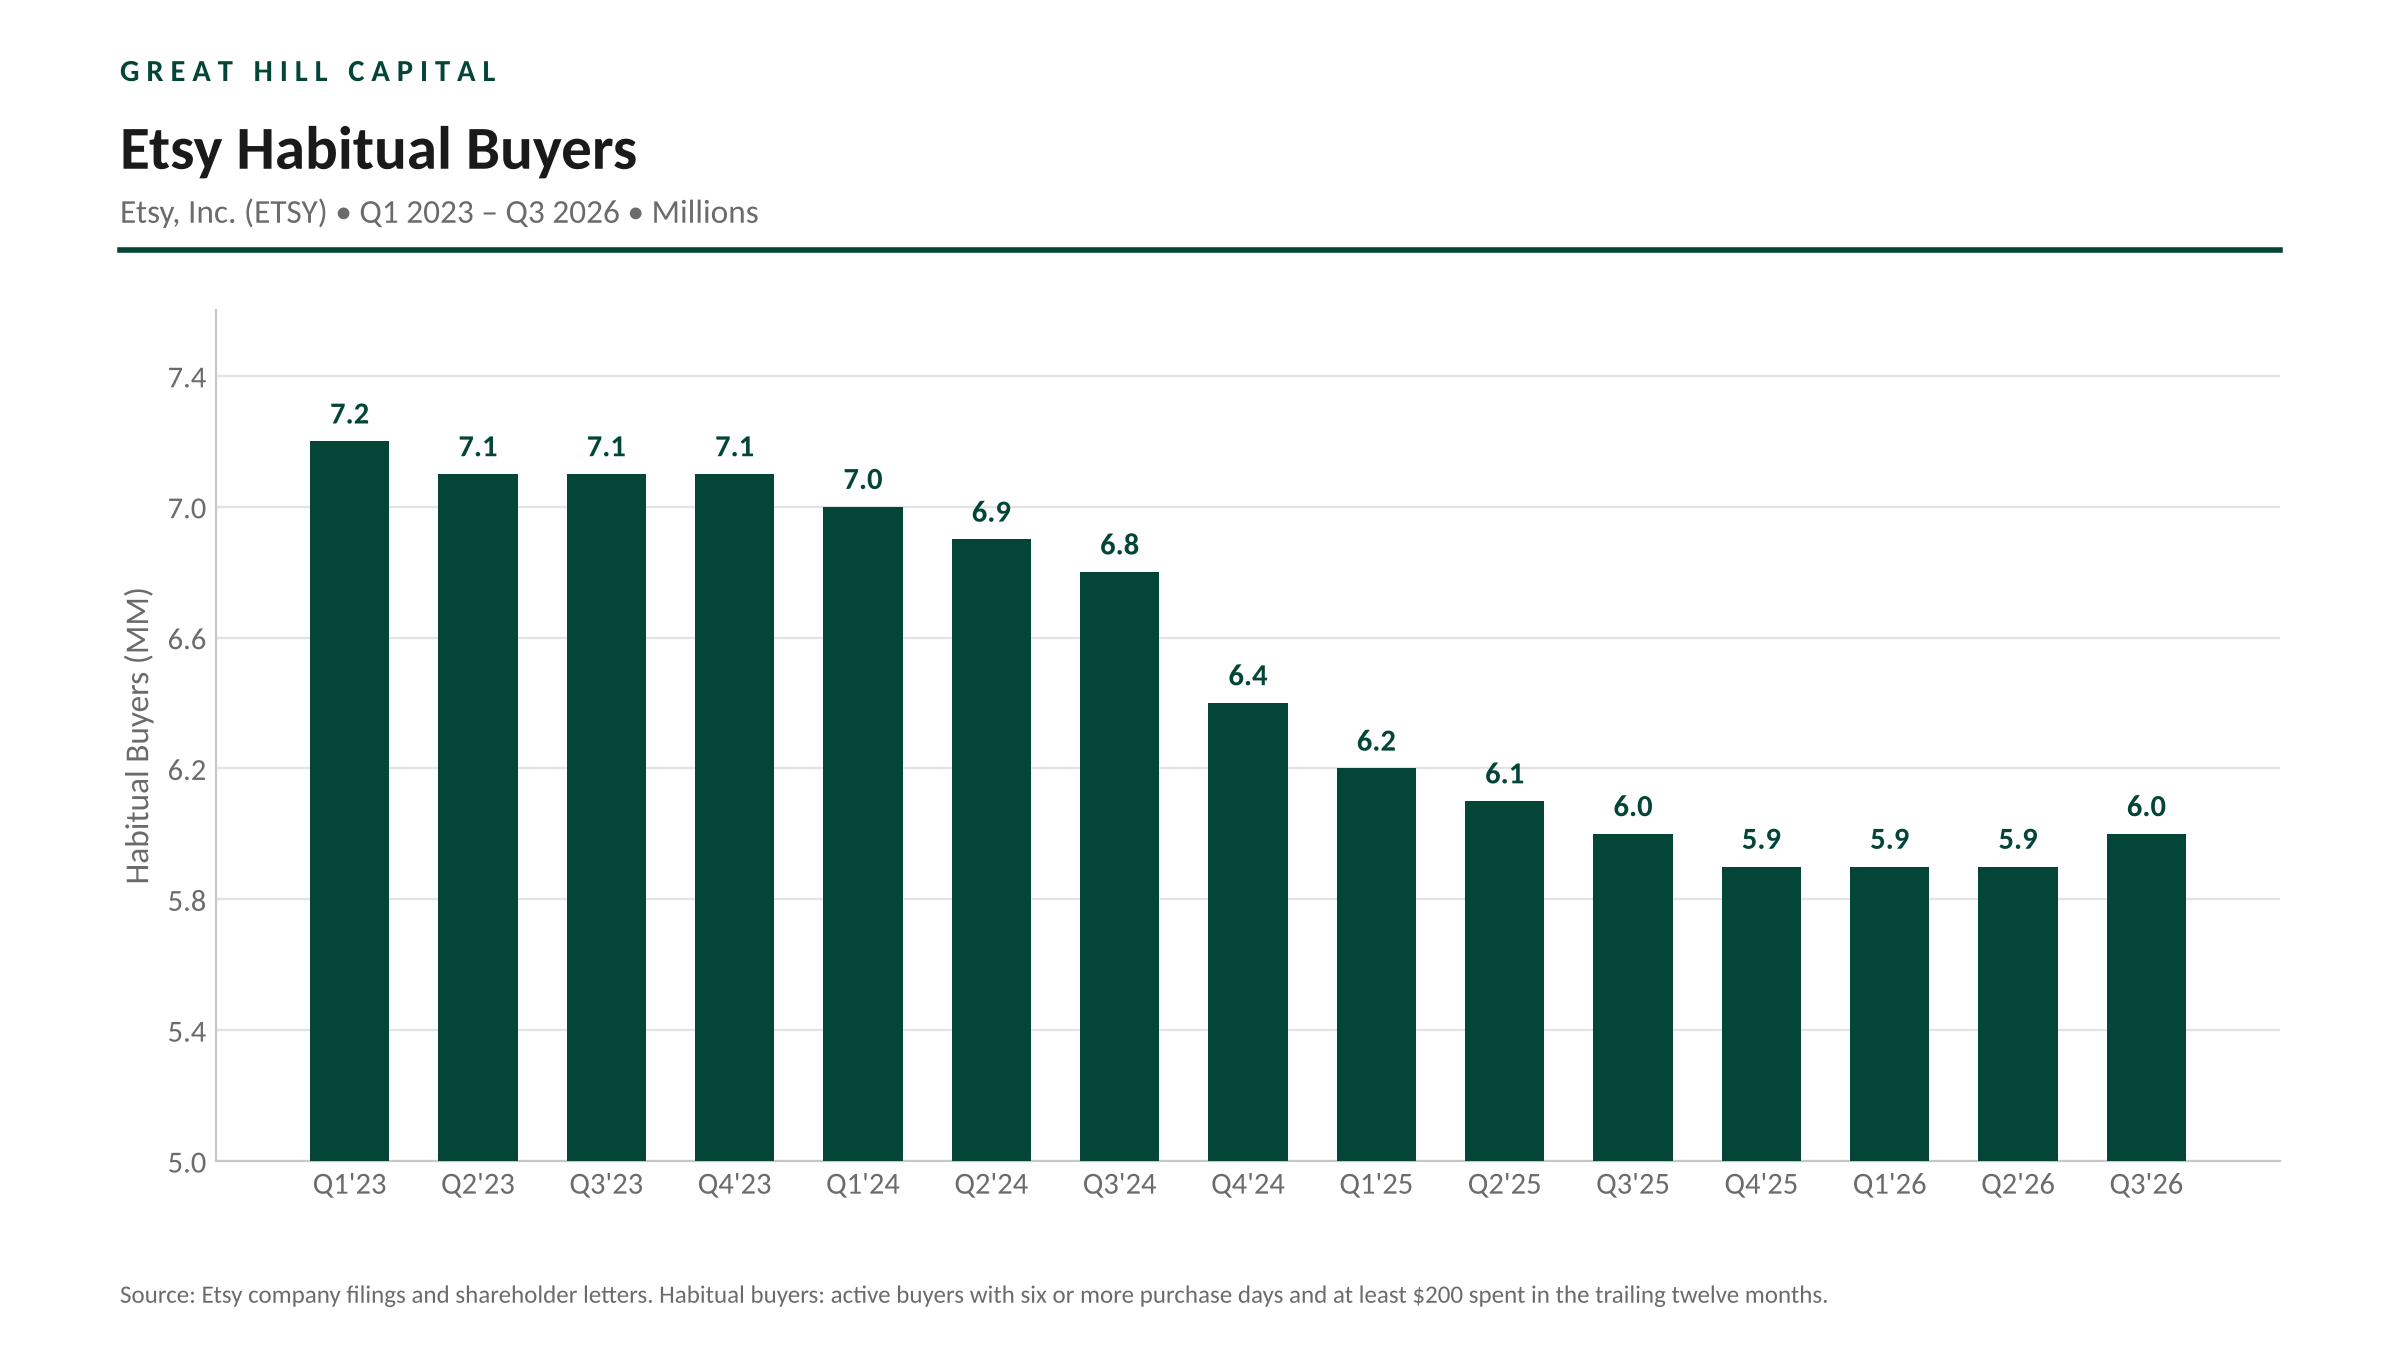
Repeat buyers 34.7M and habitual buyers 6.0M each grew sequentially for the second straight quarter, with TTM retention among existing buyers beginning to improve.
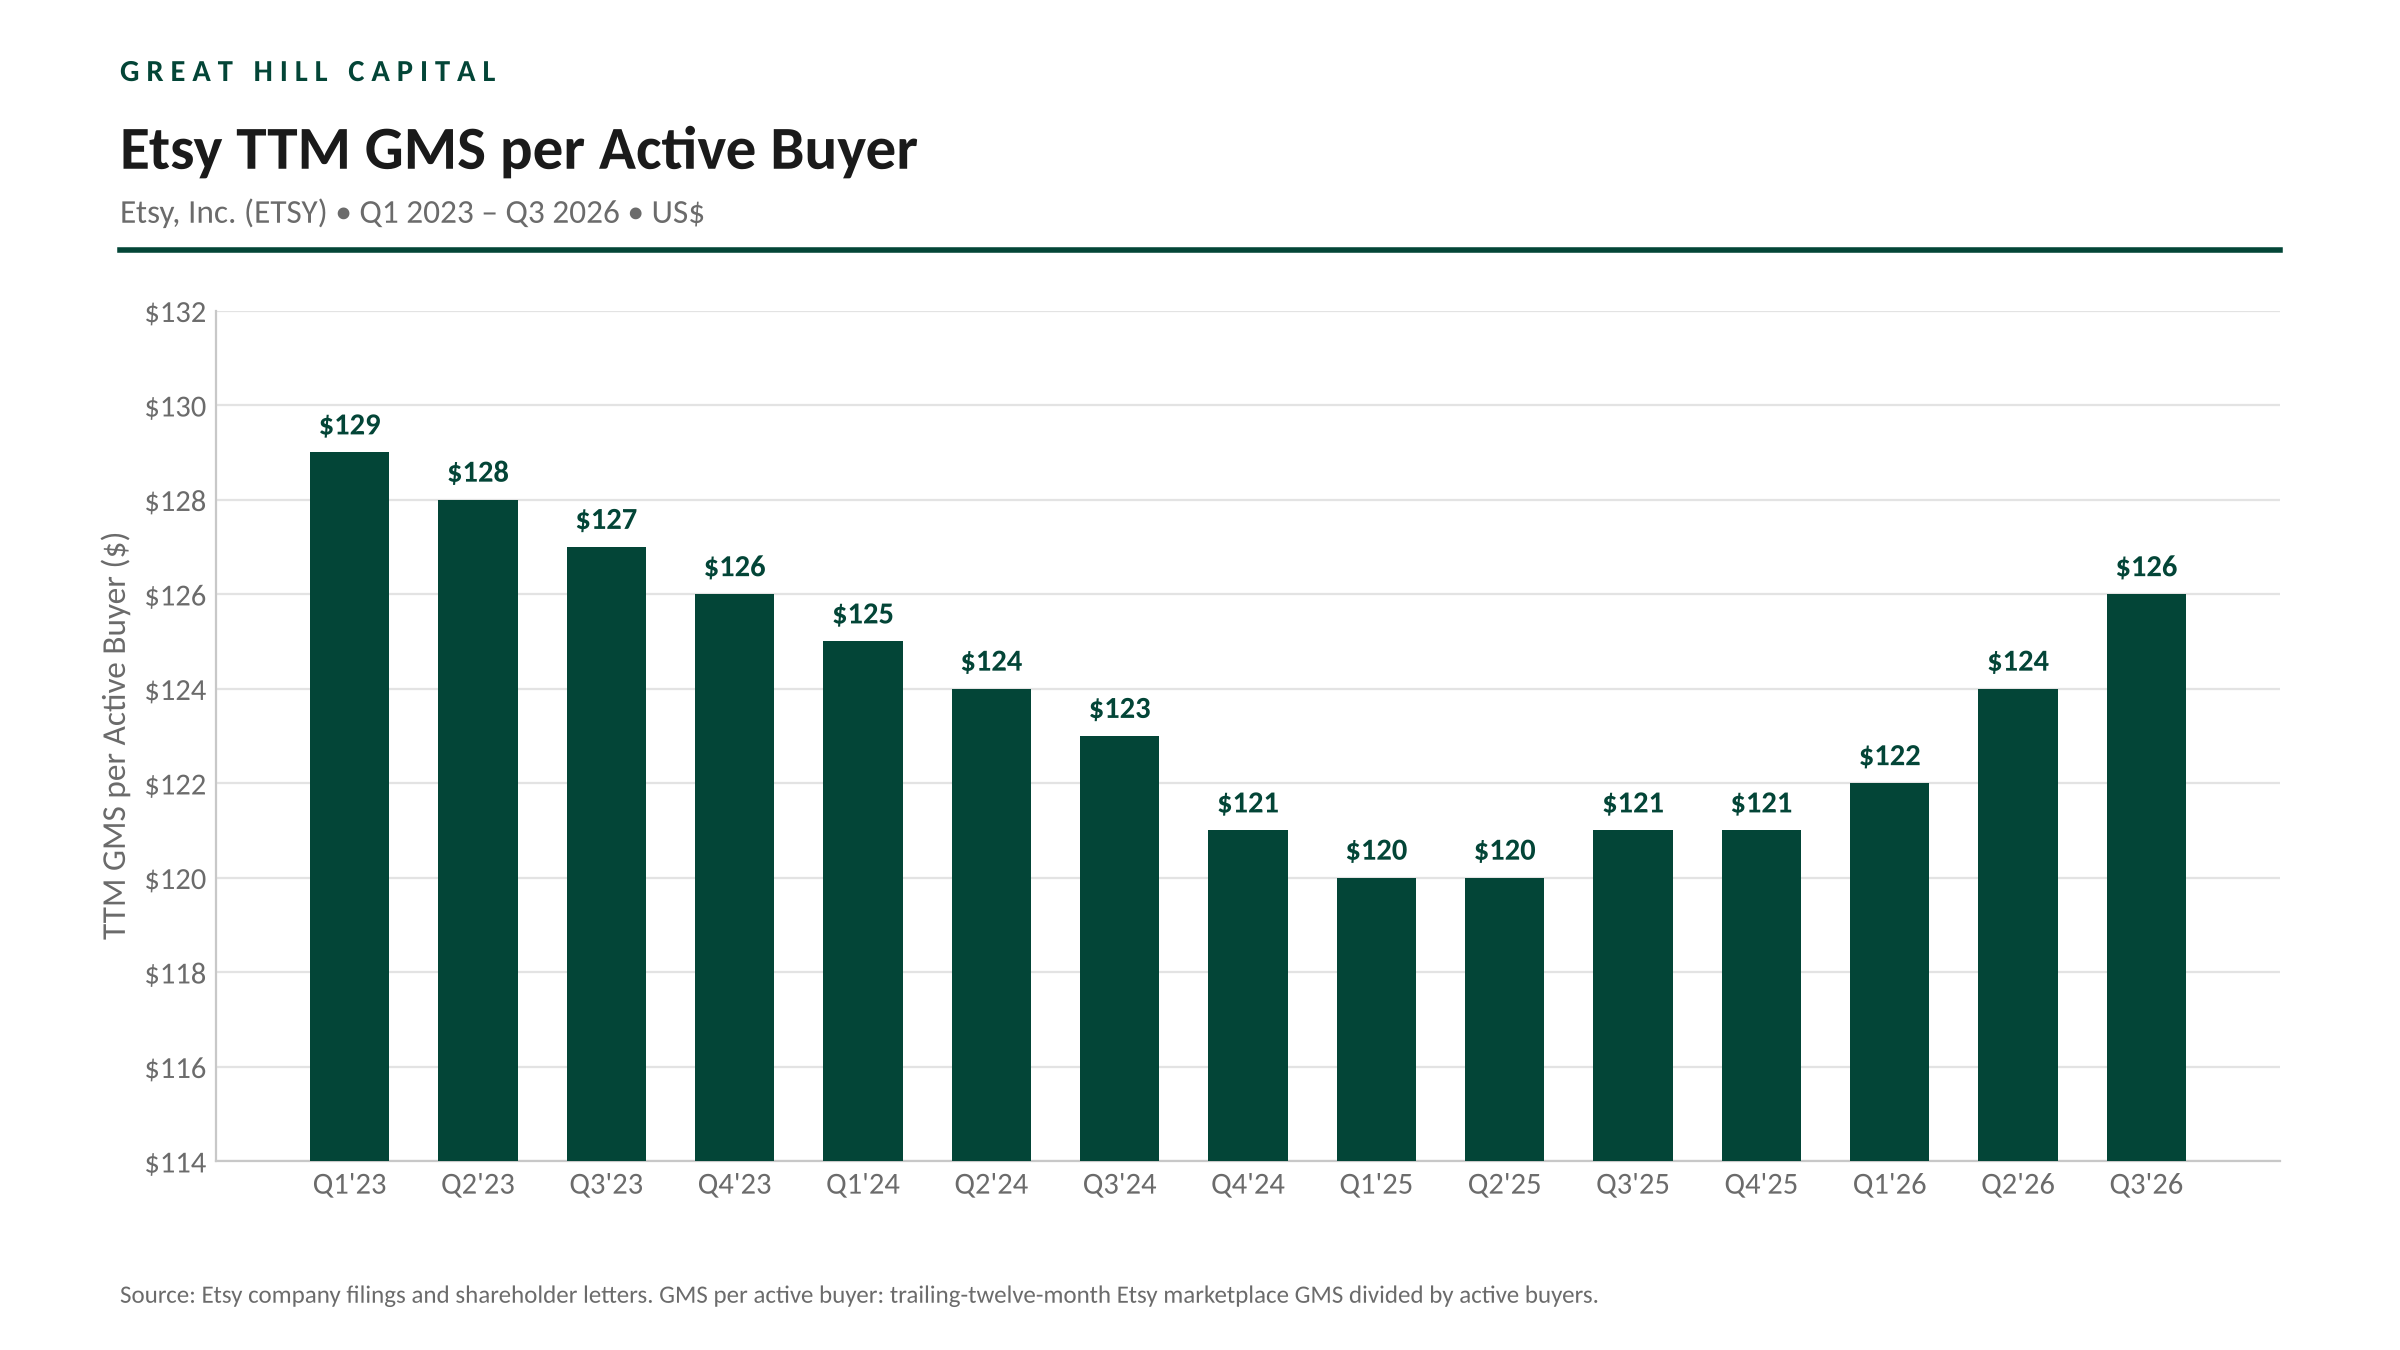
TTM GMS per active buyer reached $126 (+3.9% Y/Y, +1.4% Q/Q), the third consecutive quarter of growth, with AOV the largest contributor as search surfaces higher-quality items; frequency remains modestly down Y/Y.
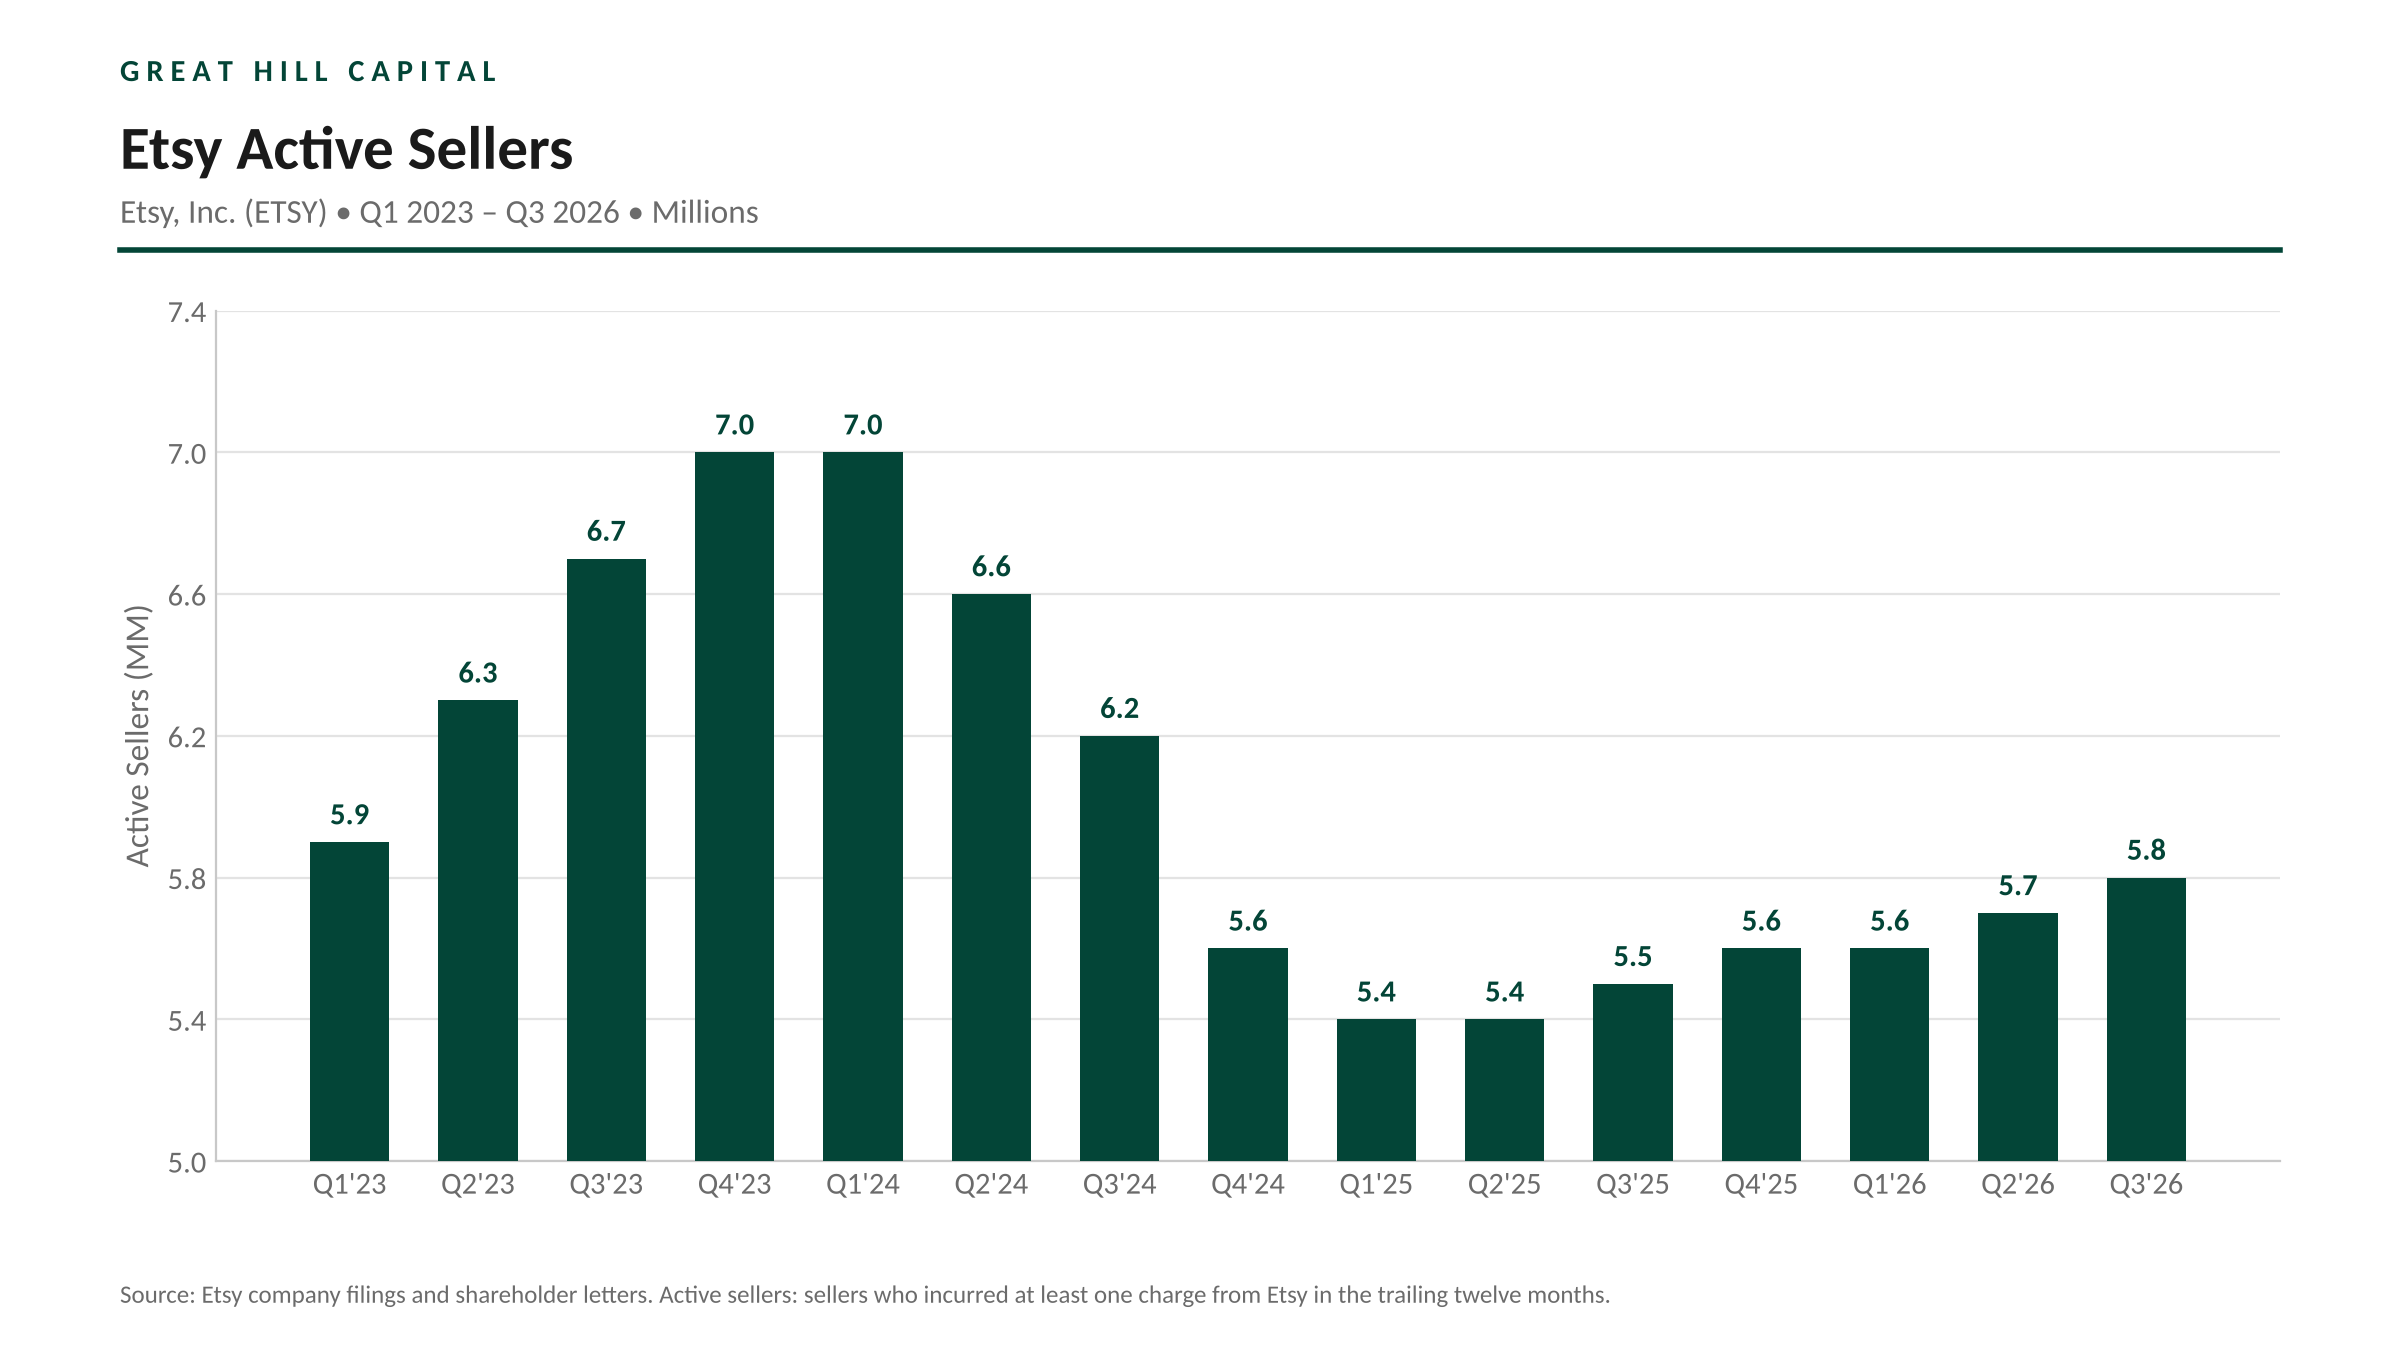
Active sellers grew +6.5% Y/Y to 5.8M, the fastest pace in two years, with seller retention at its highest level since 2021 and GMS per seller accelerating.
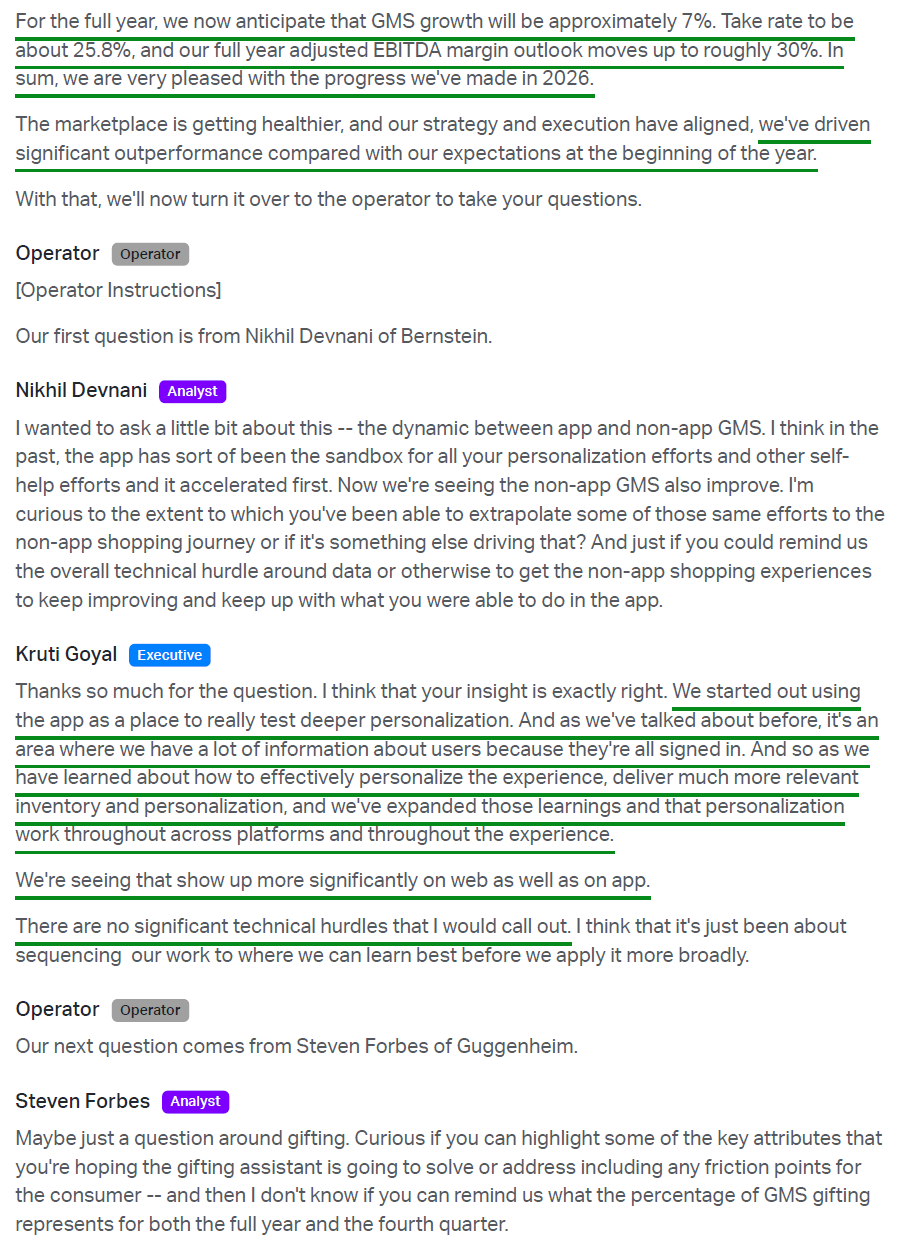
FY2026 GMS growth now guided to ~7% (raised from mid-single digits), representing a >15 pp swing off the high-single-digit declines of early 2025.
Backdoor play on housing recovery (>38% of sales from Home & Living).
NRF forecasts November and December retail sales up 4.2% Y/Y to $1.013T, the fastest growth since 2021 (+12.6%); compares with 2025 holiday sales up 3.1% to $972B
App, Personalization + Marketing
App GMS share held at ~47% in Q3 2026, stable with 1H26 levels.
App GMS grew +10.4% Y/Y (vs +12.5% in Q2), with personalization learnings from the app now being extended across web and to signed-out users.
App drives 5x more visits, 3x more pages per visit, and 1.5x higher conversion, with ~40% higher LTV than non-app users.
Non-app GMS more than doubled its growth rate to +7.5% Y/Y (vs +3.4% in Q2), a third consecutive quarter of growth.
Reactivated nearly 30M lapsed buyers in 2025 (+4% Y/Y), with >100M in the lapsed pool. Reactivated buyers have 40% higher first-year lifetime value than new buyers.
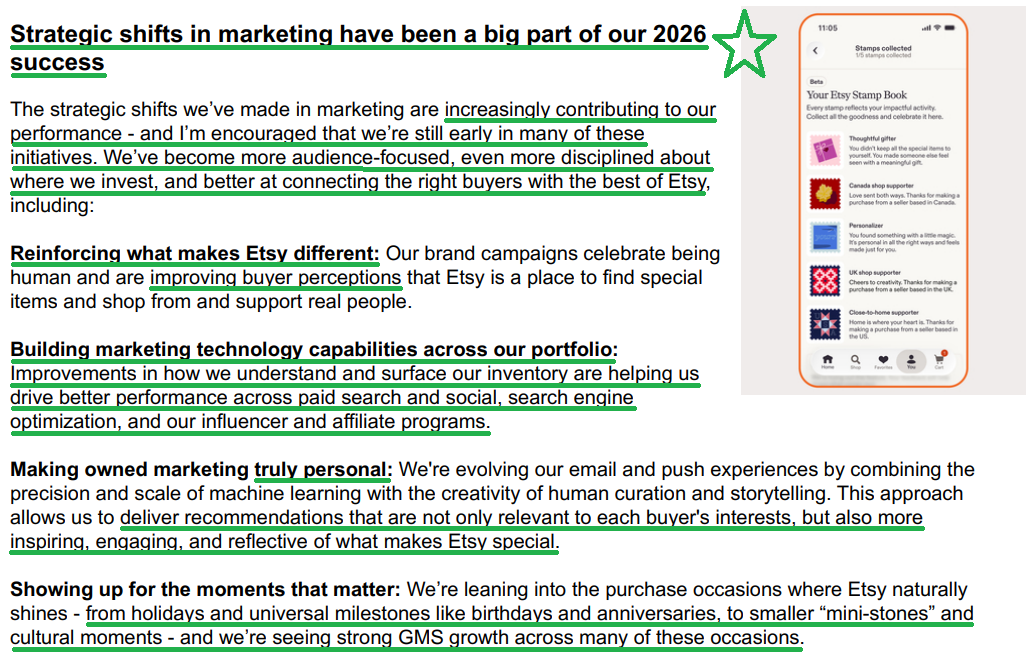
Personalized marketing: gone from <25% personalized notifications to >75%. Richer buyer profiles now power personalized feeds, recommendations, and owned marketing for four out of five active buyers, deepening with engagement and applying across feed, search, and marketing.
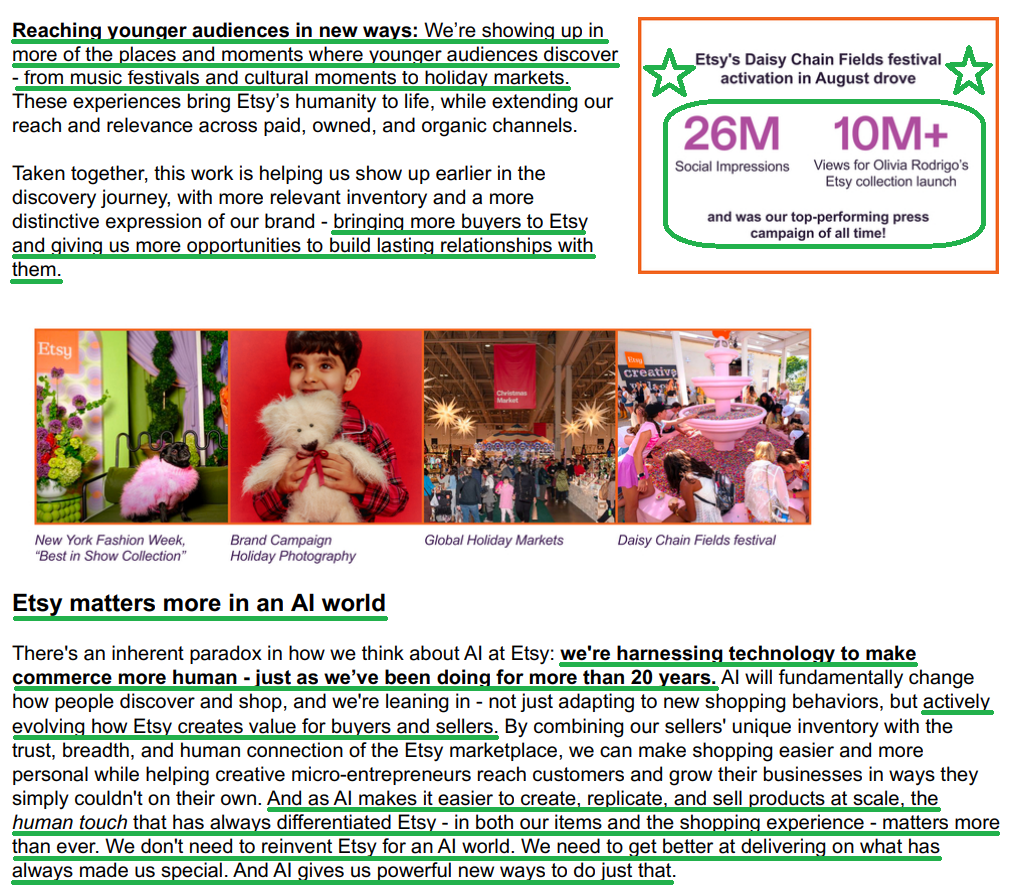
Reaching younger buyers through Creator Collective, an Olivia Rodrigo partnership, and a shift into social and streaming. ~Half of TikTok impressions now reach 18 to 29 year olds, a channel Etsy barely spent in six months ago, with the Daisy Chain Fields/Olivia Rodrigo activation (26M social impressions, 10M+ views) Etsy’s top-performing press campaign ever.
Depop Sale
Sold Depop to eBay (~$1.2B headline). Sale completed July 30, 2026, bringing $1.4B of cash into Etsy (the step-up above the headline reflects purchase-price adjustments recovering pre-close growth investments). Etsy booked an $839.7M gain on the sale in Q3.
Acquired in 2021 for $1.63B (~23x sales); a $1.05B impairment in 2022 confirmed the overpay.
Depop generated $1.1B GMS in 2025 (+36.3% Y/Y) and $187M revenue, but carried a lower take rate (-80 bps drag) and negative adjusted EBITDA margins (-350 bps drag).
Sale proceeds represent ~17% of total company market cap for a business that was only 9% of GMS. Proceeds directed to share buybacks, with management seeing no better use inside the business today.
Also sold Reverb (June 2025) and Elo7 (July 2023). Simplifies the portfolio, sharpens focus, and removes the margin drag.
Take Rate + Margin Expansion
Take rate: 26.2% in Q3 2026 (+50 bps Y/Y), entirely organic now that the Reverb divestiture is lapped, led by Etsy Ads (better matching, ranking, and budget pacing) and to a lesser extent Offsite Ads. Only a portion of sellers’ ad budgets is deployed today.
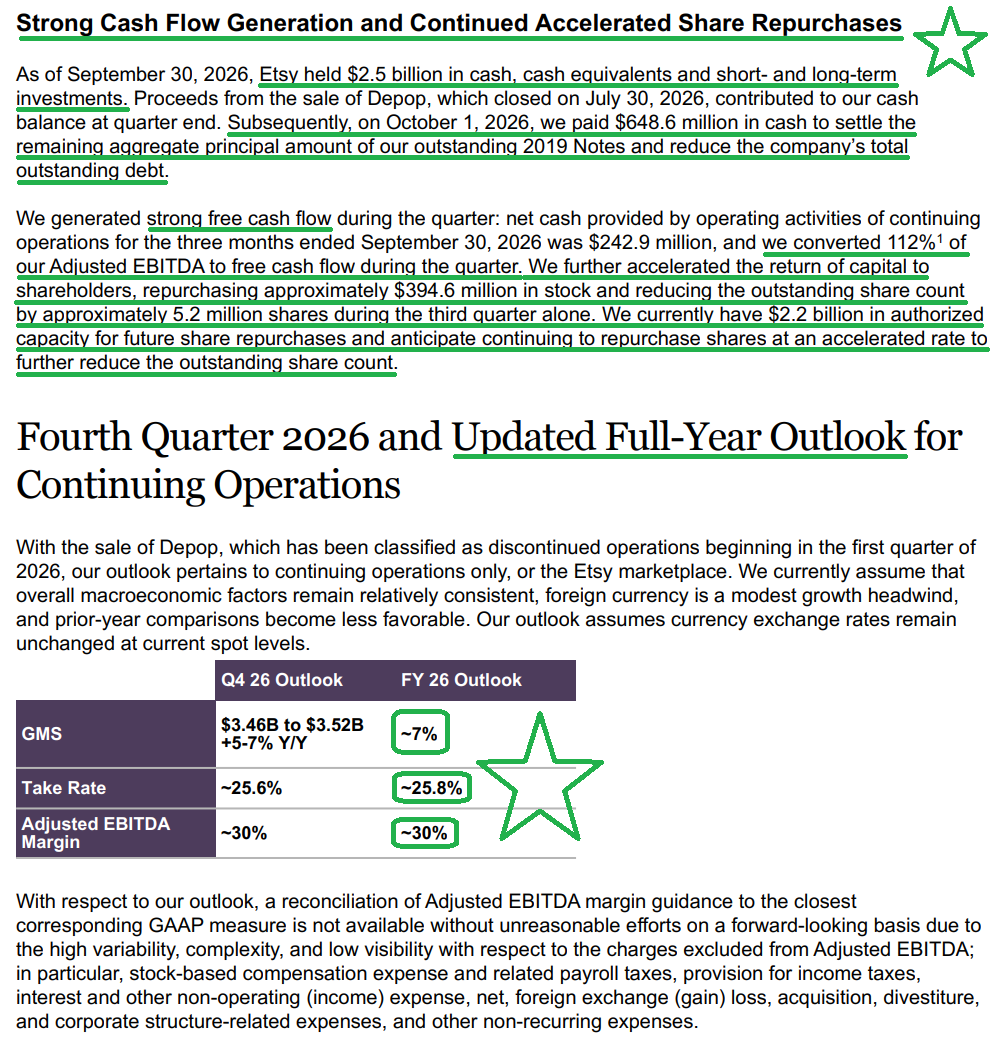
Q4 take rate guided to ~25.6%, with full year expected at ~25.8%.
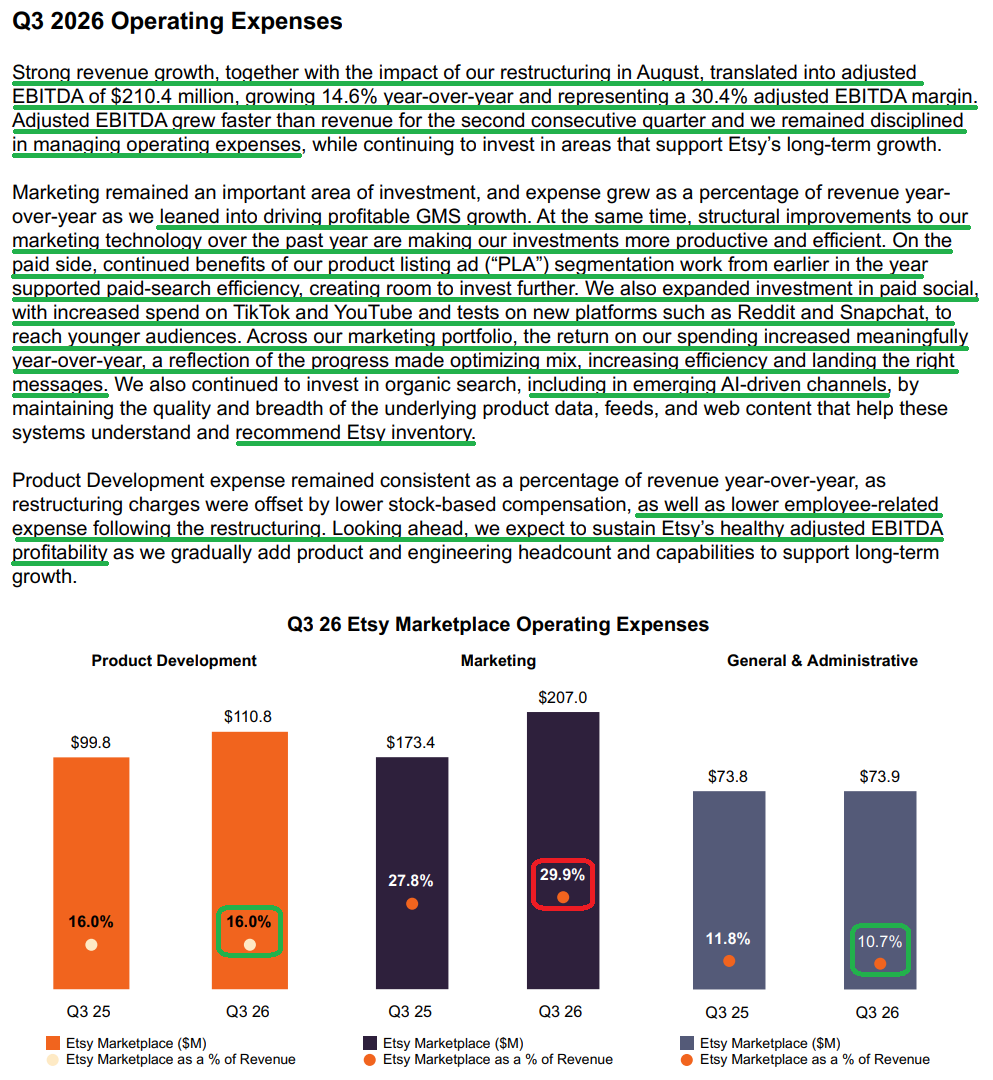
Q3 2026 adjusted EBITDA margin of 30.4% (+100 bps Y/Y), with adjusted EBITDA +14.6% Y/Y, outpacing revenue for the second consecutive quarter. G&A leveraged to 10.7% (vs 11.8%) and product development held flat at 16.0%, while marketing rose to 29.9% (vs 27.8%) as Etsy reinvested efficiency gains into growth at improving ROI.
Gross margin in the low 70s (72.7% in Q3 vs 73.4% a year ago), with modest Y/Y compression tied to trust, safety, and refunds rather than compute. AI and hosting spend is tracking in line with plan, with offsets found elsewhere.
Restructuring announced: cutting ~220 roles (~12% of headcount), concentrated in product and engineering, taking headcount to ~1,600. $33.9M in charges recognized in Q3, with the restructuring substantially complete.
Management frames it as reducing overlap and reshaping the talent mix toward machine learning, not a structural lift to the long-term margin profile, with some savings reinvested into product, engineering, and customer operations talent.
FY2026 adjusted EBITDA margin guidance raised to ~30% (from 29-30%), with Q4 also guided to ~30%.
AI Beneficiary
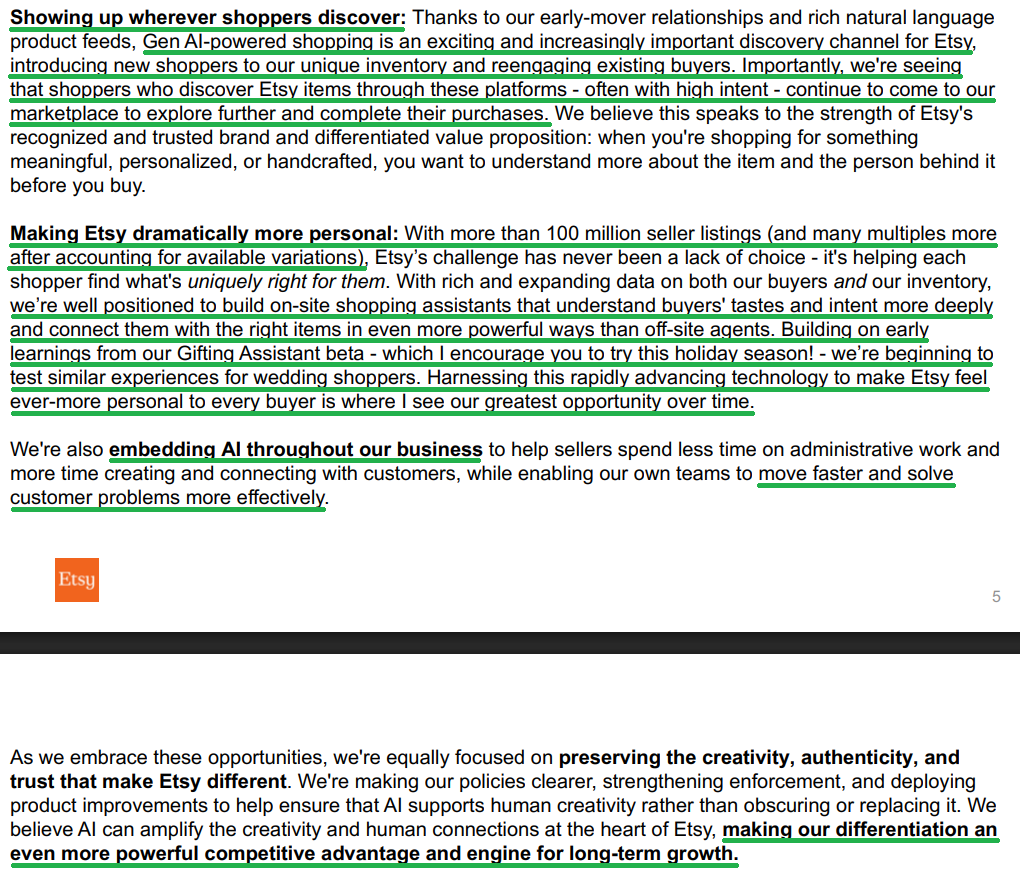
Partnership with OpenAI: developed a dedicated Etsy App within ChatGPT (700M+ weekly users), aligned with OpenAI’s shift toward retailer-run apps for agentic shopping.
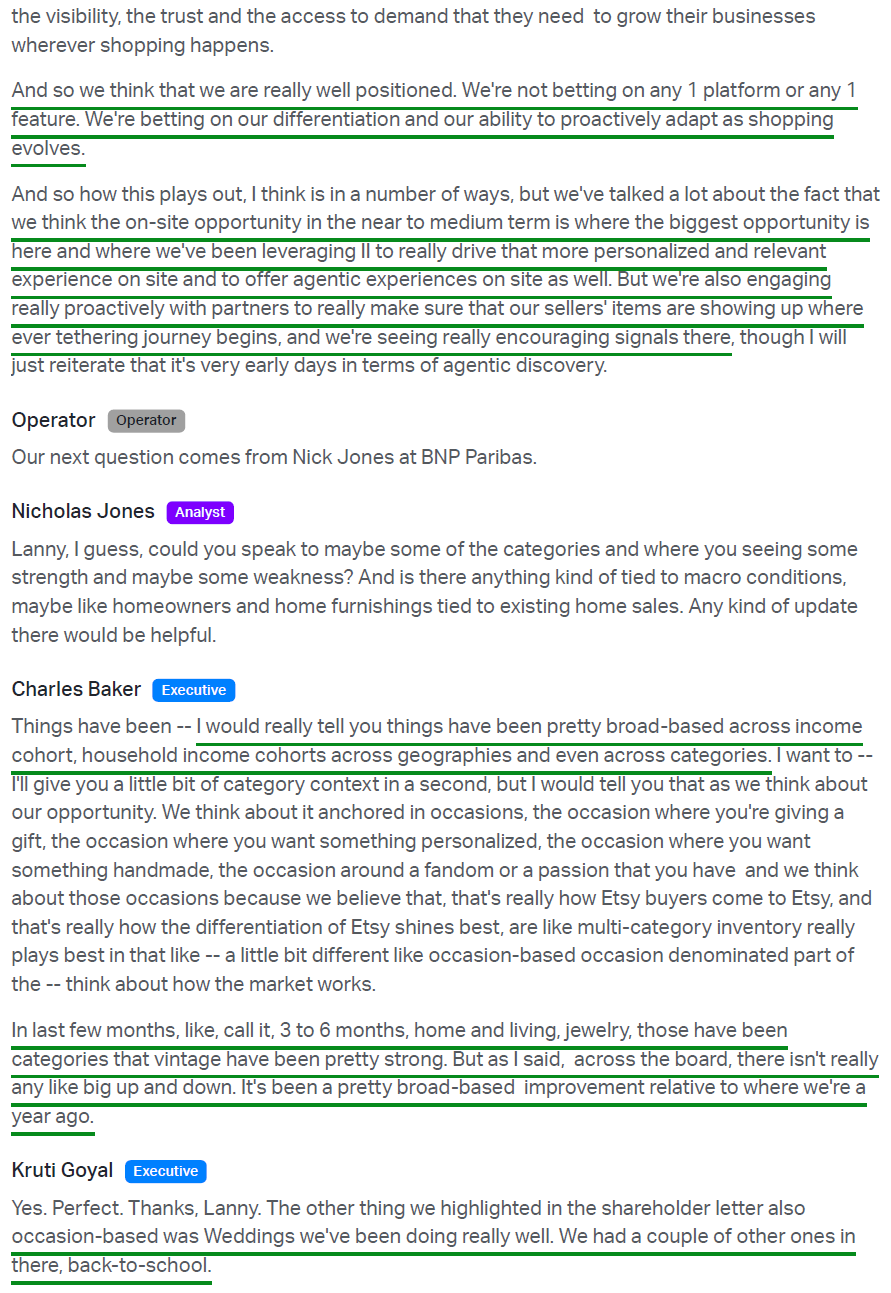
Additional agentic shopping partnerships with Google (AI Mode/Gemini) and Microsoft (Copilot Checkout). Agentic traffic remains under 1% of total, but continues to show higher purchase intent, with shoppers often coming back to Etsy to complete purchases.
Launched the beta of its “Gifting Assistant” in May 2026, Etsy’s first on-site shopping agent, now being extended to wedding shoppers. AI-powered seller assistant also in beta, offering each shop personalized insights.
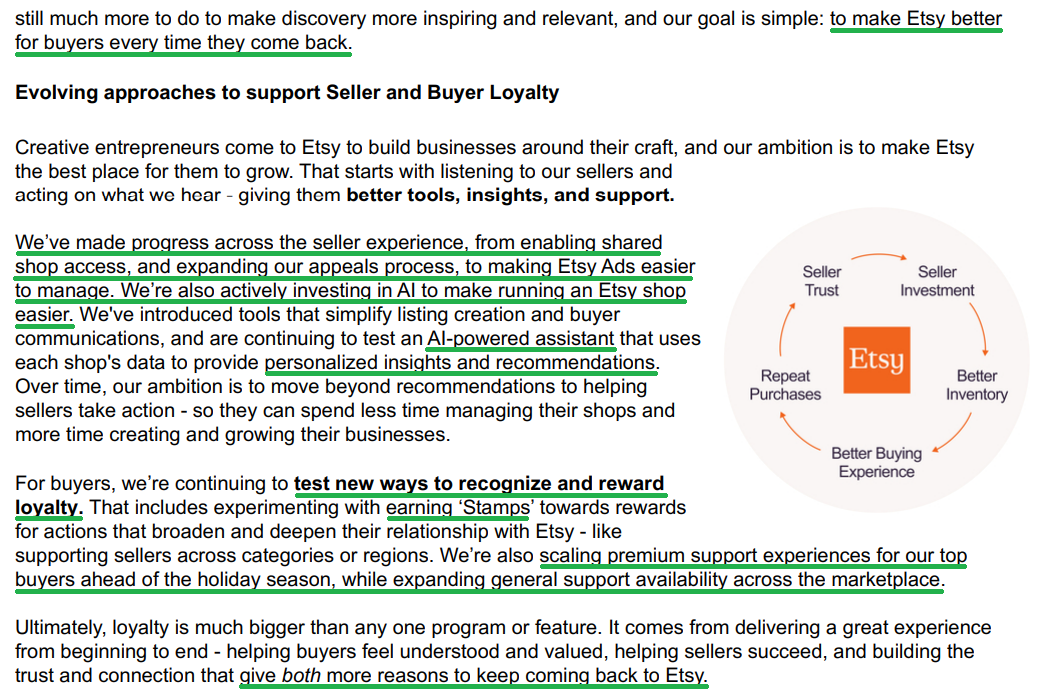
Management frames AI in three buckets: making Etsy more personal through discovery, matching, and personalization on-platform; making Etsy more discoverable off-platform through agentic partnerships; and learning how the next generation of shopping experiences evolves.
The on-platform opportunity is where management sees the most value over time.
Cash Flow + Buybacks
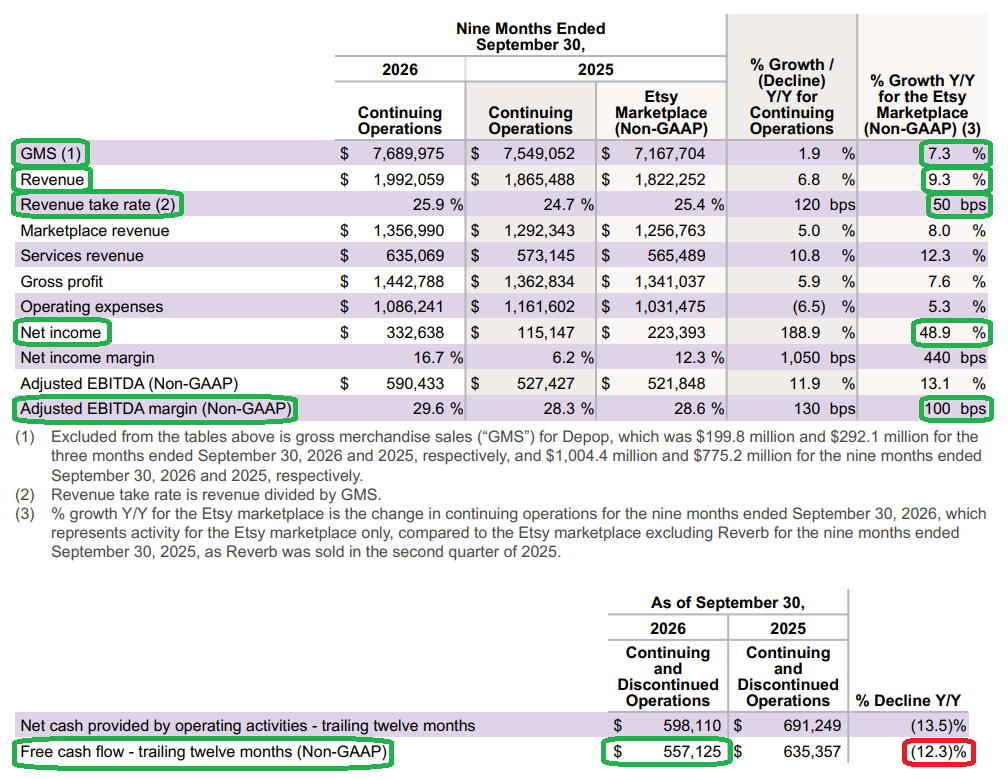
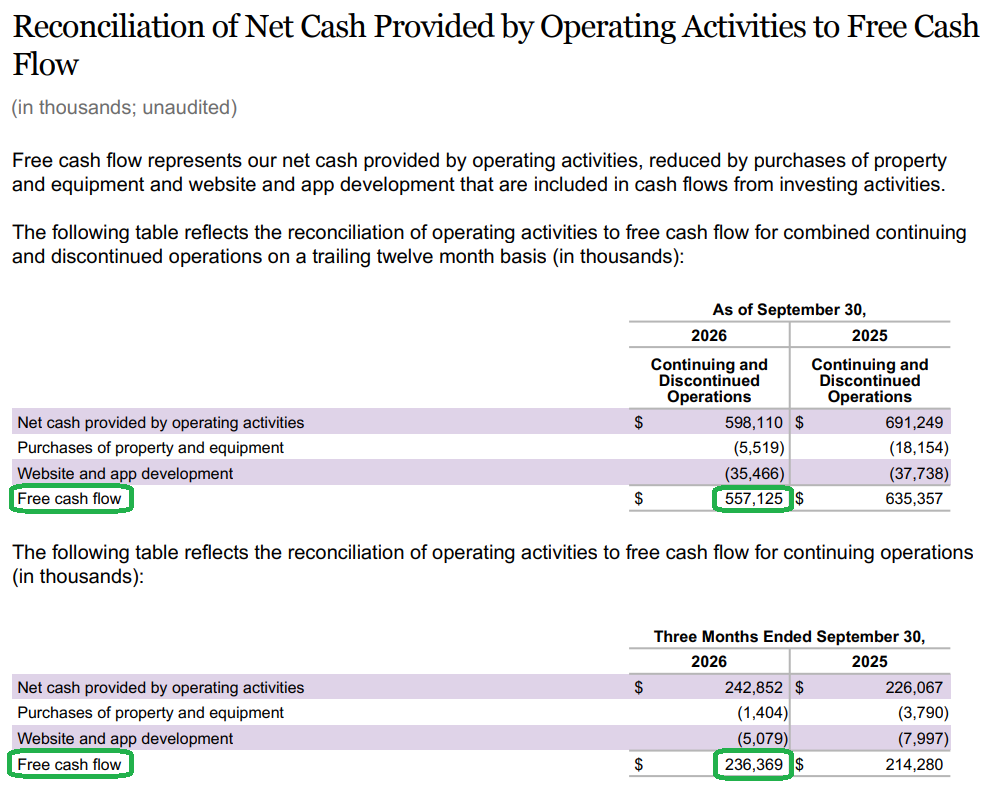
TTM operating cash flow of $598M (-13.5% Y/Y) and TTM FCF of $557M (-12.3% Y/Y), both including discontinued Depop outflows. On a continuing operations basis, Q3 2026 FCF reached $236M (+10.3% Y/Y), converting 112% of adjusted EBITDA.
Buybacks: $395M repurchased in Q3 2026 (~5.2M shares), ~58% more than Q2.
Shares outstanding down 27.8% over the past five years
Remaining authorization of $2.2B, with management expecting to keep repurchasing at an accelerated rate.
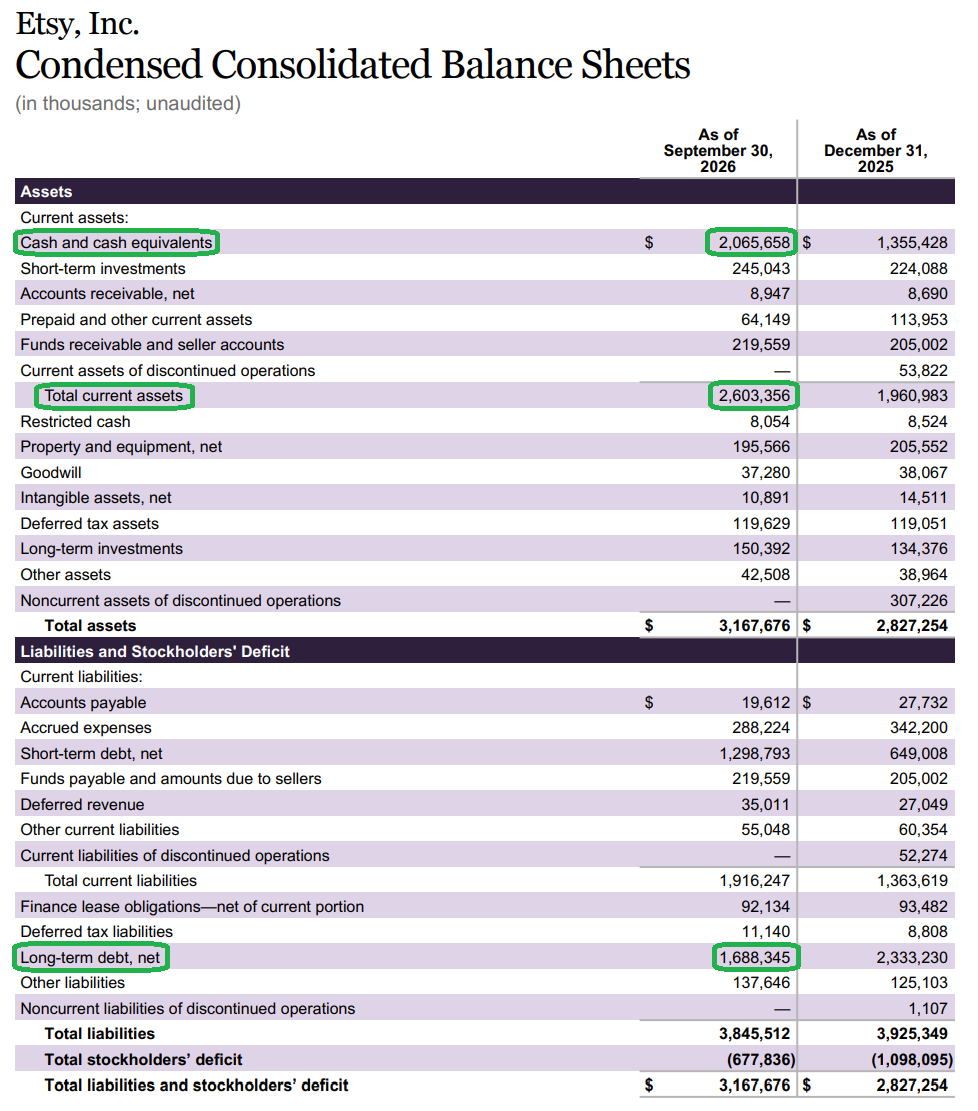
$2.5B in cash and investments at quarter-end after receiving the $1.4B of Depop proceeds, then paid $649M on October 1 to settle the remaining 2019 convertible notes.
Key Financials + Valuation
~$1.9B in cash and short/long-term investments. ~$2.3B in debt (pro forma for the October 1 note settlement).
Trades ~13.3x forward earnings ($6.93 consensus 2027 EPS).
14.3% short interest, an attractive setup with re-rating potential as GMS growth accelerates and buybacks shrink the share count.
Q3 Commentary
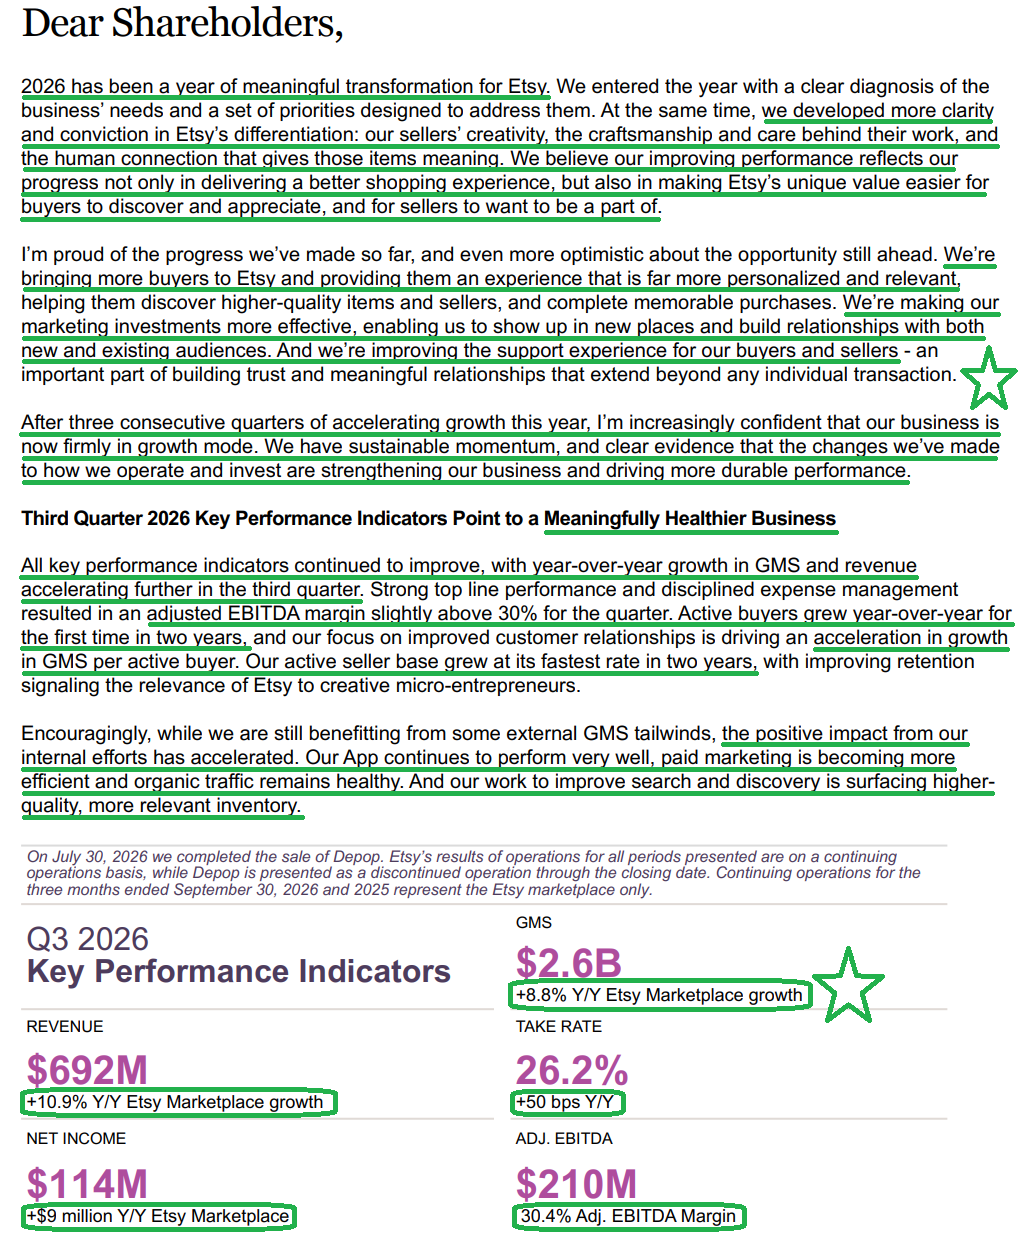
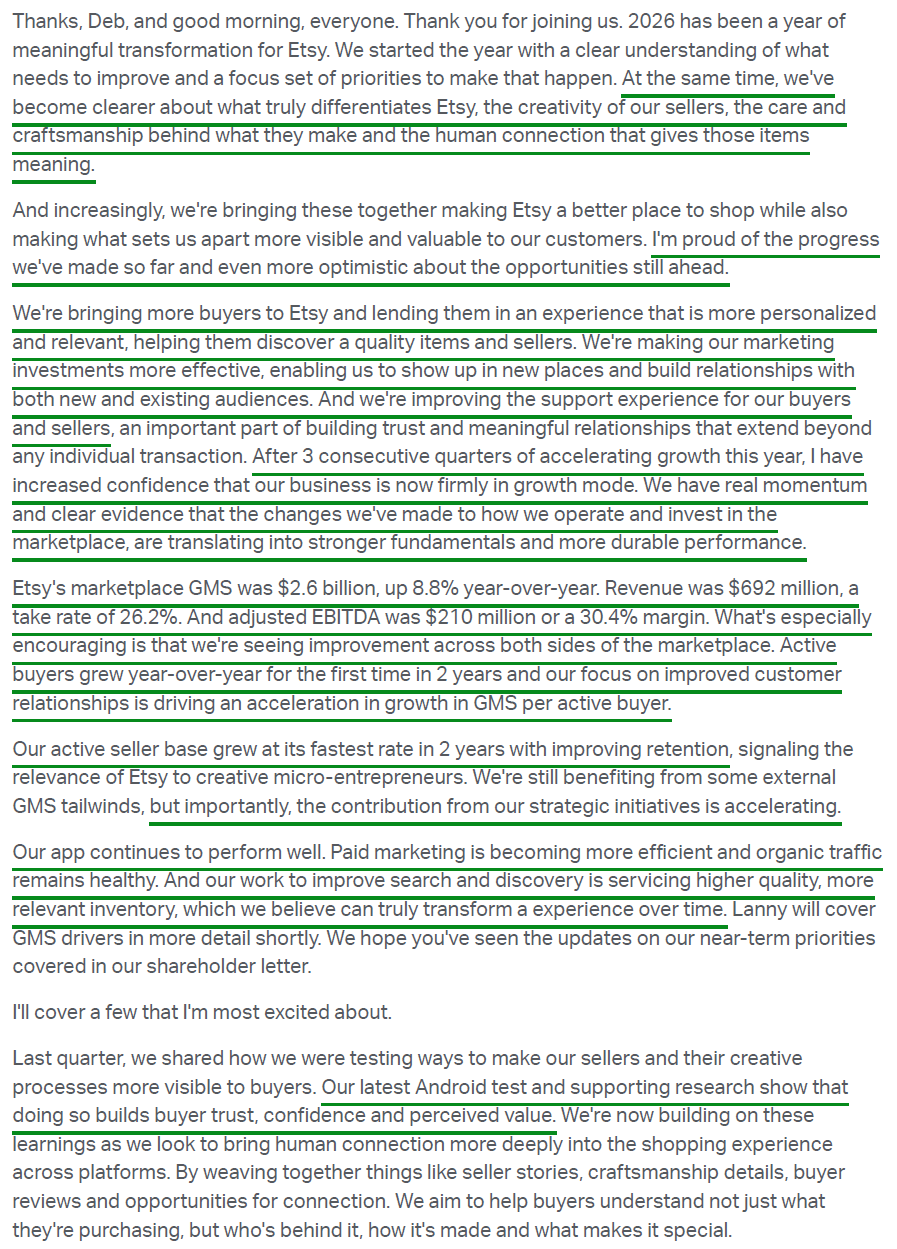
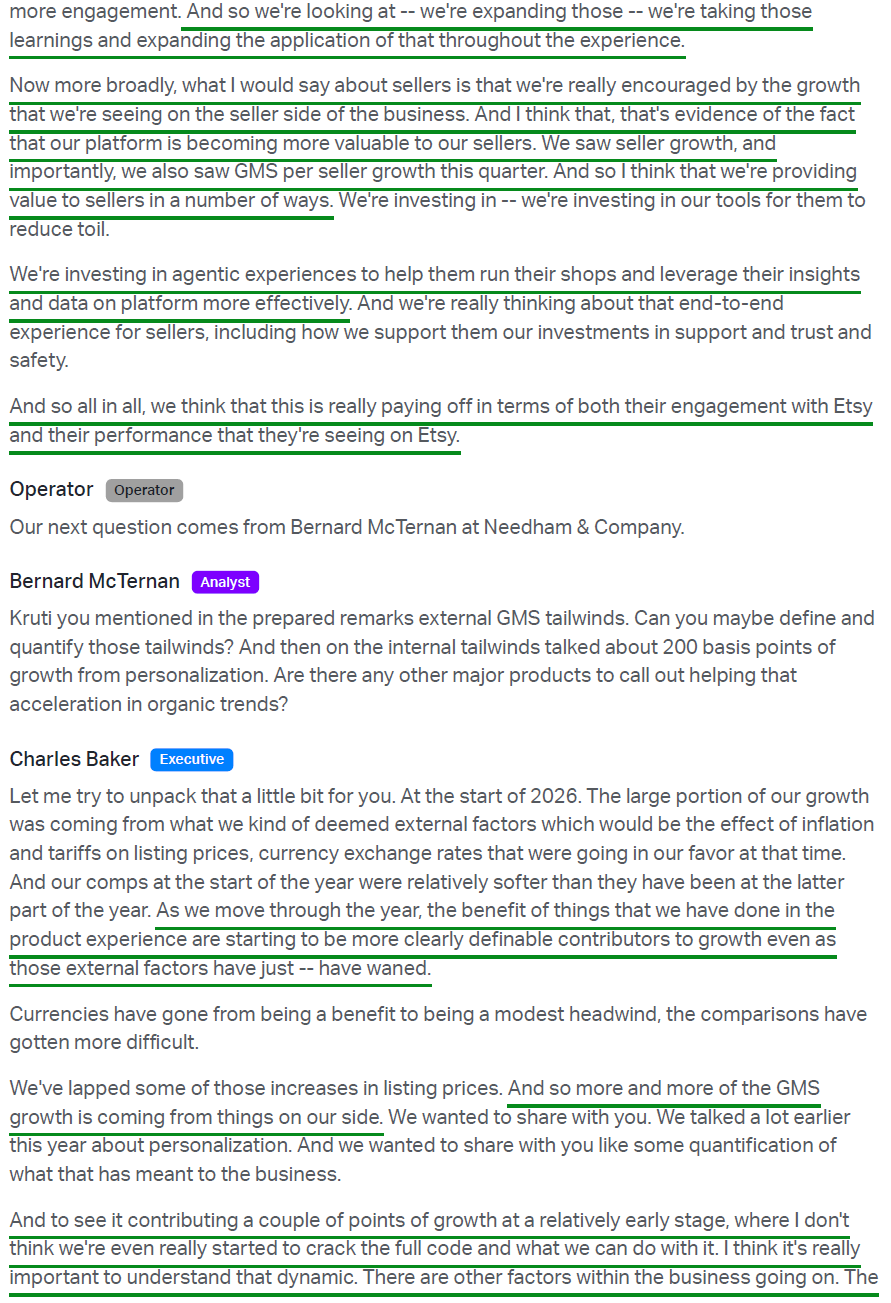
Etsy shares have enjoyed a strong 2026, but heading into the third-quarter report, the debate around the stock had narrowed to a single question: was the recovery sustainable, or was it being propped up by temporary external tailwinds? GMS growth had accelerated steadily to 5.5% Y/Y in Q1 and 7.5% in Q2, a massive improvement from the high-single-digit declines Etsy posted through early 2025, when GMS bottomed with an 8.9% drop. Part of that acceleration, however, came with outside help, as inflation and tariffs lifted listing prices, currency moved in Etsy’s favor, and comps against depressed levels set a low bar. Q3 was the first quarter in which those tailwinds faded or reversed, with tougher comps, currency becoming a modest headwind, and the listing price increases now lapped. Not only did Etsy clear that higher bar, but it accelerated to its fastest GMS growth since Q4 2021.
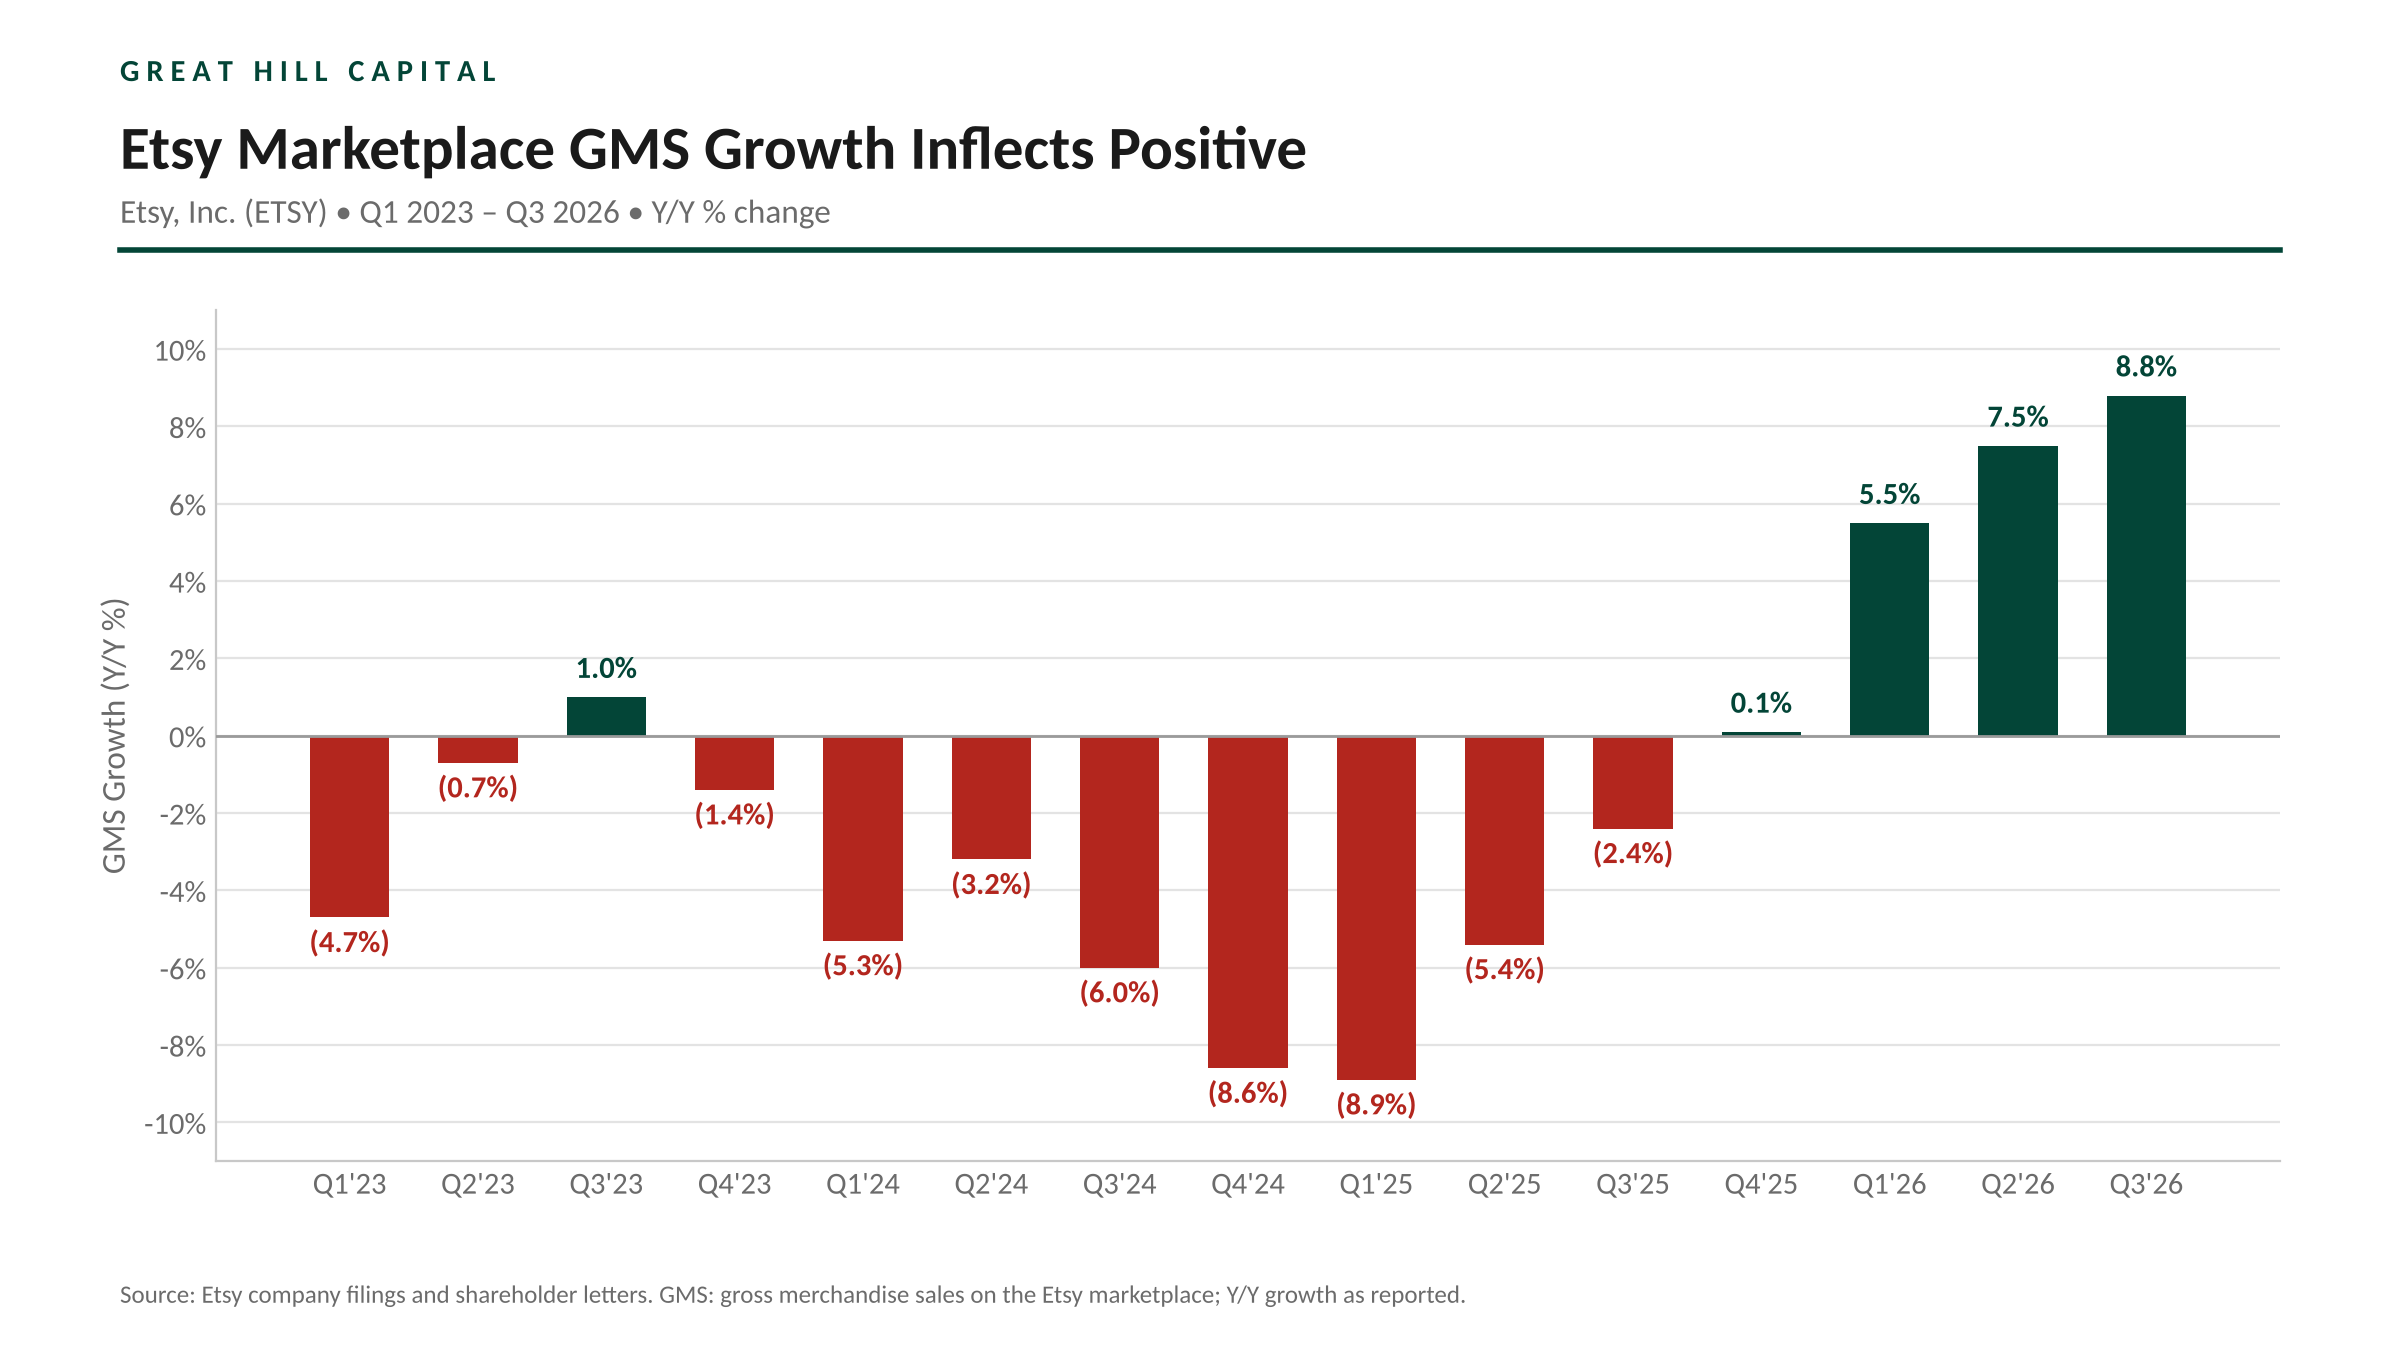
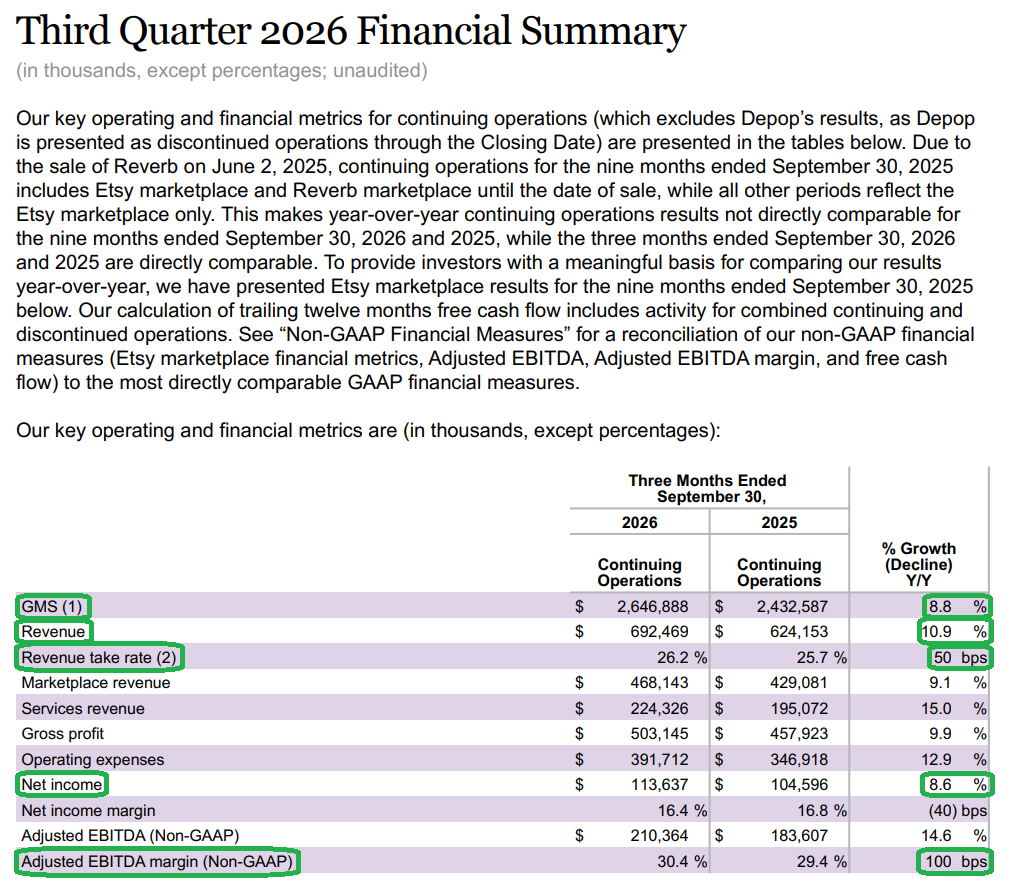
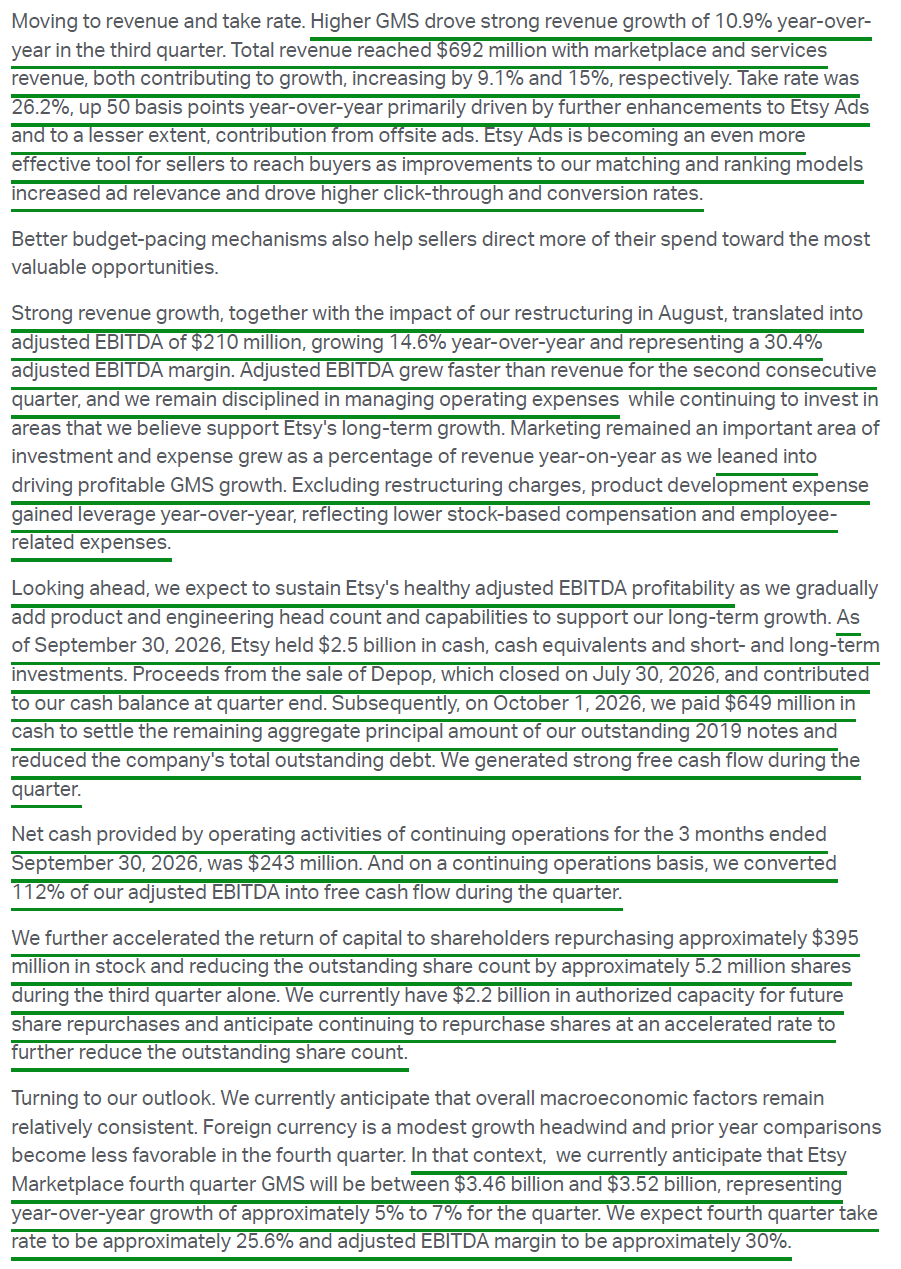
GMS grew 8.8% Y/Y to $2.65B (+9.1% currency-neutral), exceeding the top end of guidance as currency-neutral growth accelerated by ~190 bps sequentially, bringing the rebound from the Q1 2025 trough to nearly 18 percentage points in just six quarters. Revenue grew 10.9% Y/Y to $692.5M, ahead of the $668.1M consensus, while adjusted EBITDA rose 14.6% to $210.4M (30.4% margin), well above the $195.9M consensus as operating leverage continued to drive profitability, with EBITDA growth outpacing revenue for a second straight quarter. Rather than easing off with tougher comps ahead, management raised full-year GMS growth guidance to ~7% from the mid-single digits and guided Q4 GMS to $3.46B to $3.52B, ahead of the $3.42B the Street was looking for.
With growth accelerating even as the external help fades, the quarter offered further proof that Etsy’s recovery is increasingly the product of self-help initiatives within management’s control. Credit goes to CEO Kruti Goyal, who in her first year at the helm has pressed all the right buttons alongside her management team to turn a stabilizing marketplace into a growing one.
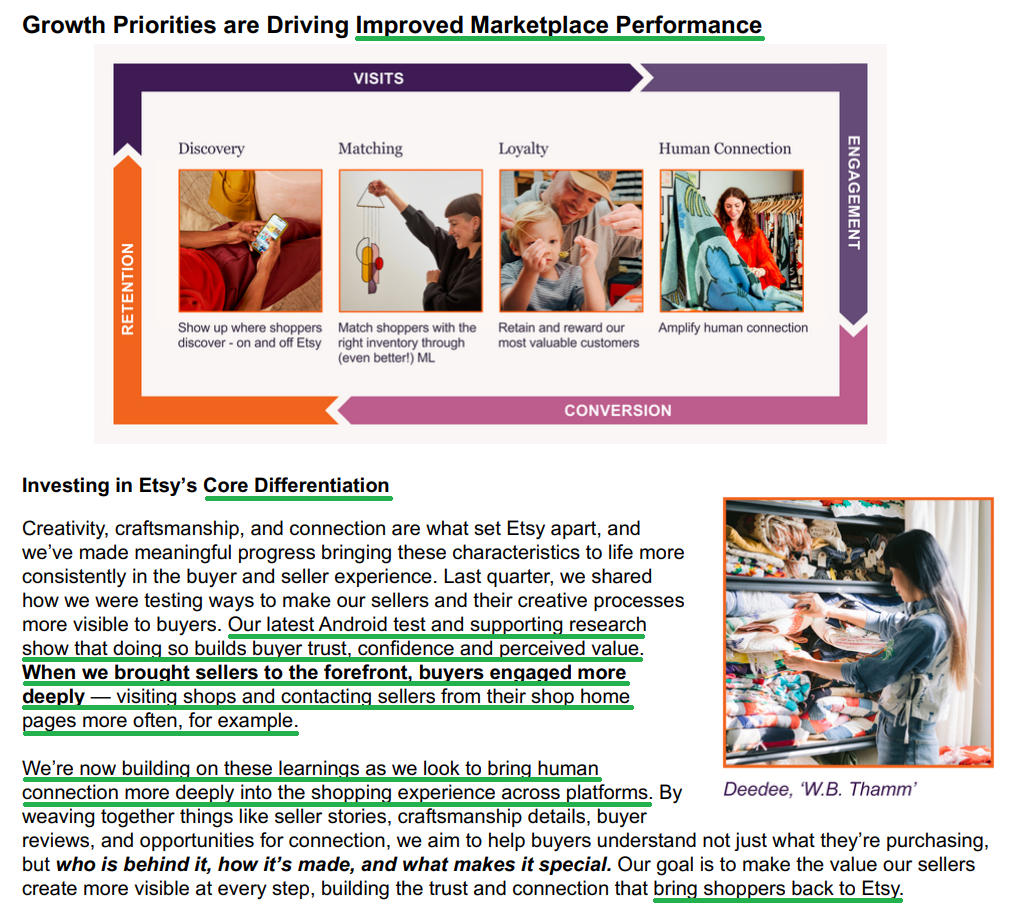
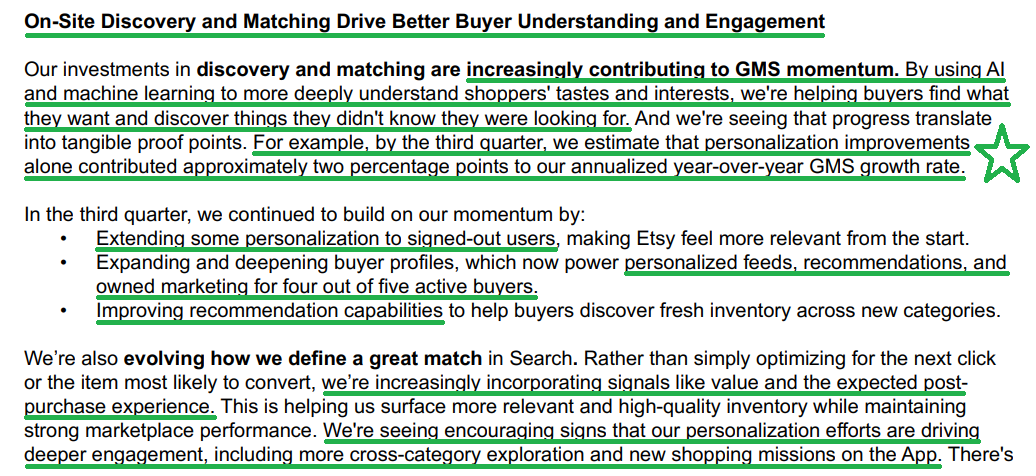
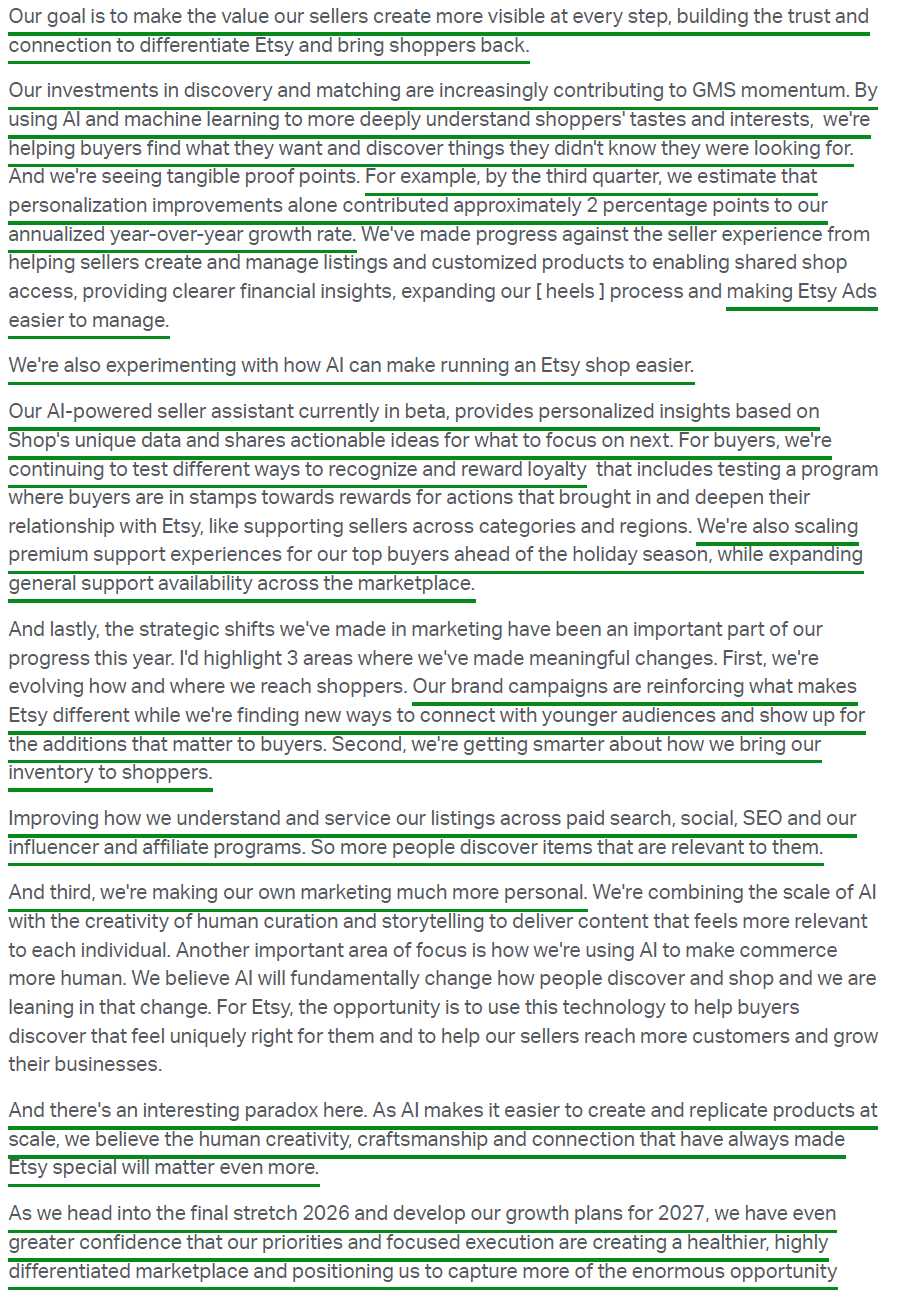
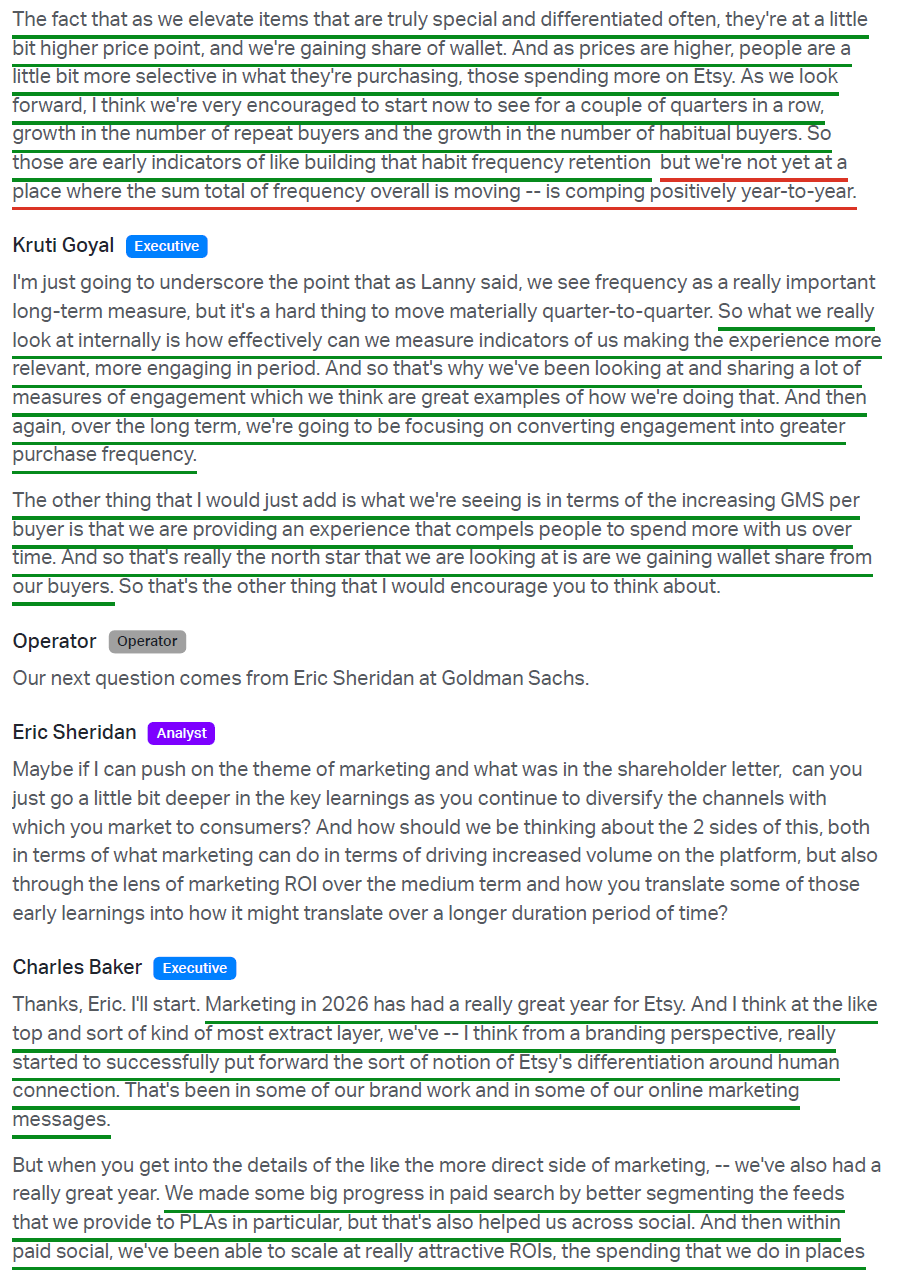
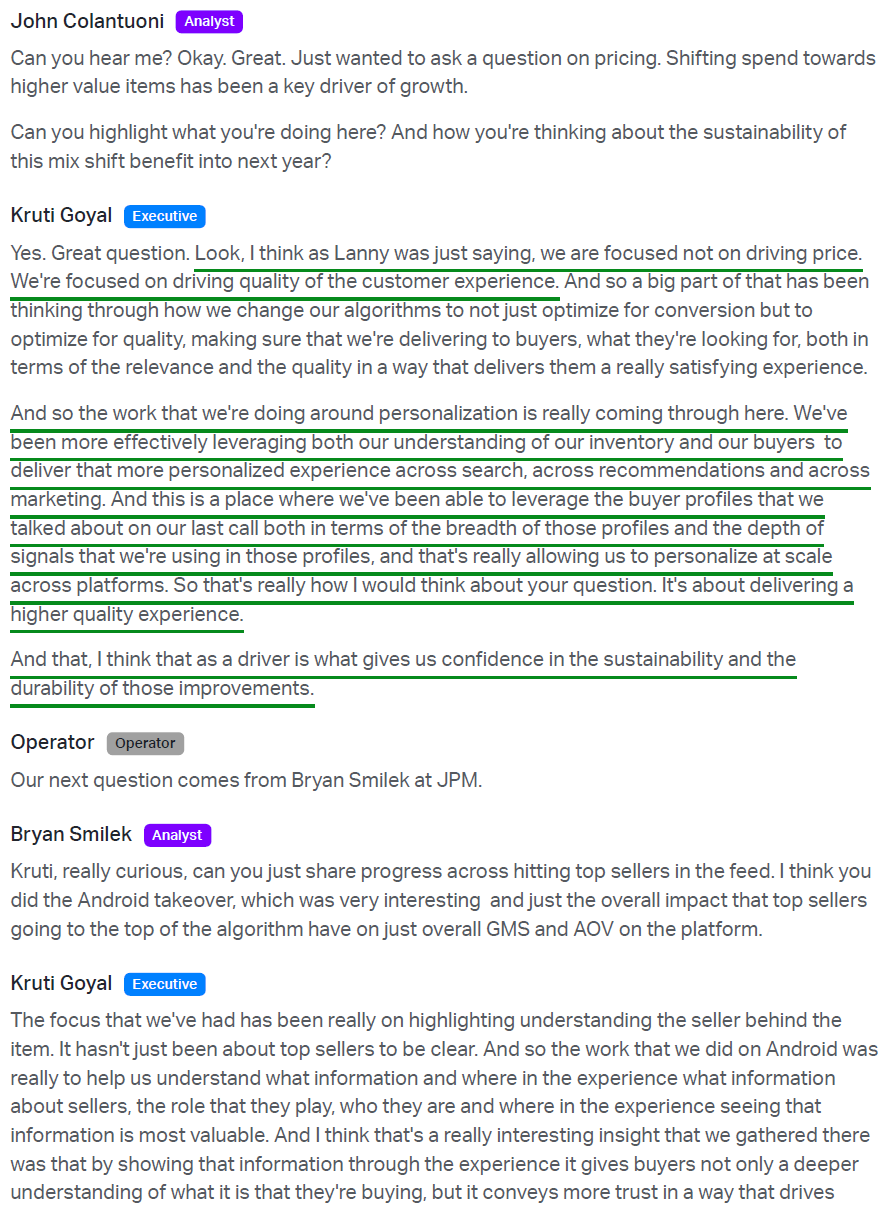
The most important of those buttons has been personalization. With more than 100M listings, Etsy’s challenge has never been a lack of selection, but helping each shopper find exactly what they’re looking for. The app became the proving ground to test and refine that work, since every user there is signed in, giving Etsy more data on each shopper’s interests and preferences. The buyer profiles built there now power personalized feeds, recommendations, and marketing for four out of five active buyers. Management estimates that personalization alone added ~2 percentage points to annualized GMS growth by Q3, as better matches steer shoppers toward higher-quality items they are willing to pay more for.
The next step is bringing that playbook to the web, where the majority of Etsy’s GMS (~53%) still takes place. Early signs are encouraging, with non-app GMS more than doubling its growth rate to +7.5% Y/Y from +3.4% in Q2, closing much of the gap with the app’s +10.4%. With both channels now pulling in the same direction, the acceleration looks far more durable than growth carried by the app alone, while management says it has only begun to scratch the surface of what personalization can do.
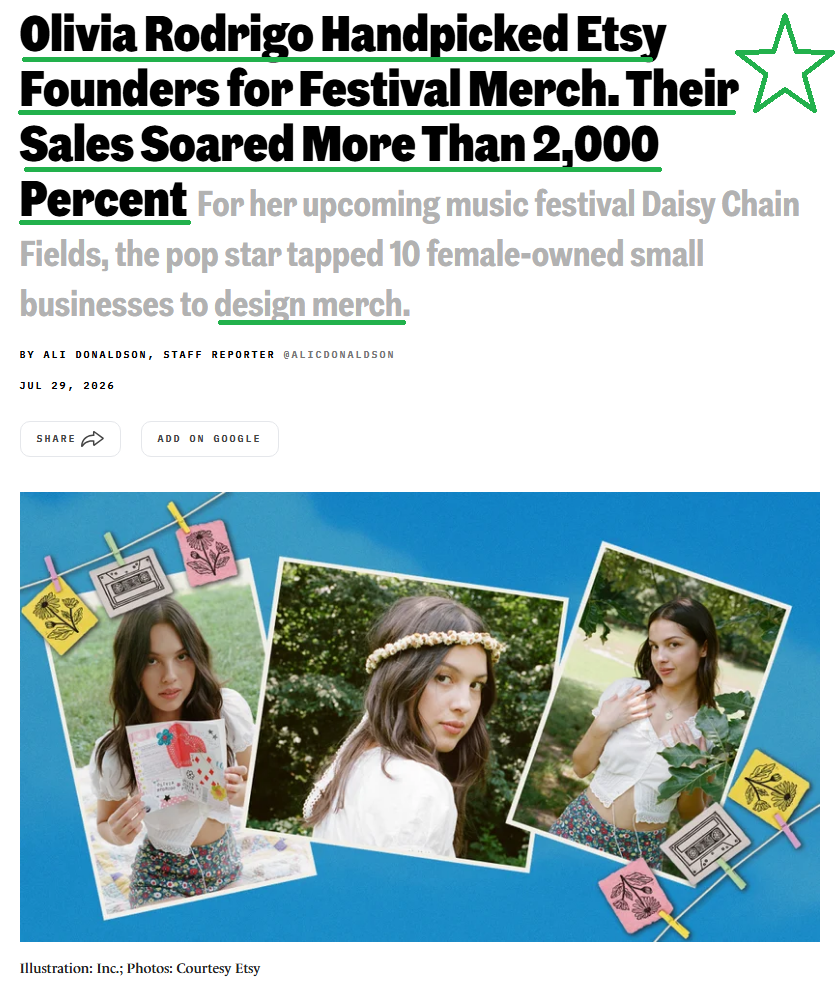
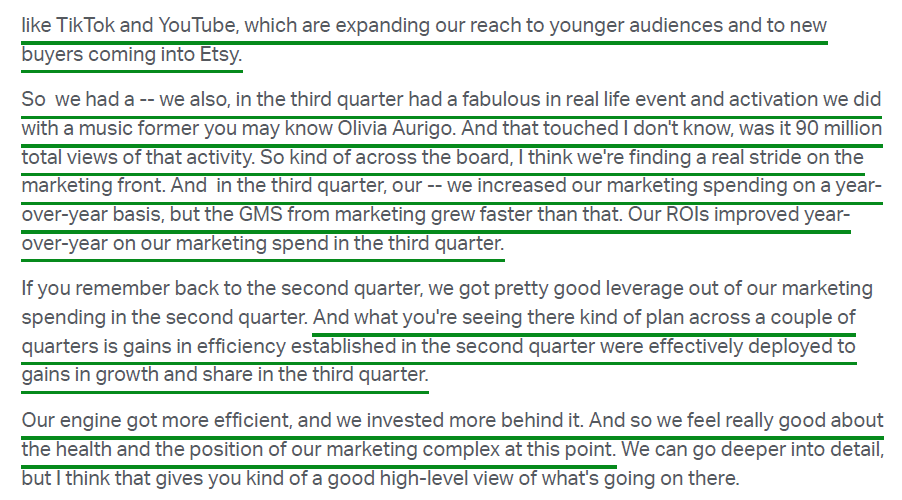
Marketing is the second lever, with Etsy getting more out of every dollar it spends. While marketing expense rose to 29.9% of revenue from 27.8% a year ago as Etsy leaned in, GMS from marketing grew faster than the spend behind it, with efficiency gains across paid search and social stretching each dollar further. Etsy is putting those efficiency gains to work reaching a younger generation of shoppers through social media, scaling spend on TikTok and YouTube while testing Snapchat and Reddit. Half of its TikTok impressions now reach 18- to 29-year-olds on a platform where Etsy was barely spending six months ago, with the same channels proving just as effective at bringing lapsed buyers back. The Olivia Rodrigo partnership is a case in point, with her Etsy collection launch drawing more than 10M views as part of the company’s best-performing press campaign ever.
The best evidence that these self-help initiatives are working shows up on both sides of the marketplace. Better marketing is bringing more people through the door, with active buyers returning to Y/Y growth for the first time in two years (+1.0% to 87.5M).
Better personalization is getting them to spend more once they arrive, lifting TTM GMS per active buyer 3.9% to $126.
Sellers are following the demand, with active sellers growing 6.5% to 5.8M, their fastest pace in two years, as seller retention reached its highest level since 2021.
Purchase frequency remains the missing piece, still modestly down Y/Y, though repeat and habitual buyers grew sequentially for a second straight quarter, which management sees as early signs of buying habits forming.
More buyers attract more sellers, whose inventory in turn gives buyers more reasons to return, which is exactly the flywheel Etsy has spent the past two years trying to restart.
Every turn of that flywheel also throws off more cash, which is what ultimately turns a healthier marketplace into higher per-share value. Much like PayPal, Etsy is a cash machine with a rock-solid balance sheet, with the October 1 repayment of $649M in convertible notes bringing net debt to well under half a turn of adjusted EBITDA. Free cash flow from continuing operations grew 10.3% Y/Y to $236.4M in Q3, converting 112% of adjusted EBITDA, while the Depop sale added $1.4B to the war chest.
With that kind of cash generation and financial flexibility, management has made clear it sees no better use for that capital than aggressively repurchasing cheap shares. Etsy bought back ~$394.6M worth of stock in Q3, retiring ~5.2M shares and bringing the five-year reduction in shares outstanding to ~28%, with another $2.2B of authorization remaining (~27% of its $8.05B market cap).
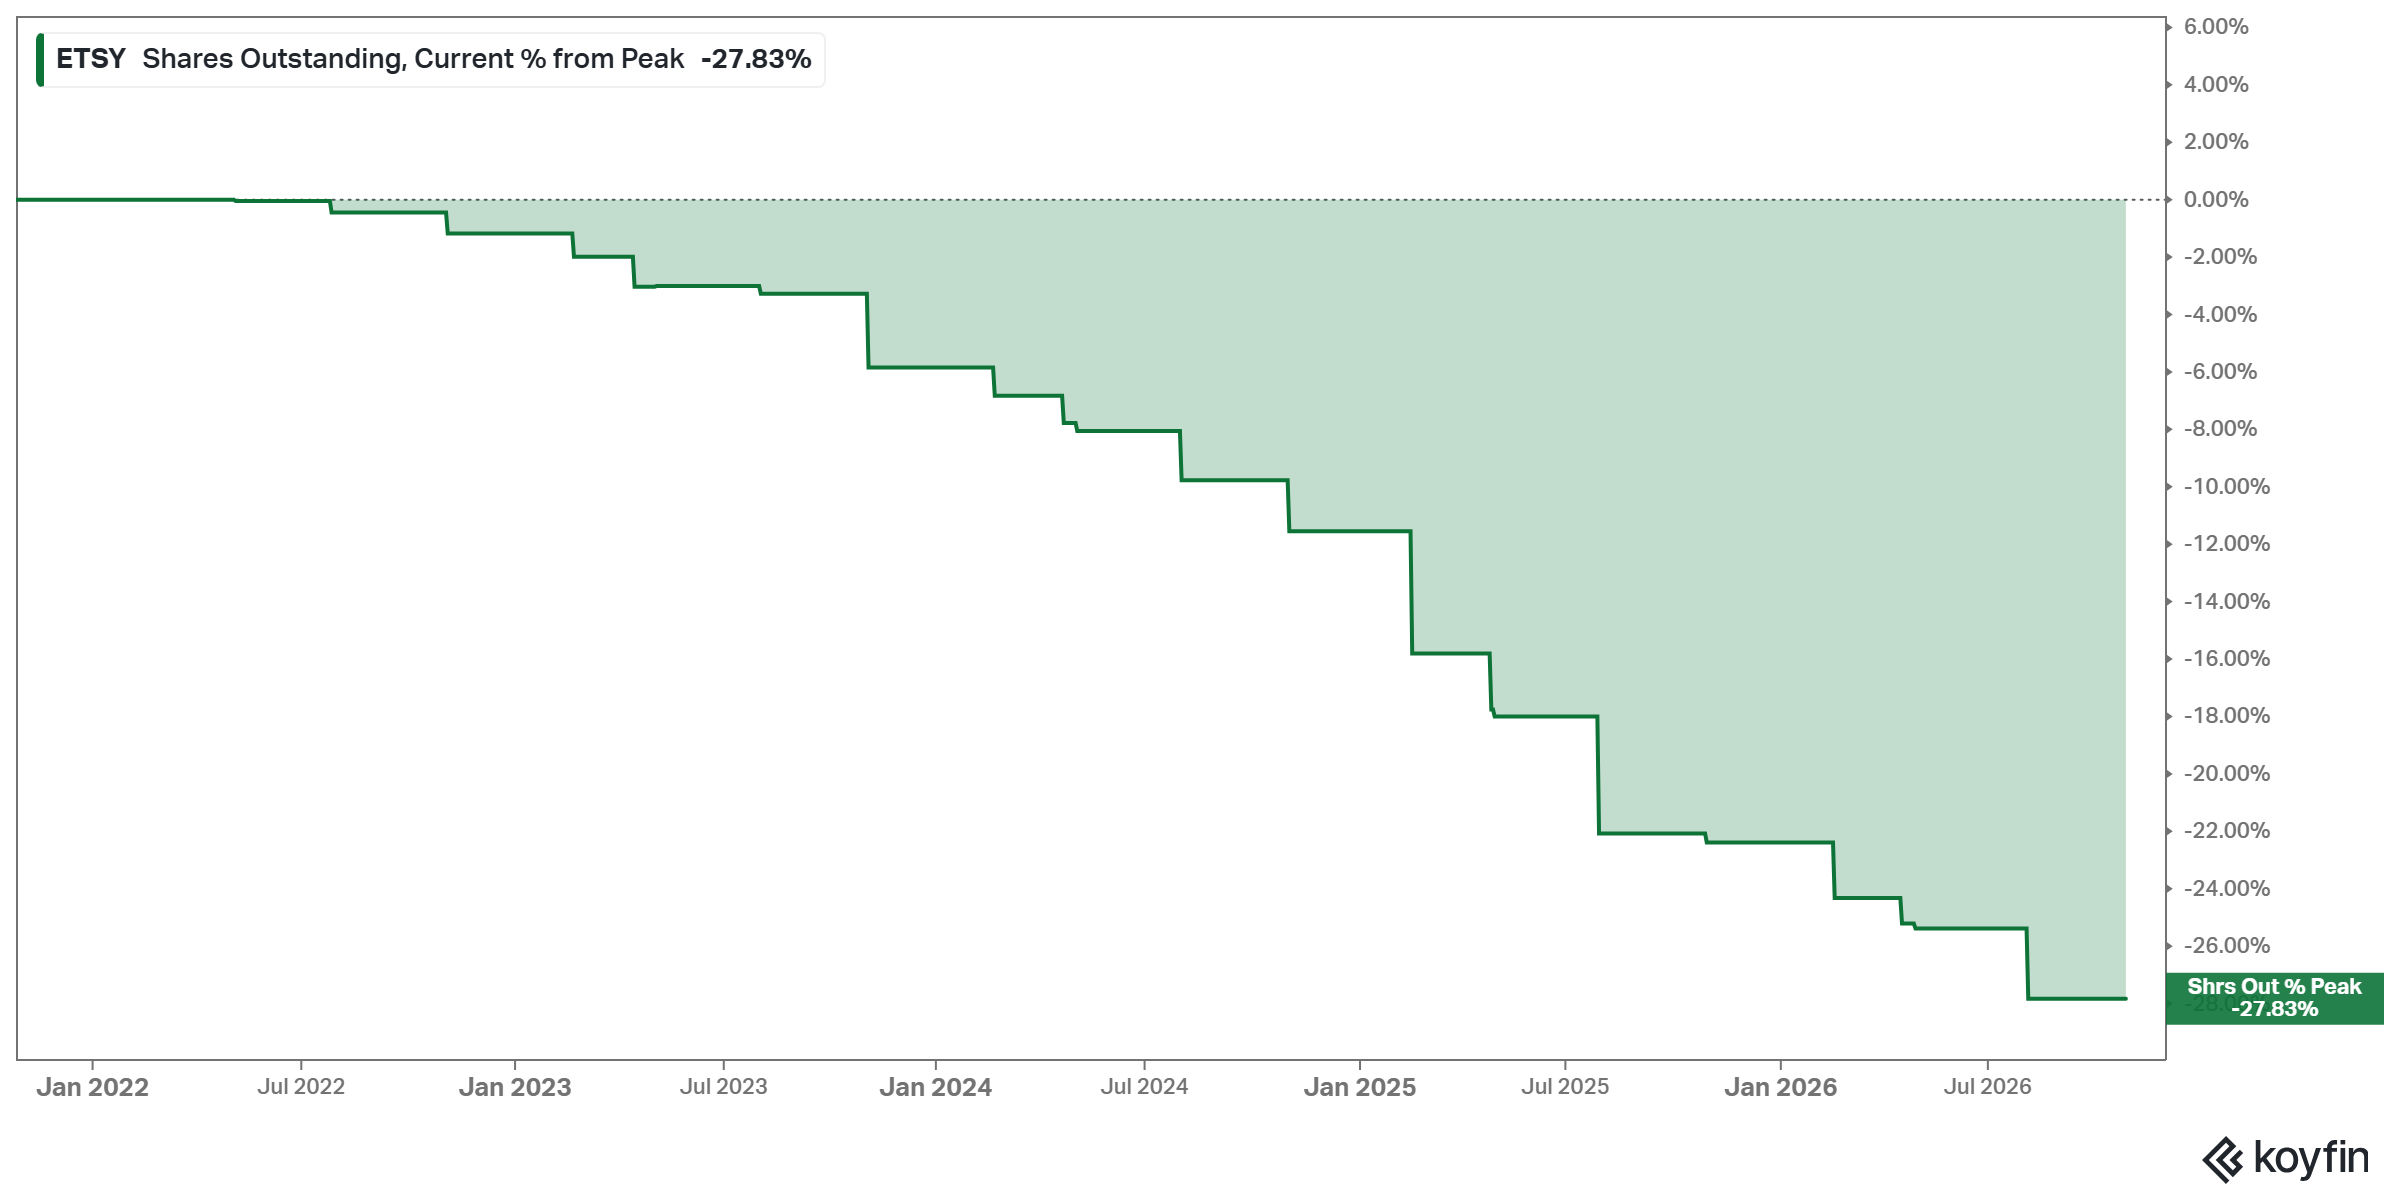
So while shares have more than doubled off the ~$40 Liberation Day lows, the stock remains ~70% below its 2021 peak and trades at just 13.3x forward earnings, hardly a stretch for a business back in growth mode. With the business accelerating, self-help initiatives still in the early innings, and management aggressively shrinking the share count, we think Etsy’s comeback has a long way to run.
Q3 Earnings Breakdown
10 Key Points
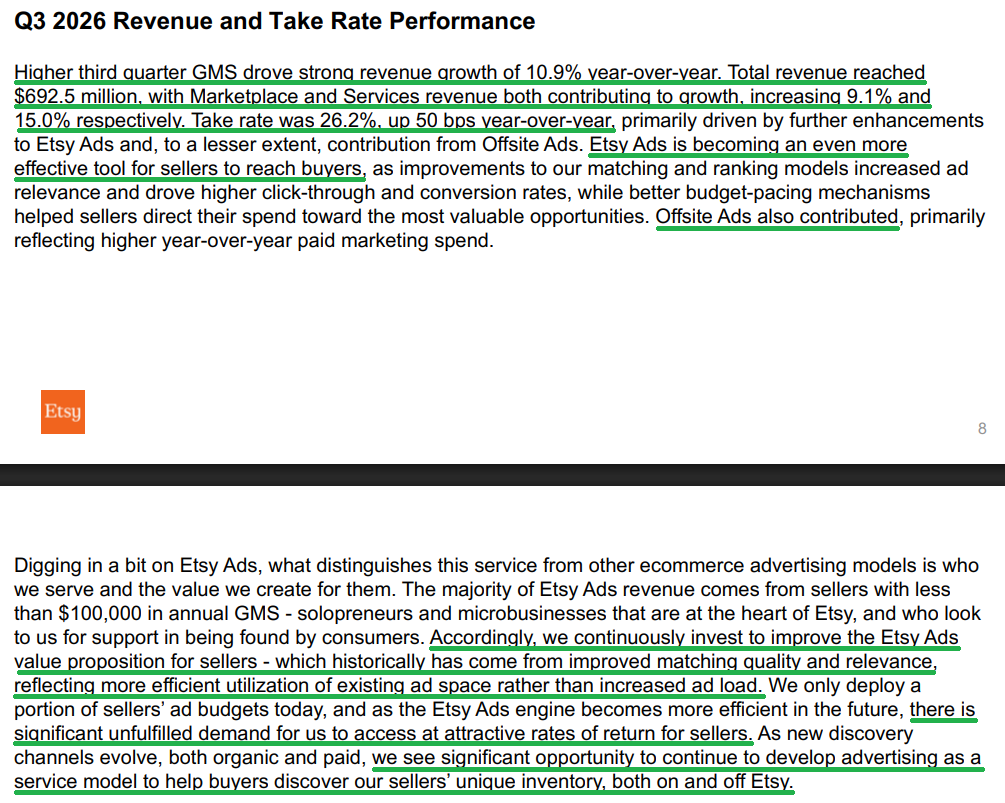
1) Etsy delivered Q3 revenue of $692.5M (+10.9% Y/Y), ahead of consensus of $668.1M and accelerating from +9.3% Y/Y in Q2. Marketplace revenue increased +9.1% to $468.1M, while higher-margin services revenue grew +15.0% to $224.3M, with services continuing to outpace marketplace revenue on the strength of Etsy Ads.
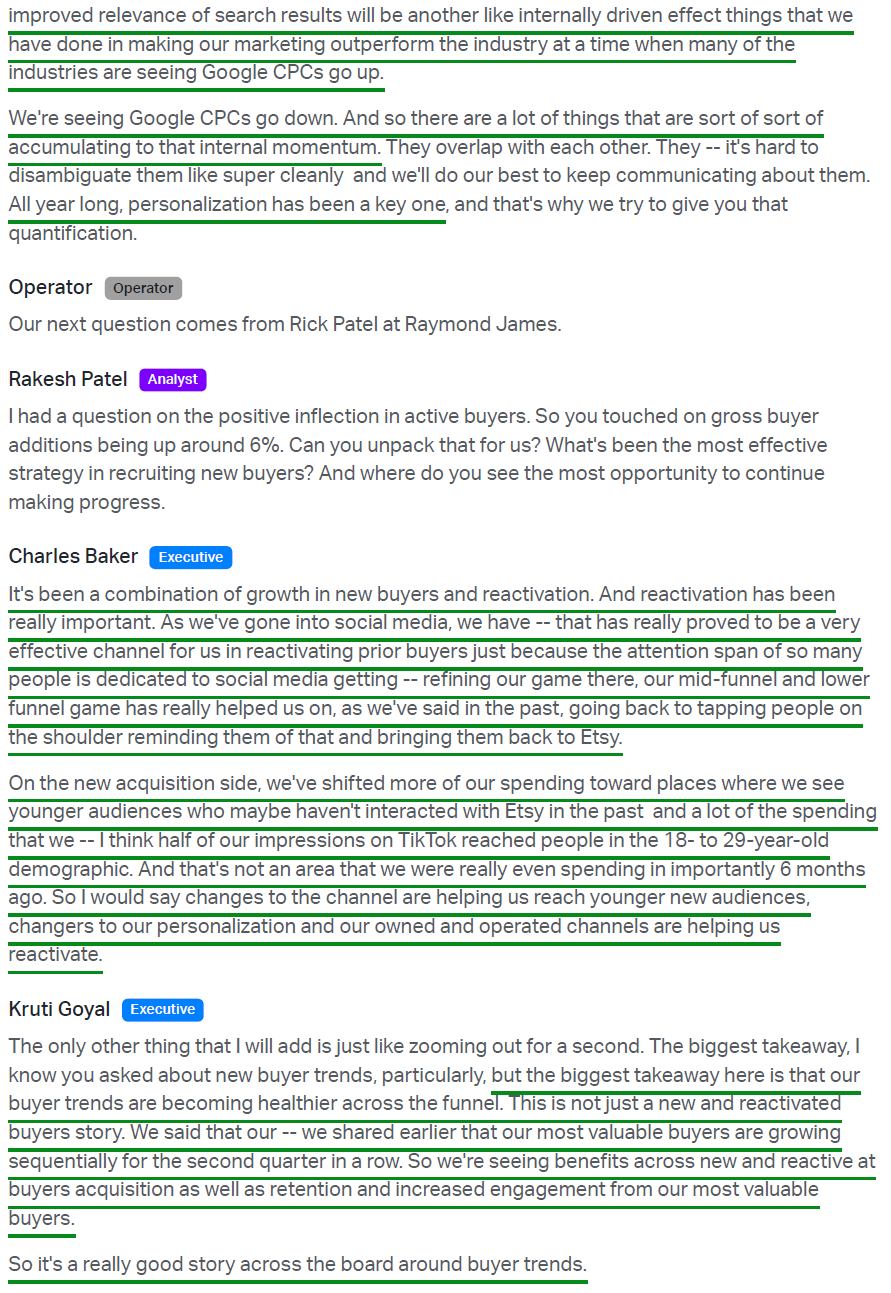
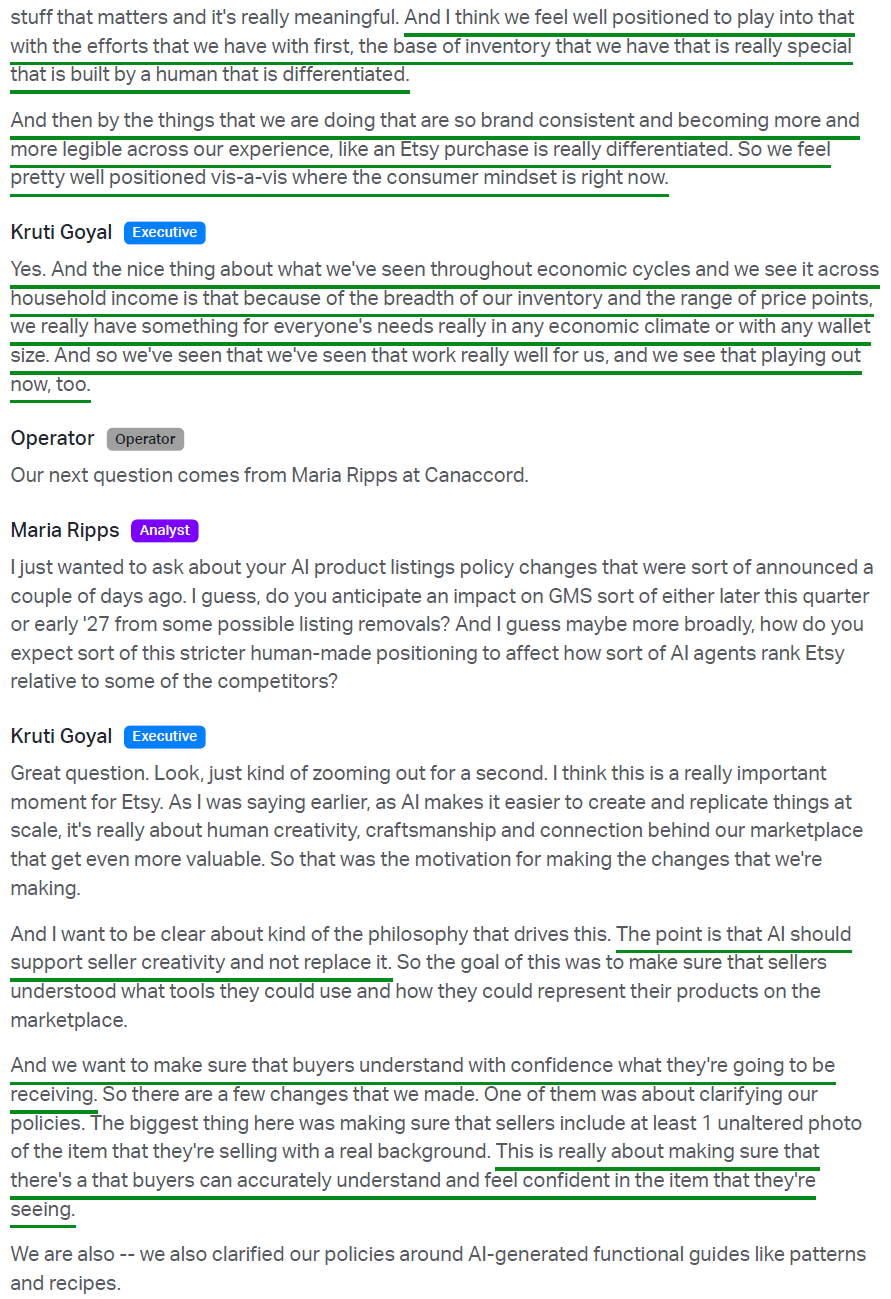
2) Etsy marketplace GMS reached $2.65B (+8.8% Y/Y, +9.1% Y/Y currency-neutral), ahead of consensus of $2.57B and above prior guidance of $2.53B to $2.58B (+4% to +6% Y/Y). Excluding FX, growth accelerated ~190 bps from Q2, marking the sixth consecutive quarter of sequential improvement. Growth was broad-based across U.S. and non-U.S. buyers, as well as across all U.S. household income cohorts. The mix of that growth is also shifting toward Etsy’s own initiatives as earlier external tailwinds from FX, tariff-driven listing price increases, and easier comps fade. Management estimates that personalization alone contributed ~2 percentage points to annualized GMS growth by Q3, with improved search relevance and more efficient marketing adding to that internal momentum.
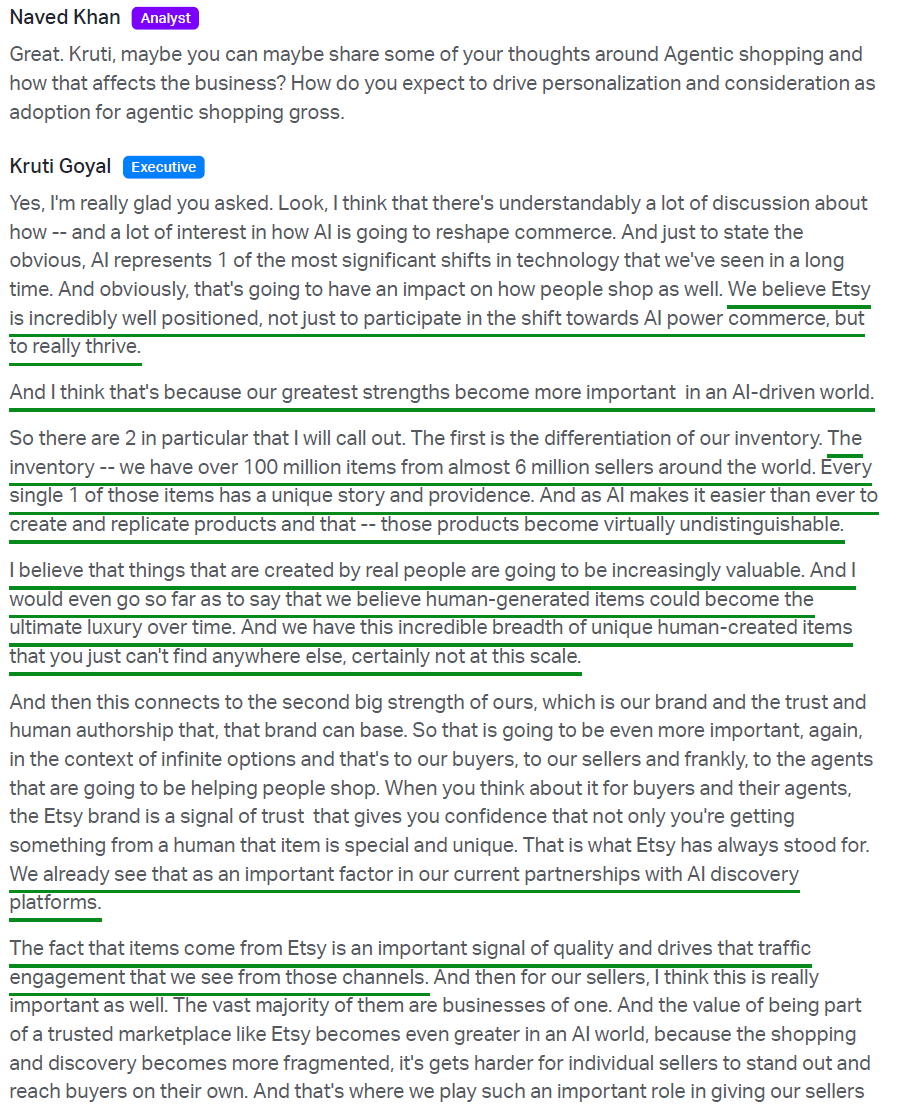
3) Growth broadened beyond the mobile app in Q3, with non-app GMS more than doubling its growth rate to +7.5% Y/Y (vs. +3.4% in Q2). App GMS grew +10.4% Y/Y (vs. +12.5% in Q2) and held steady at ~47% of total GMS. The app has served as Etsy’s testing ground for deeper personalization because every app user is signed in, giving Etsy better data to learn from. Management is now extending those learnings across the web and even to signed-out users. Richer buyer profiles now power personalized feeds, recommendations, and owned marketing for four out of five active buyers, with management seeing no significant technical hurdles to bringing the non-app experience up to the same standard.
4) Active buyers returned to Y/Y growth for the first time in two years, rising +1.0% to 87.5M, with ~540K added sequentially. Gross buyer additions grew +6.2% to 12.1M, with new buyers of 5.0M (+4.8% Y/Y) and reactivated buyers of 7.1M (+7.2% Y/Y). Retention among existing buyers also began to improve, with repeat buyers (34.7M) and habitual buyers (6.0M) growing sequentially for the second straight quarter. TTM GMS per active buyer reached $126 (+3.9% Y/Y, +1.4% Q/Q), marking the third consecutive quarter of growth. On the supply side, active sellers grew +6.5% Y/Y to 5.8M, the fastest pace in two years, with seller retention at its highest level since 2021 and GMS per seller accelerating.
5) Take rate expanded +50 bps Y/Y to 26.2%, ahead of prior guidance of ~26%. With the Reverb divestiture now fully lapped, the expansion came entirely from the core marketplace, led by Etsy Ads. Improvements to matching and ranking models increased ad relevance and lifted click-through and conversion rates, while better budget pacing directed seller spend toward the most valuable opportunities. Offsite Ads contributed to a lesser extent, benefiting from higher paid marketing spend.
6) Adjusted EBITDA came in at $210.4M (30.4% margin, +100 bps Y/Y), ahead of the $195.9M consensus and above the high end of prior guidance of 28% to 30%. EBITDA grew 14.6% Y/Y, outpacing revenue for the second consecutive quarter. The August restructuring supported the result, with product development holding flat at 16.0% of revenue. G&A also gained leverage, falling to 10.7% of revenue (vs. 11.8%). Marketing was the one line that deleveraged, rising to 29.9% of revenue (vs. 27.8%) as management reinvested efficiency gains from earlier in the year to drive profitable GMS growth.
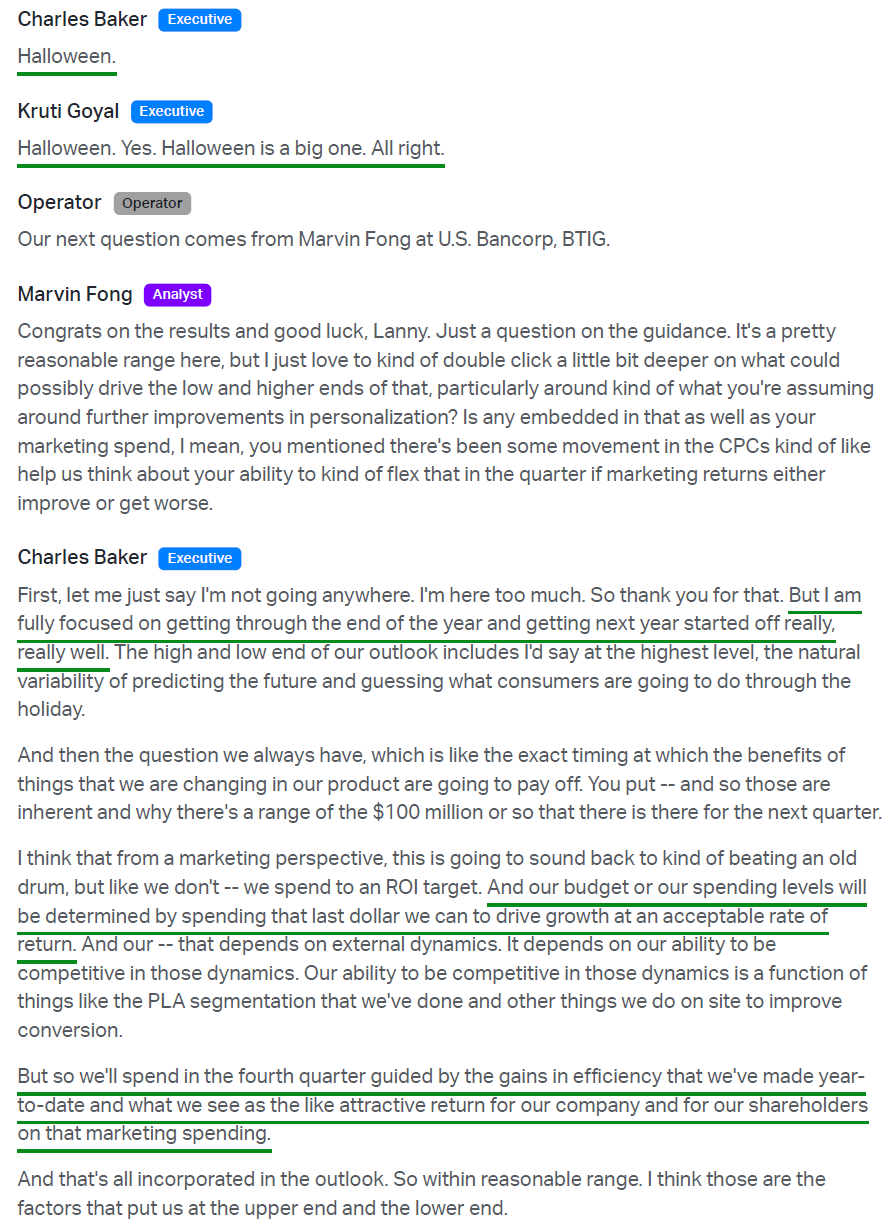
7) Marketing remains one of Etsy’s most effective growth levers, with GMS from marketing growing faster than spend and ROI improving meaningfully Y/Y. Better segmentation of product listing ad feeds strengthened paid search, with Etsy seeing Google cost-per-click decline at a time when much of the industry is seeing it rise. Paid social is scaling at attractive returns on TikTok and YouTube, with ~half of TikTok impressions reaching 18- to 29-year-olds, a channel where Etsy barely spent six months ago. Brand work centered on human connection is also landing, with the Daisy Chain Fields festival activation and Olivia Rodrigo collection launch generating 26M social impressions and 10M+ views, making it Etsy’s top-performing press campaign ever.
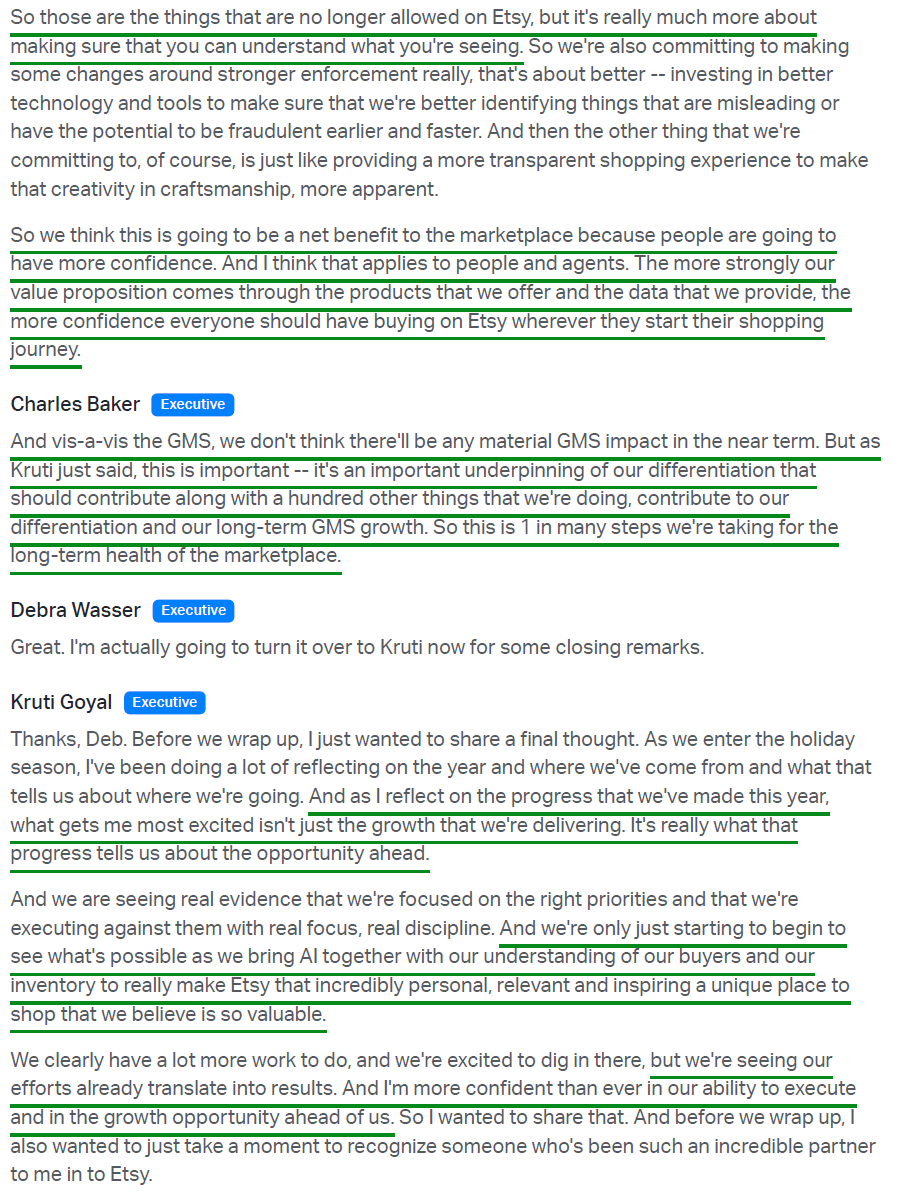
8) Etsy is positioning AI as a tool to strengthen its differentiation, with management viewing its 100M+ listings of human-made, one-of-a-kind items as increasingly valuable as AI makes mass-produced goods easier to replicate. During the quarter, Etsy expanded its on-site AI tools by extending the Gifting Assistant beta, its first shopping agent, to wedding shoppers, alongside an AI-powered seller assistant that offers each shop personalized insights. Off-site, agentic partnerships with OpenAI, Google, and Microsoft remain early but continue to introduce high-intent shoppers who often return to Etsy to complete their purchases.
9) Etsy generated $236.4M of free cash flow from continuing operations in Q3 (+10.3% Y/Y), converting 112% of adjusted EBITDA into FCF. Capital return accelerated alongside it, with Etsy repurchasing $394.6M of stock (~5.2M shares) during the quarter, up ~58% from Q2’s $250M. Management expects to continue repurchasing shares at an accelerated rate, with $2.2B of authorization remaining, building on a ~28% reduction in shares outstanding over the past five years. Etsy ended the quarter with $2.5B in cash and investments, boosted by the Depop proceeds, before paying $648.6M on October 1 to settle the remaining 2019 notes and reduce total debt.
10) Management guided Q4 2026 Etsy marketplace GMS to $3.46B to $3.52B (+5% to +7% Y/Y), ahead of consensus of $3.42B, with a take rate of ~25.6% and an adjusted EBITDA margin of ~30%. That outlook holds despite FX turning into a modest headwind and prior-year comparisons becoming less favorable. For the full year, GMS growth is now expected at ~7%, up from prior guidance of mid-single-digit growth, alongside a take rate of ~25.8% and an adjusted EBITDA margin of ~30% (vs. 29% to 30% previously).
Earnings Call Highlights
General Market
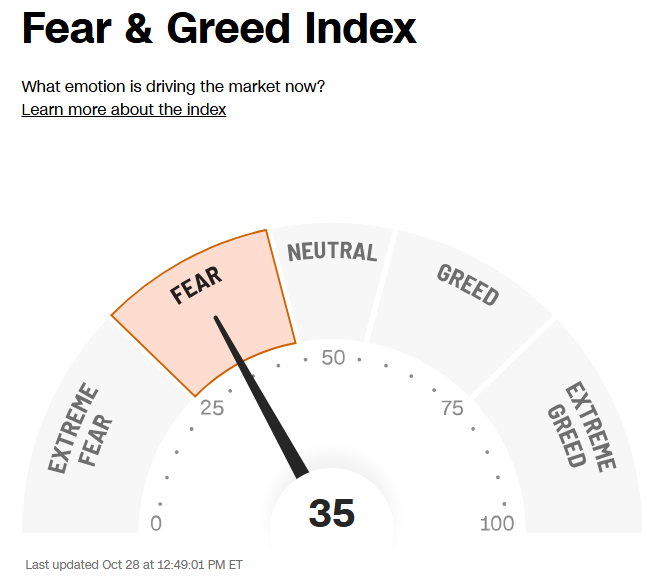
The CNN “Fear and Greed Index” ticked up to 35 this week from 28 last week. You can learn how this indicator is calculated and how it works here: (Video Explanation)
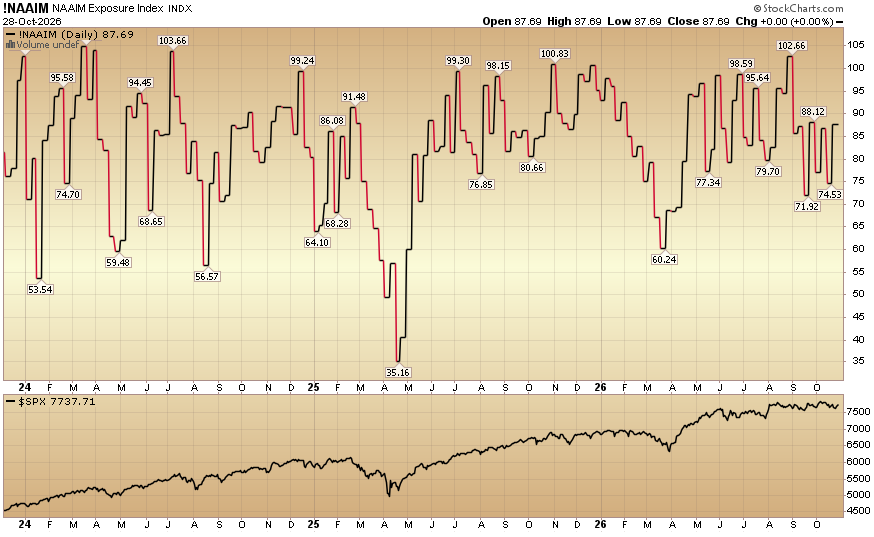
The NAAIM (National Association of Active Investment Managers Index) (Video Explanation) ticked up to 87.69% equity exposure this week from 74.53% last week.
Our podcast|videocast will be out sometime today. We have a lot of great data to cover this week. Each week, we have a segment called “Ask Me Anything (AMA)” where we answer questions sent in by our audience. If you have a question for this week’s episode, please send it in at the contact form here.


Comments
Log in or sign up to join the conversation.