

Cooper Standard Update
For newer readers, here’s a quick overview of the key drivers behind our thesis on Cooper Standard (CPS), a special situation auto supplier offering a leveraged play on the light vehicle production recovery and the massive operating leverage that comes with it:
Company Overview
Founded in 1960. Headquartered in Northville, Michigan, with operations in 20+ countries.
Leading global automotive supplier: #1 in sealing systems (~14% share in a ~$10.0B market) and #2 in fluid handling systems (~8.3% share in a ~$14.4B market). ~95% of revenue from light vehicle production.
Revenue mix: ~51% sealing, ~46% fluid handling, ~3% other.
Geographic mix: ~56% North America, ~21% Europe, ~15% APAC, ~5% South America.
Top customers: Ford (~27%), GM (~19%), Stellantis (~10%). Average content per vehicle on top 10 platforms: ~$190 (Ford F-150 is the #1 platform at ~$450 CPV). Chevrolet Traverse is the #6 platform, Jeep Cherokee #10.
FY2025 revenue: $2.74B (+0.4%). Q3 revenue $708.6M (+1.9% Y/Y, +1.3% ex-FX) despite global light vehicle production -2.3% Y/Y. Sealing $350.3M (+0.4% Y/Y), Fluid Handling $335.1M (+2.0% Y/Y).
Position built in the 2022 downturn. An early-cycle light vehicle recovery drives best-in-class operating leverage for CPS.
Special situation auto supplier mirroring Charlie Munger’s Tenneco play in 2001-2003 (restructured via closures/layoffs, refinanced debt, removed the solvency overhang; stock ~7-10x from lows).
Margin Expansion & Cost Savings
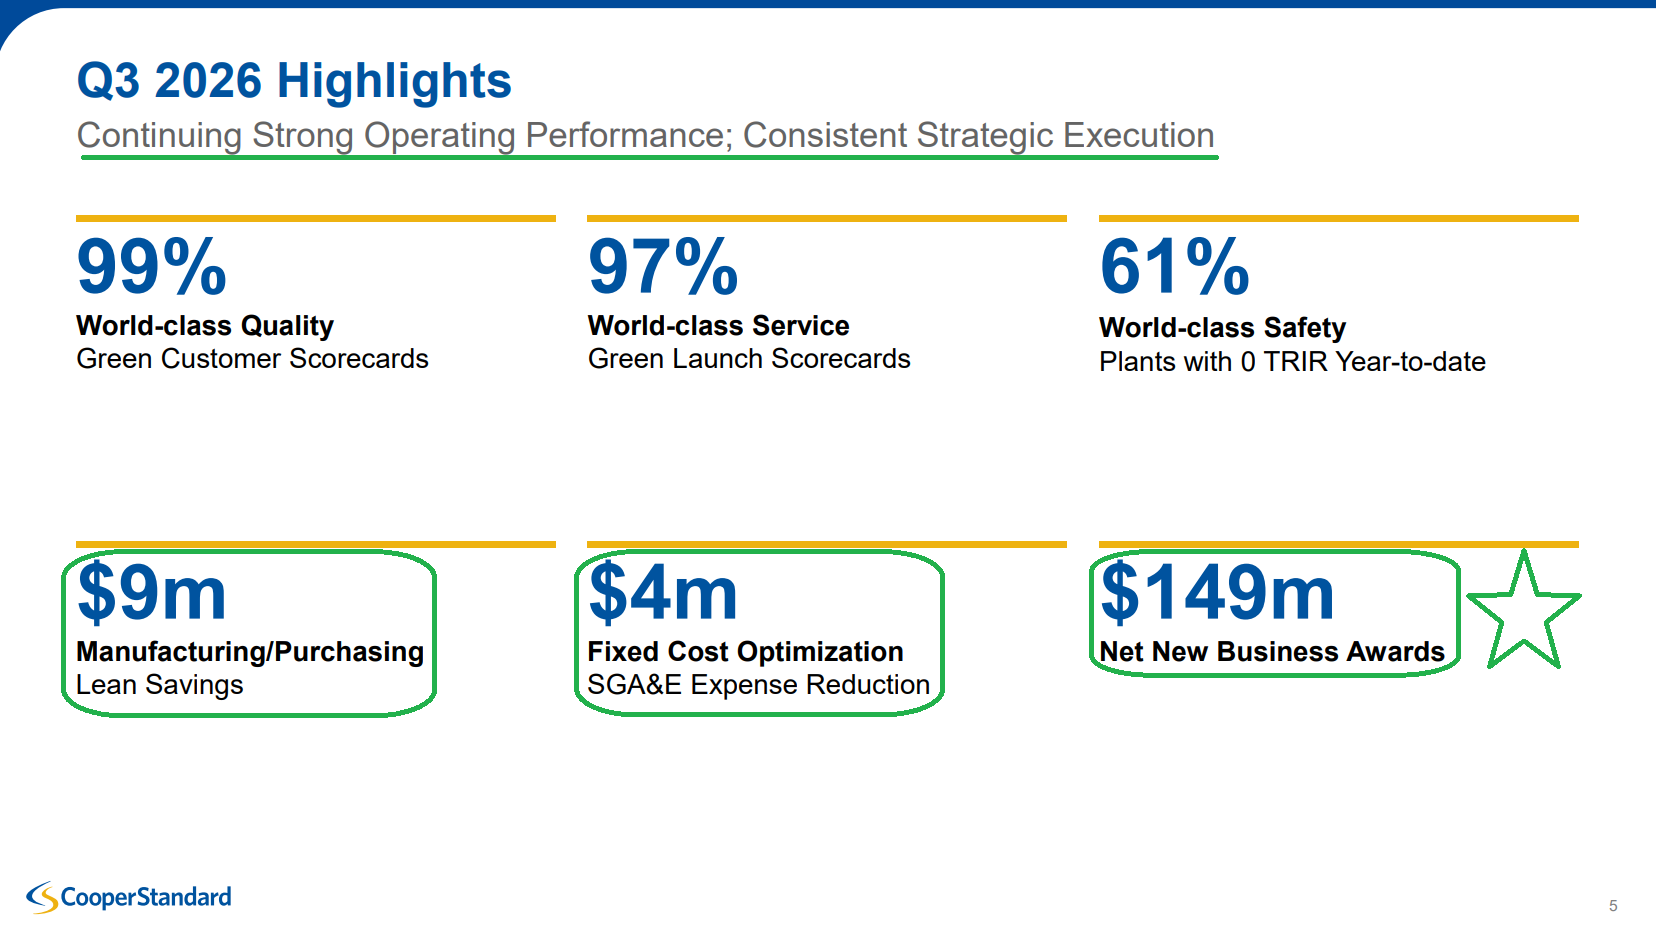
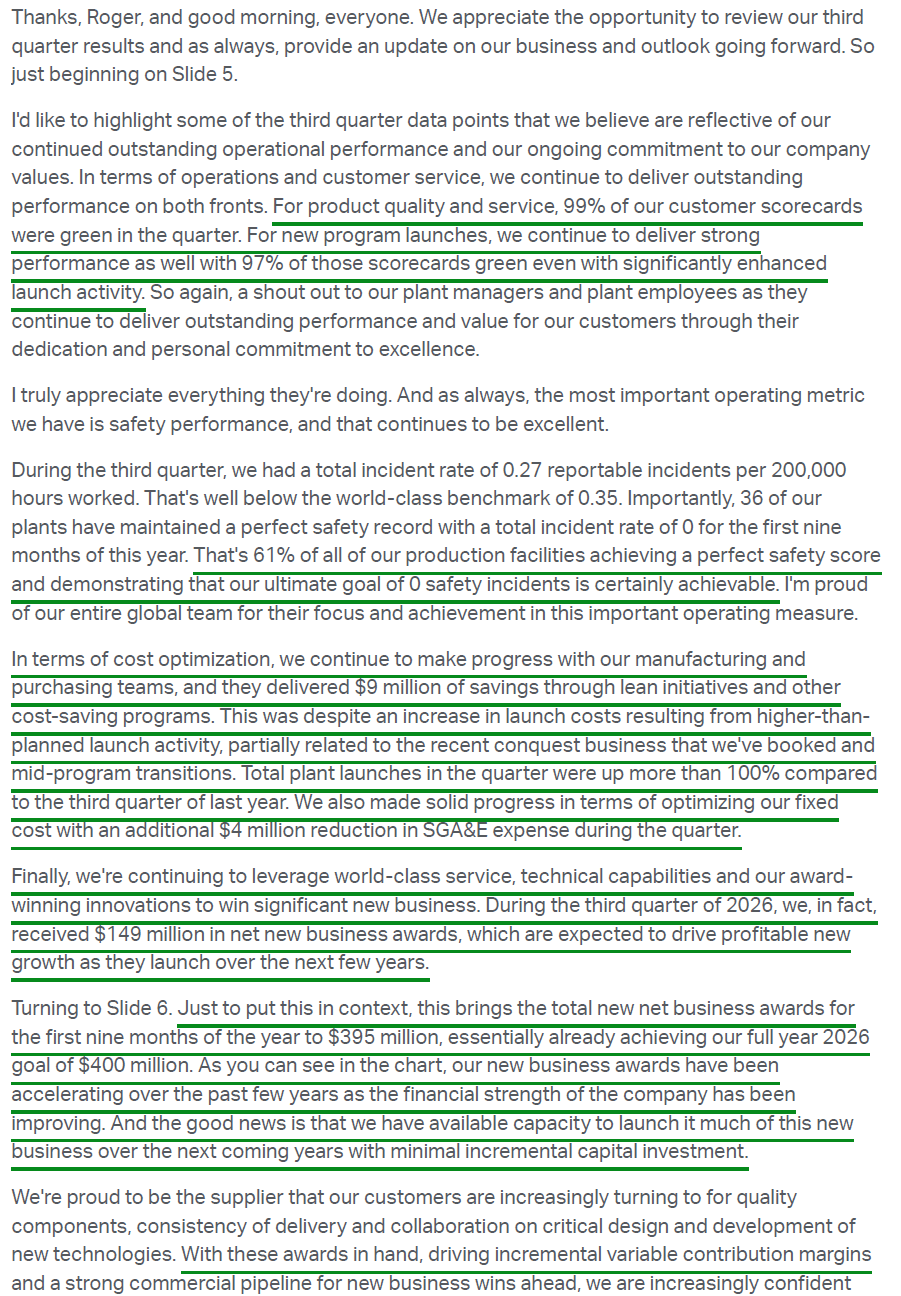
Cumulative sustainable savings since 2019: ~$755M (averaged >$100M annually), with $9M lean savings + $2M restructuring savings added in Q3 FY26 (YTD: $40M lean + $5M restructuring). Another ~$40M of productivity savings expected in Q4.
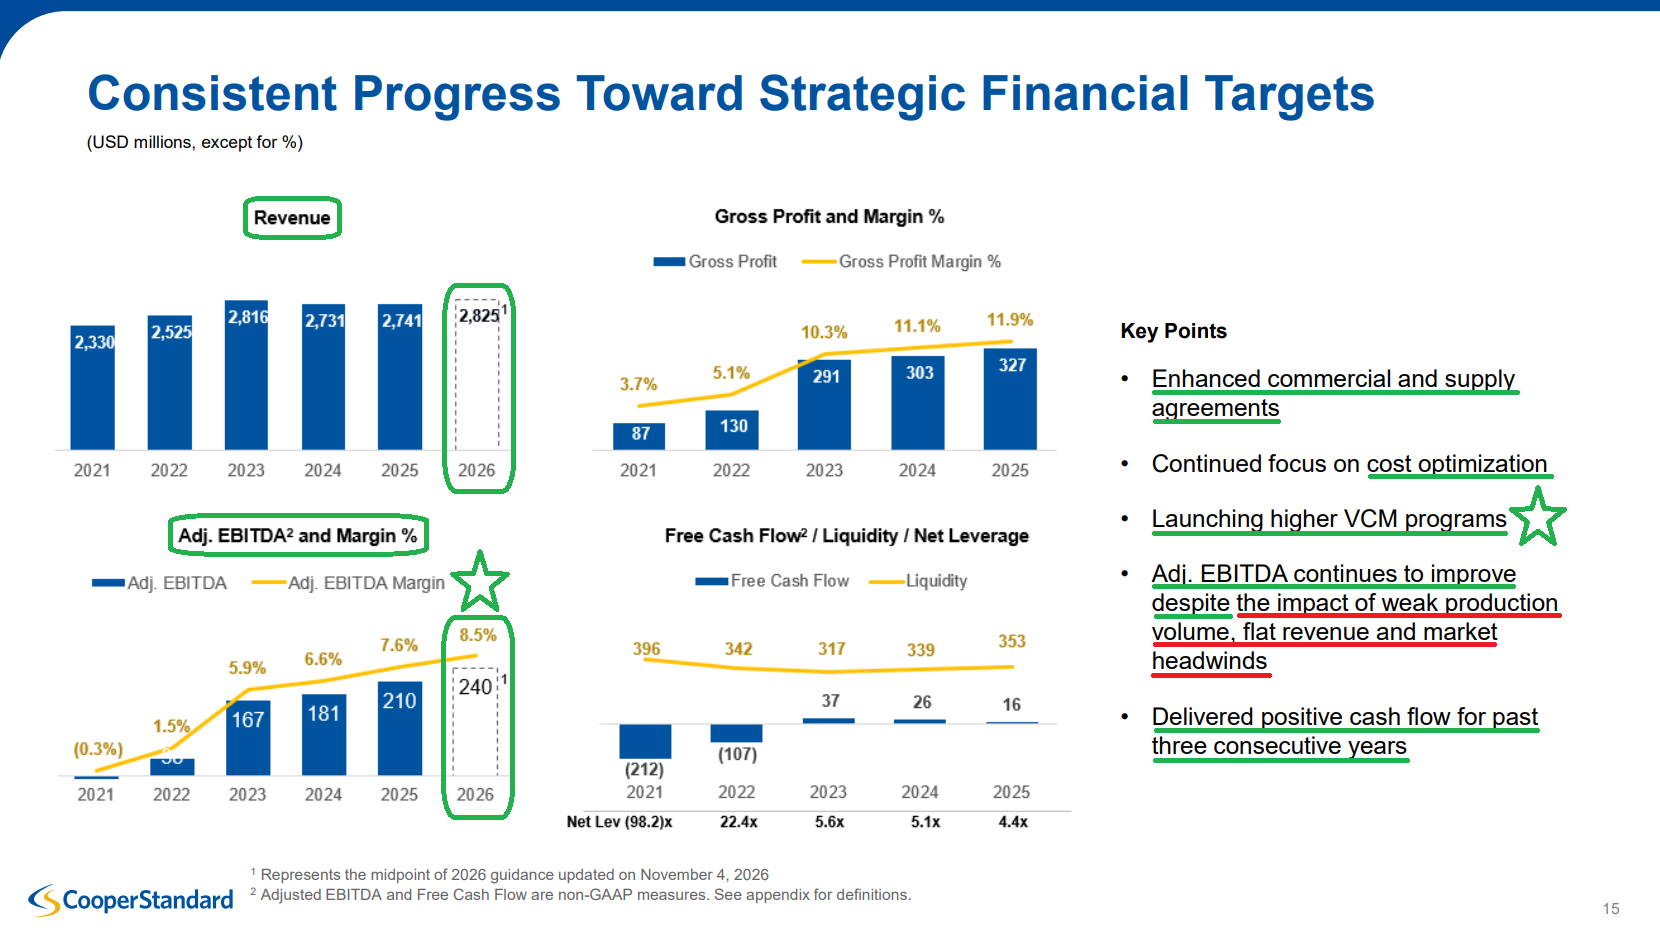
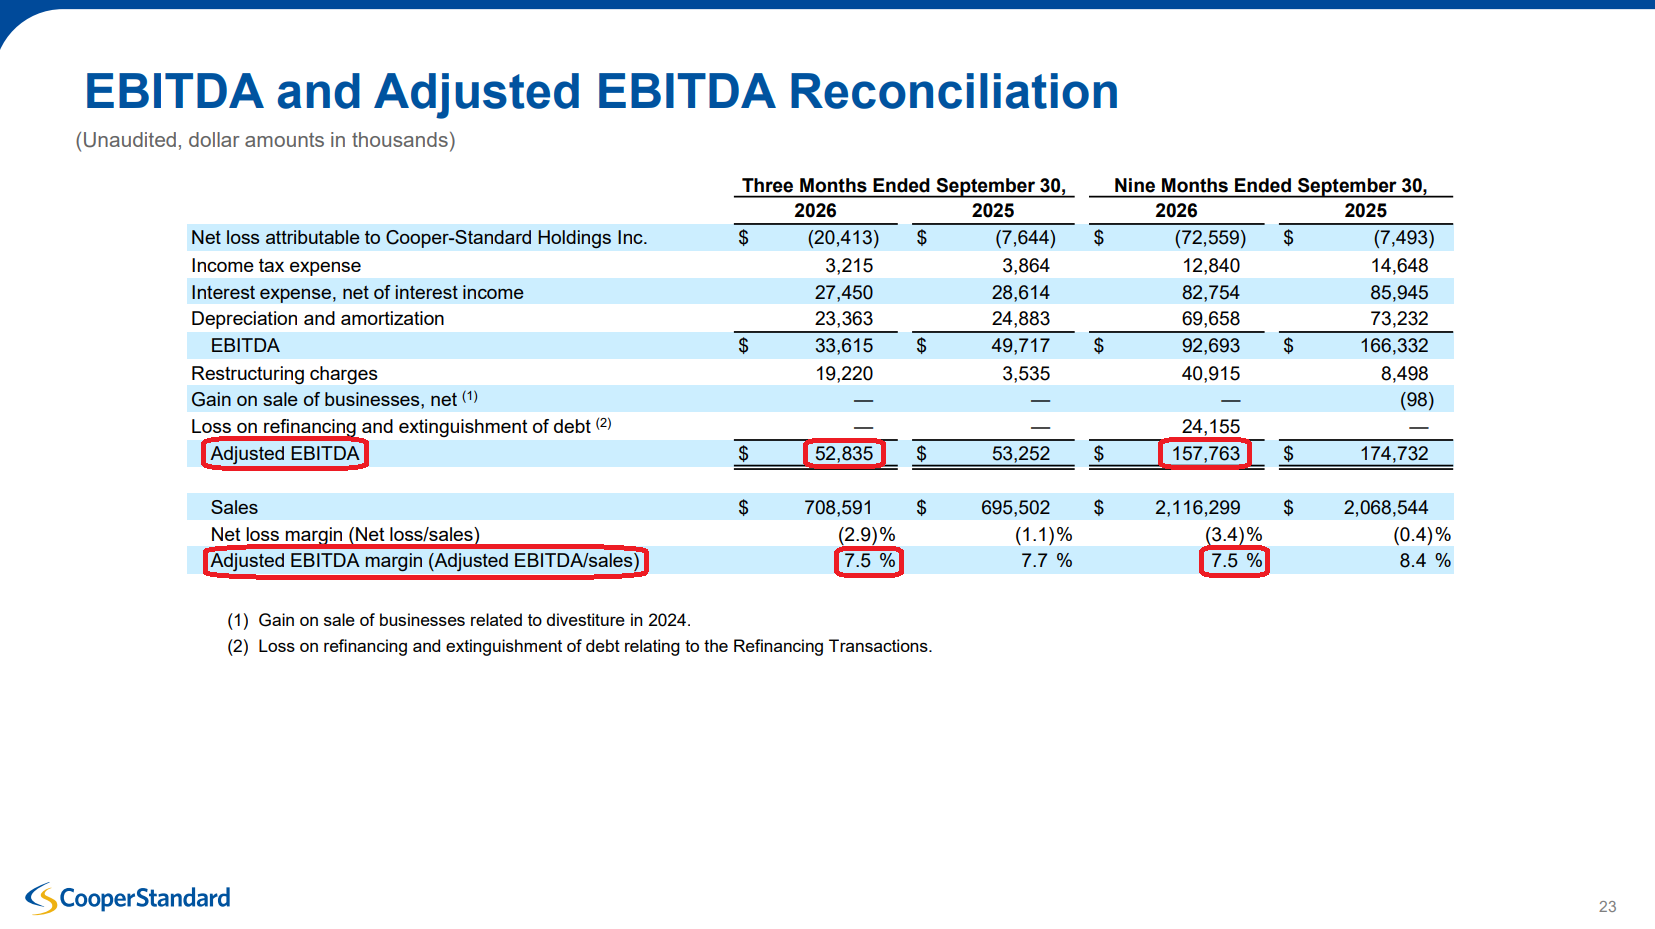
FY2025: adjusted EBITDA $209.7M (7.6% margin, +100 bps Y/Y). Gross margin +80 bps to 11.9%.
Adjusted EBITDA up ~44% from 2023 ($167.1M) to ~$240M in 2026E, with margins from 5.9% to ~8.6%, despite NA production falling every year since 2023 and revenue stuck in a $2.7B-$2.8B range.
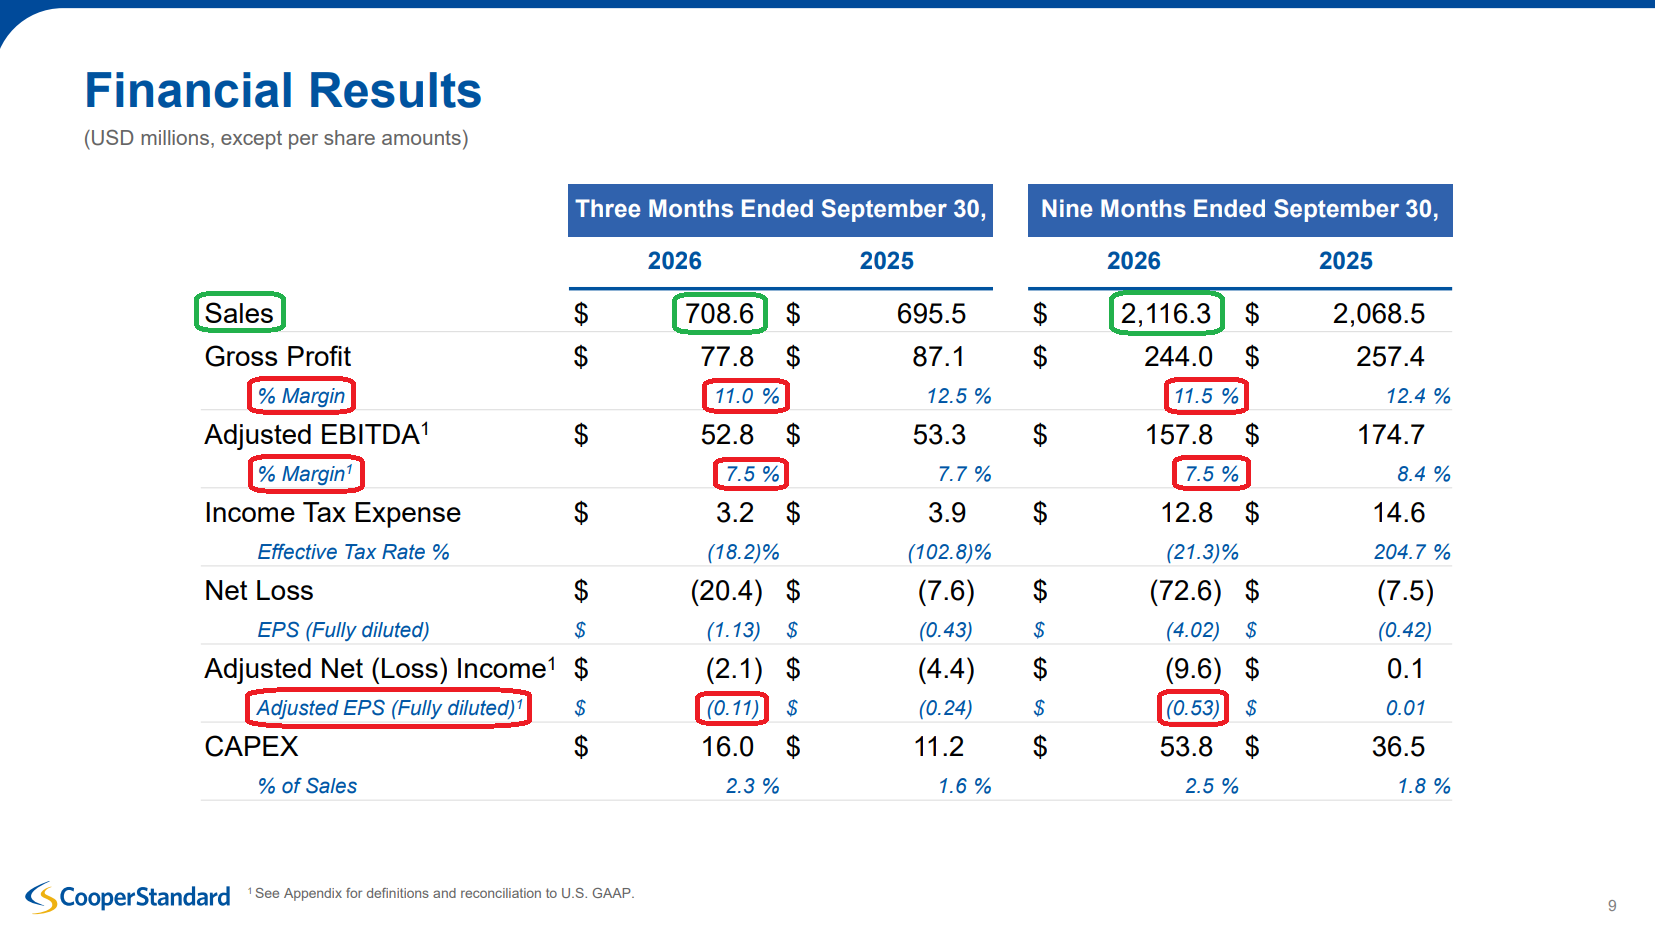
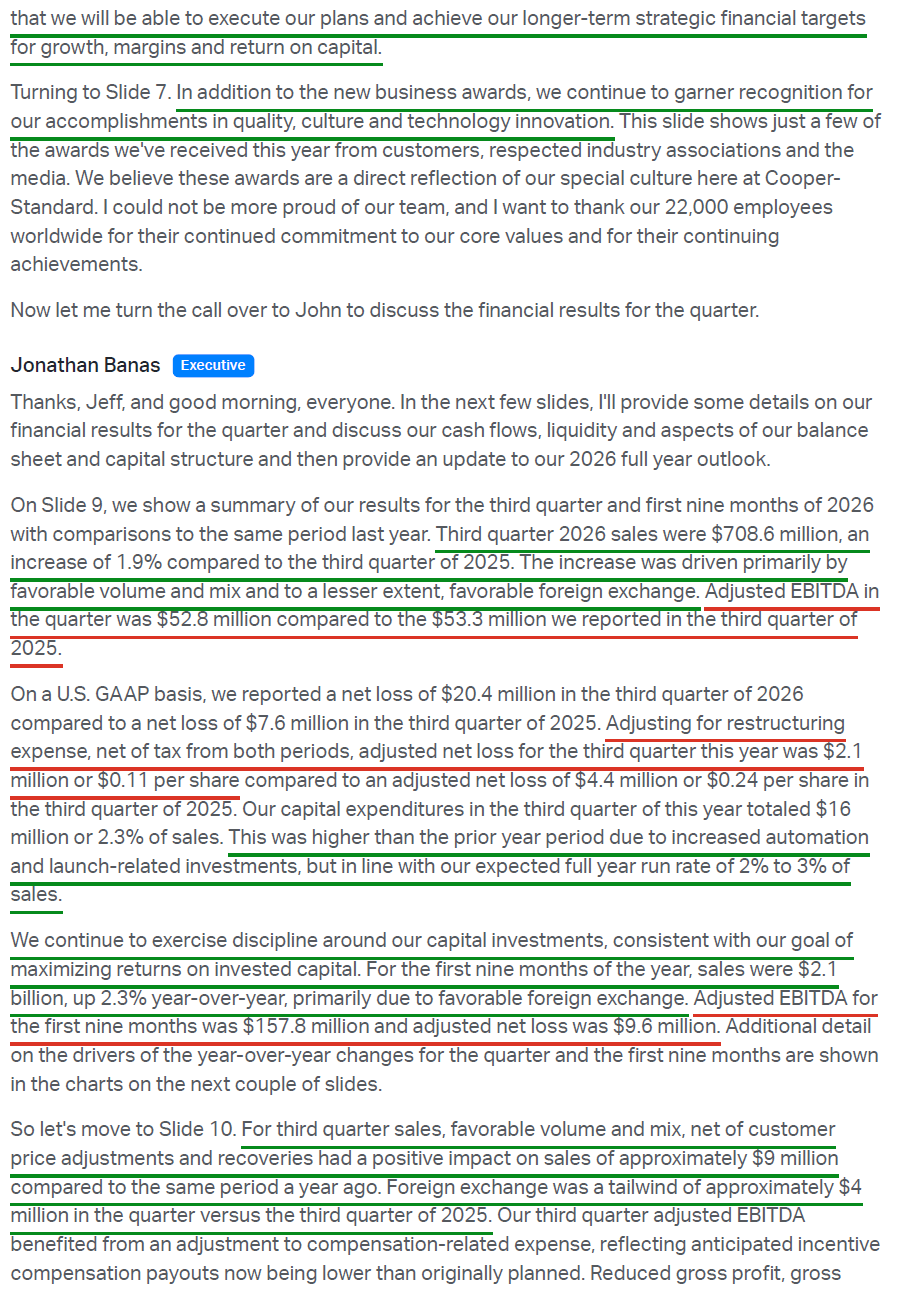
Q3 adjusted EBITDA $52.8M (7.5% margins), -0.8% Y/Y, vs consensus of $71.1M. Sealing EBITDA margin 8.3%, Fluid Handling 9.6%.
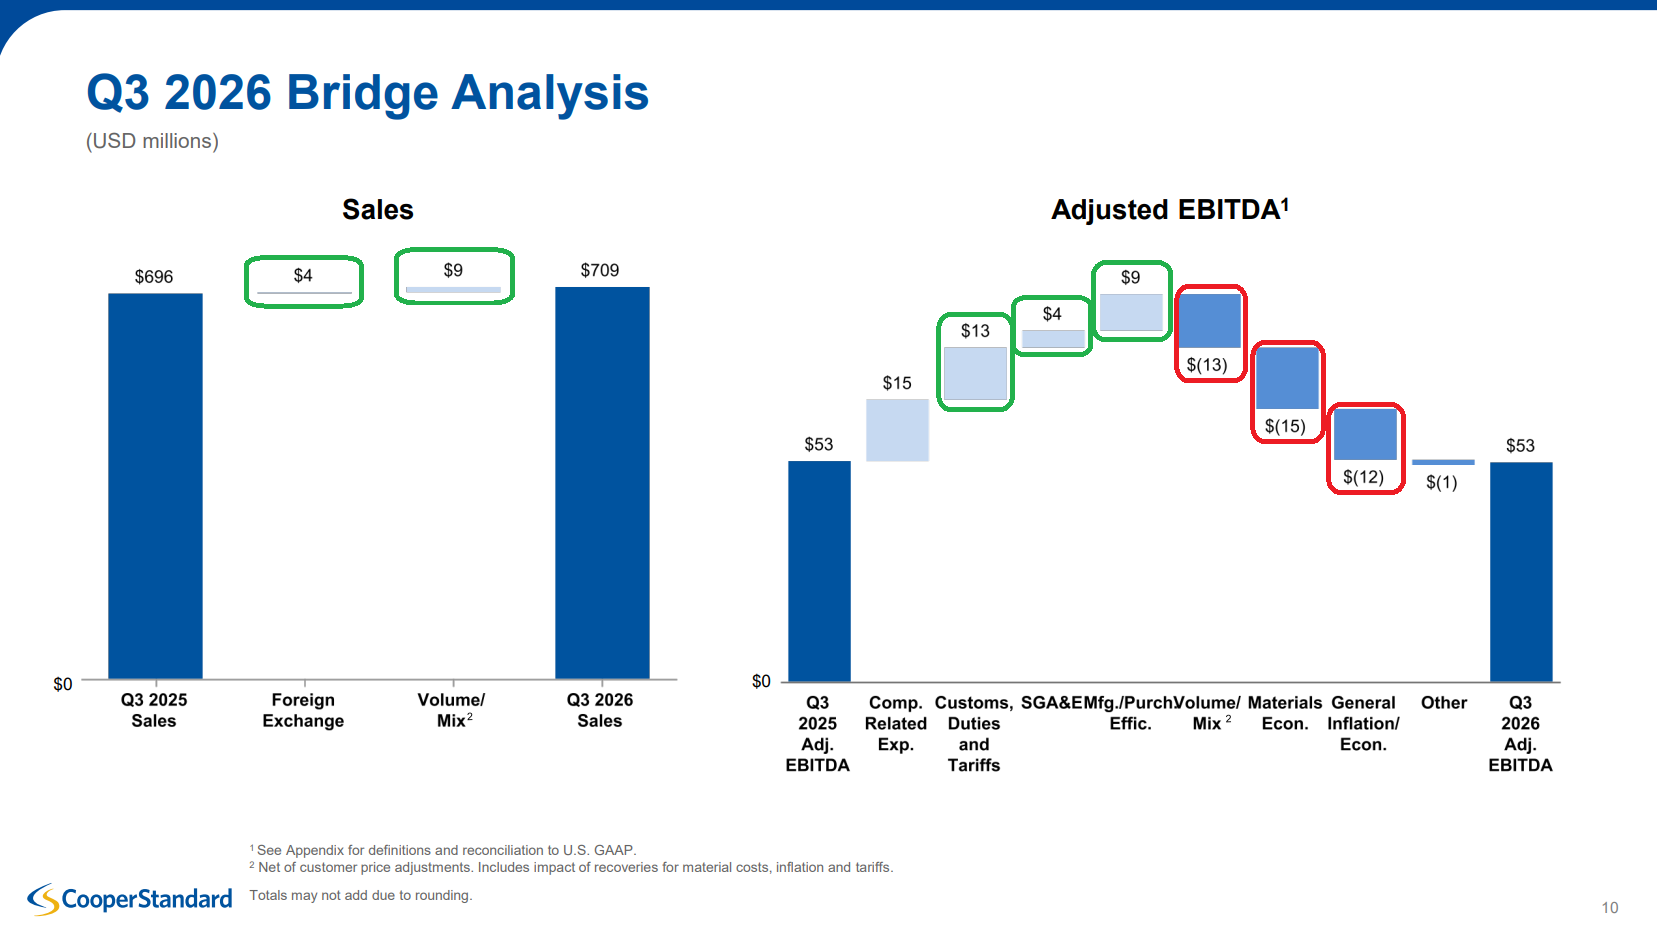
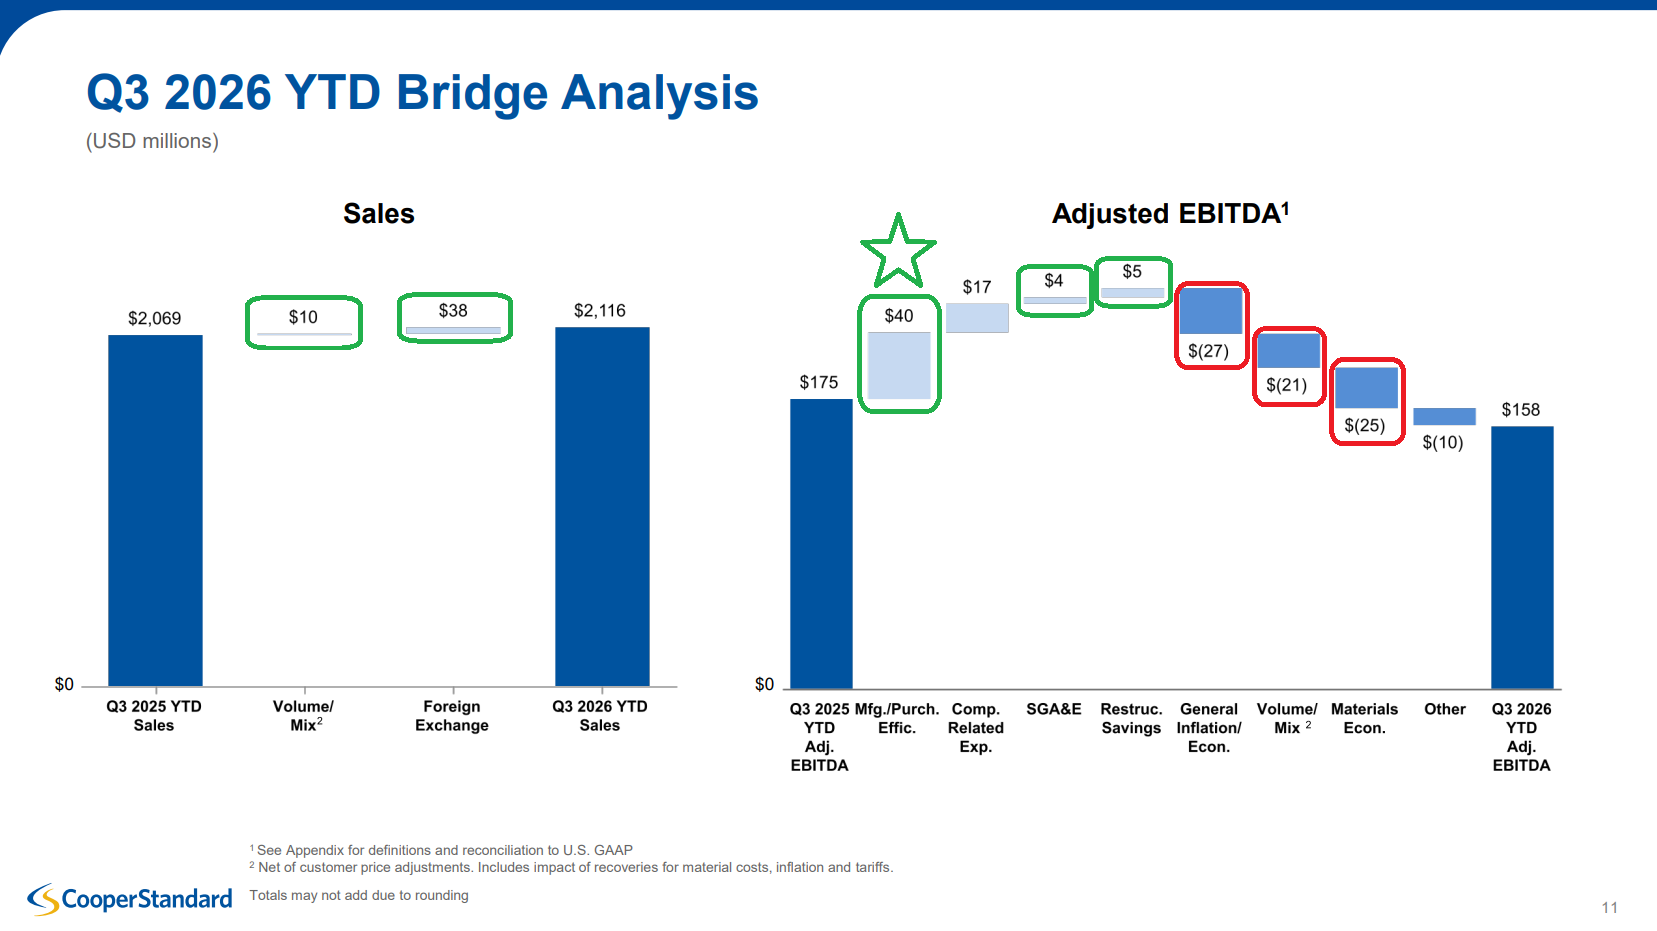
Q3 adjusted EBITDA ~flat Y/Y: +$15M lower incentive comp, +$13M lower duties/tariffs, +$9M lean savings, +$4M lower SGA&E, offset by -$15M materials, -$13M volume/mix net of recoveries, -$12M wages/inflation.
Oil running $30-$40/bbl above the ~$65 plan assumption, with aluminum also elevated. Index-based recoveries lagging on timing, some pushing into 2027, majority of 2026 commodity costs still expected to be recovered. Each $1/bbl of oil = ~$400K-$450K of annual cost.
Index-based contracts cover >70% of commodity exposure, remainder negotiated on a rolling basis. First real test of the agreements: negotiating shorter resets, refining indices, pushing back on customer tooling financing (tooling receivables $91.6M vs $72.3M at year end). Goal is a further de-risked business into 2027.
Q3 gross profit $77.8M (11.0% margins, -10.7% Y/Y, -150 bps Y/Y). YTD gross margin 11.5% vs 12.4%.
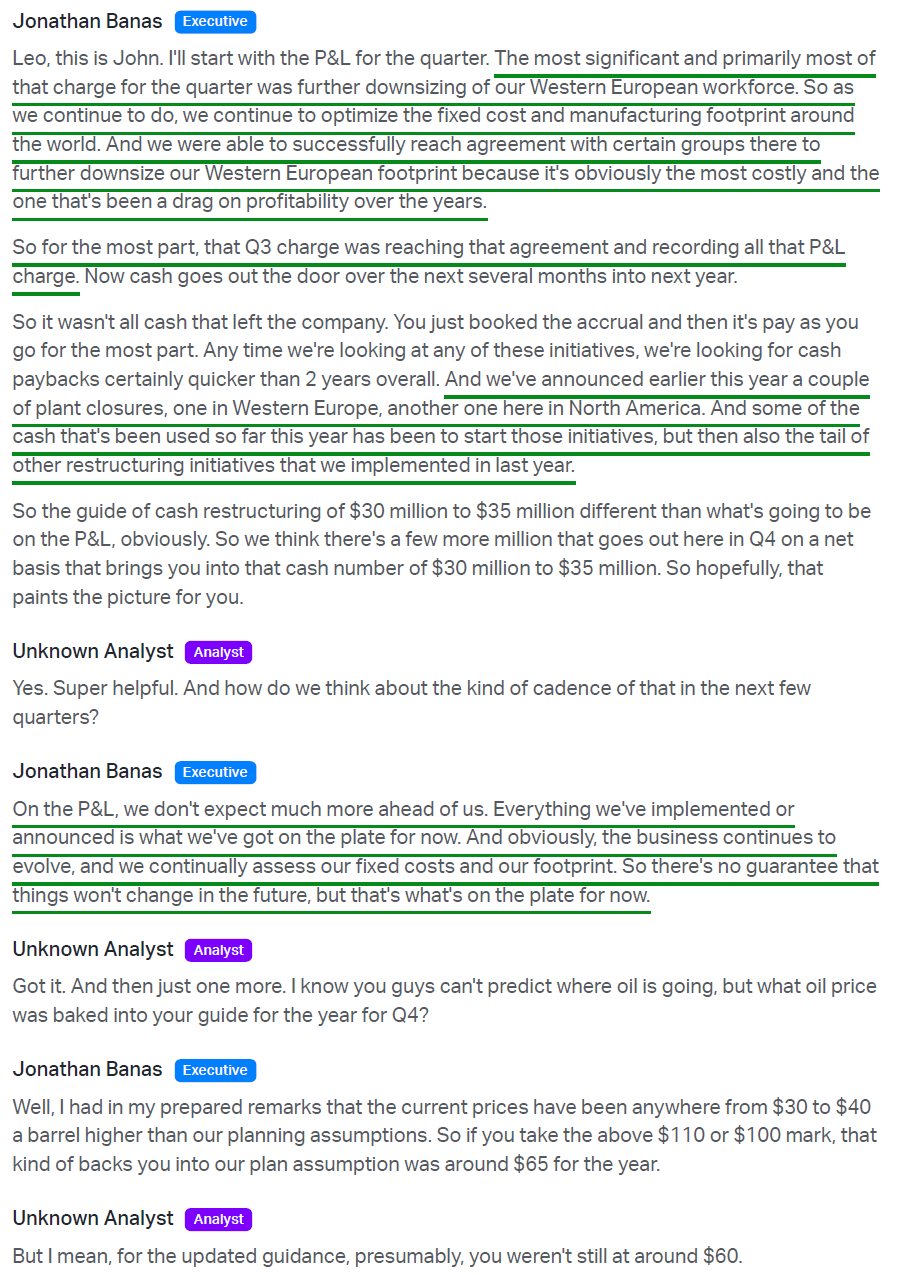
Q3 restructuring charges $19.2M, mostly Western European workforce downsizing (highest-cost region). Plant closures announced in Western Europe and North America in 2026. Cash paybacks targeted under two years.
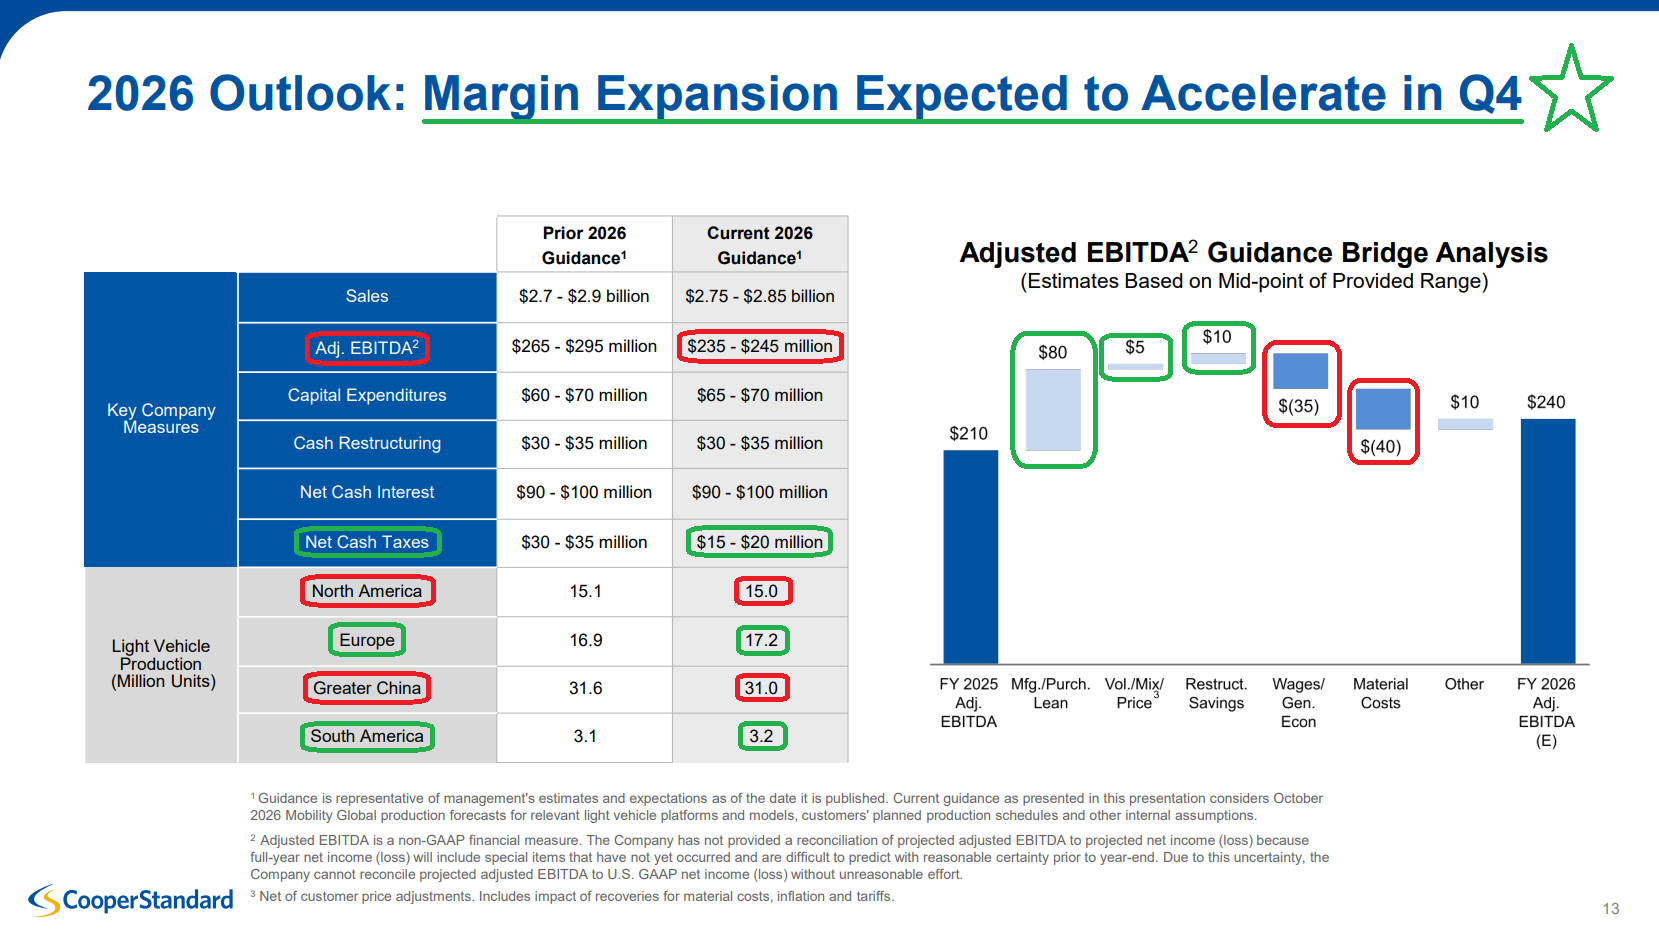
2026 guidance: adjusted EBITDA cut to $235M-$245M (from $265M-$295M), ~$240M midpoint (~8.6% margins, +14.5% vs FY25 on ~2.2% sales growth). ~$80M in lean savings (from ~$90M) + ~$10M in restructuring savings. Implied Q4 adjusted EBITDA ~$82M (~12% margins, +~135% Y/Y vs $34.9M). Guide assumes ~$100 oil and only a portion of Q4 cost recoveries.
Incremental production VCM ~35% per Edwards (Q1’26 VCM “well over 30%”), rising as new programs launch.
2030 targets: ~$554M EBITDA (~14.6% margin), ~120 bps annual expansion, 20%+ compounding EBITDA growth.
Lean base enables double-digit EBITDA margins and strong ROIC on savings alone (~12% implied in Q4 2026), even before volume/mix upside.
ROIC target: triple by FY28 (20%+), ~25% in the 3-5 year outlook.
Hybrids + EVs: Core Growth Engine
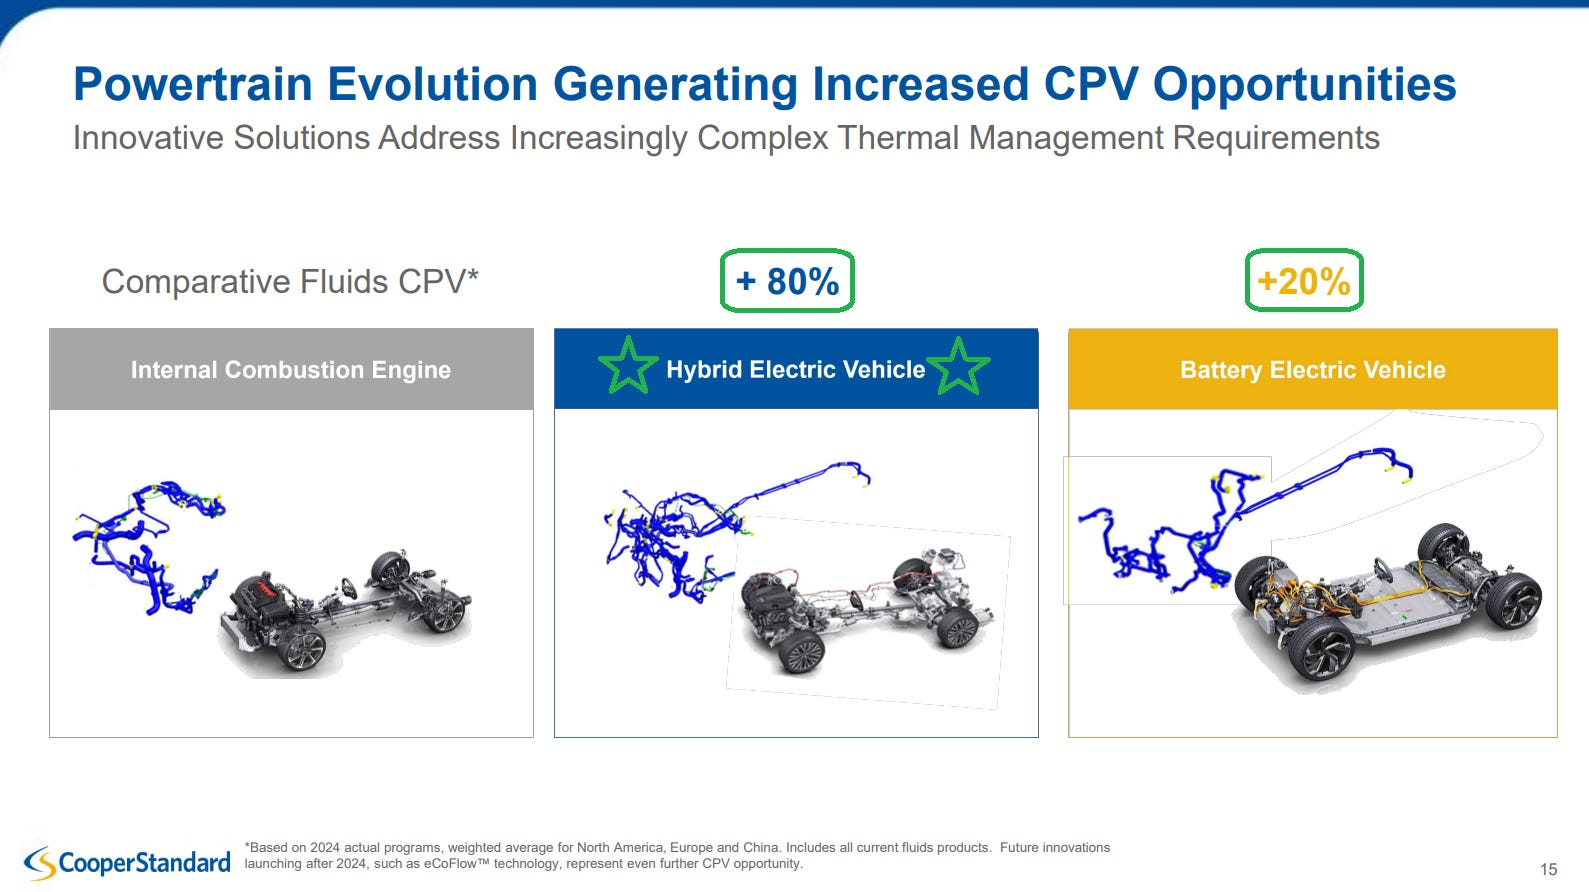
Content per vehicle steps up meaningfully on electrified platforms: hybrids carry 80%+ higher Fluid Handling CPV and EVs carry 20%+ higher CPV vs. ICE.
Industry forecasts: hybrids from ~15% to 24% of global production, EVs from ~16% to 29% over the next five years. Hybrids/EVs expected to reach ~50% of production by 2035, weighted mostly toward hybrids per CPS.
2030 plan holds powertrain mix at 2025 levels, when hybrids (HEV + PHEV) were 14.3% of U.S. sales. Forecast: 17% in 2026, 32% by 2035. Hybrid models available expected to roughly triple, from 37 in 2025 to 100 in 2030 and 115 in 2033.
Shift already underway: Toyota RAV4 (#1 U.S. SUV) going hybrid-only in 2026, Jeep Cherokee returning as hybrid-only in 2026 (Stellantis is ~10% of total revenue). 74% of CPS’s 2025 new awards were tied to battery electric or full-hybrid platforms.
Hybrids are the fastest-growing powertrain in the U.S.: 15.7% of sales YTD, up 3.1 points of share Y/Y. Q3 hybrid retail sales 575,246 (+28.0% Y/Y), a record 17.7% of retail sales.
Hybrids sell in a median 20 days vs 52 days for gas vehicles (Q3 2026); demand outrunning supply.
Hybrids forecast to grow from 14% of the U.S. market last year to ~34% by the end of the decade, absent regulatory change
Detroit Three (~56% of revenue) furthest behind on hybrids: Ford 3 hybrid nameplates (Maverick, F-150, Escape), GM 1 (Corvette), Stellantis 1 (Jeep Cherokee Hybrid).
Ford, the largest customer at ~27% of revenue, plans to extend hybrids across its entire lineup over the next several years. ~50% of global volume hybrids, EREVs and EVs by 2030 vs 17% in 2025.
GM (~19% of revenue) plans to introduce hybrid models into its U.S. lineup; GM largely absent from the hybrid market this decade, currently offering only one hybrid (Chevrolet Corvette)
GM: “We’re not tone deaf to our customers. We know what they want and we want to give that to them as quickly as we can.”
GM plans hybrid versions of its three-row SUVs (Chevrolet Traverse, Buick Enclave, GMC Acadia), among its strongest U.S. sellers, with production expected to start in ~3 years. ~243K annual units at 2025 sales levels; Traverse is CPS’s #6 platform.
Stellantis: 24 conventional hybrid launches globally through 2030; CEO calls hybrids a top priority for the U.S. market. Cherokee Hybrid (CPS #10 platform) giving Jeep a boost.
Nissan added a hybrid version of the Rogue, its best-selling U.S. vehicle since 2016. Plans to make hybrids its ‘primary powertrain’ in North America by 2030 (Nissan is ~4% of total revenues)
Toyota: ~51% of Toyota/Lexus U.S. sales conventional hybrids in Q3, electrified sales +29%.
Honda: ~30% of U.S. sales hybrid, Q3 hybrid sales +21%. New $3B Ohio hybrid plant (240K units/year from 2029), 250% increase in Ohio hybrid powertrain capacity, 15 next-generation hybrid models globally through March 2030, primarily in North America.
Hyundai: ~28% of U.S. sales hybrid, record Q3 hybrid sales (+35% Y/Y). 10+ hybrid models in North America by 2030 at almost half of regional sales; 500K units of new North American capacity.
Kia: Q3 U.S. hybrid sales +118% Y/Y, targeting >25% hybrid share in 2026, 8 hybrid models in the U.S. by 2030.
EVs ~6.4% of U.S. new-vehicle sales in Q3, up from 5.8% in Q2 and the strongest share since Q3 2025; Including hybrids and plug-ins, nearly 25% of Q3 vehicle sales were electrified
New thermal management product (EcoFlow) carries an even higher CPV: ICE ~$80-$120, hybrid ~$140-$200, EV ~$120-$170 (up to 150% vs. baseline).
Sedans make up 80% of Gen Z’s (ages 18-29) favorite cars and 60% of millennials’ (ages 30-45), per Compare.com; positive for volumes, with hybrids dominating the sedan category
Top-Line Growth & New Business Wins
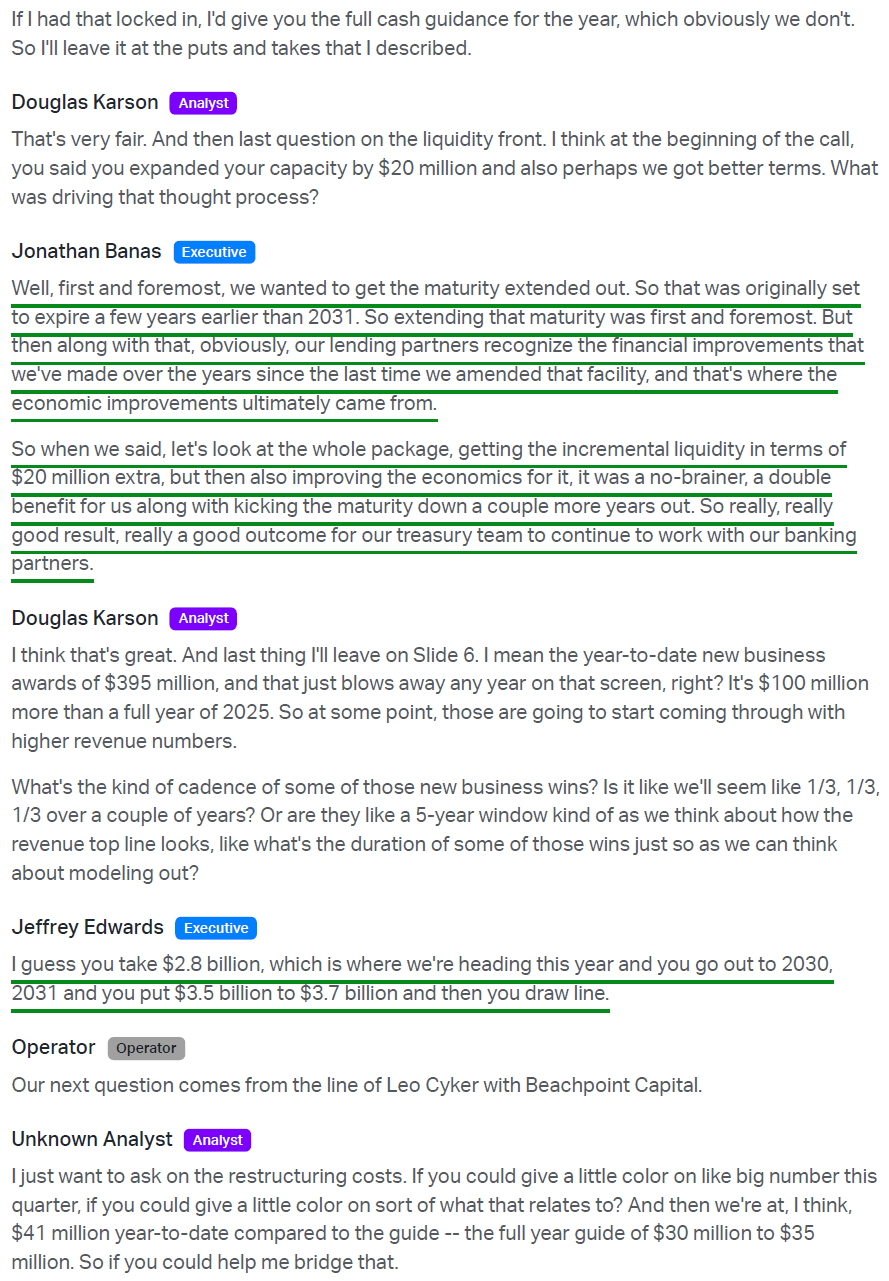
2030 targets: >$3.8B revenue (~7% CAGR), with >80% of incremental revenue already booked. 85-95% of business launching in 2027-2028 already booked, providing strong visibility into the forward margin trajectory. Fluid Handling to $2.0B+ (16%+ margins), Sealing to $1.8B+ (13%+ margins). Targets reaffirmed on the Q3 call.
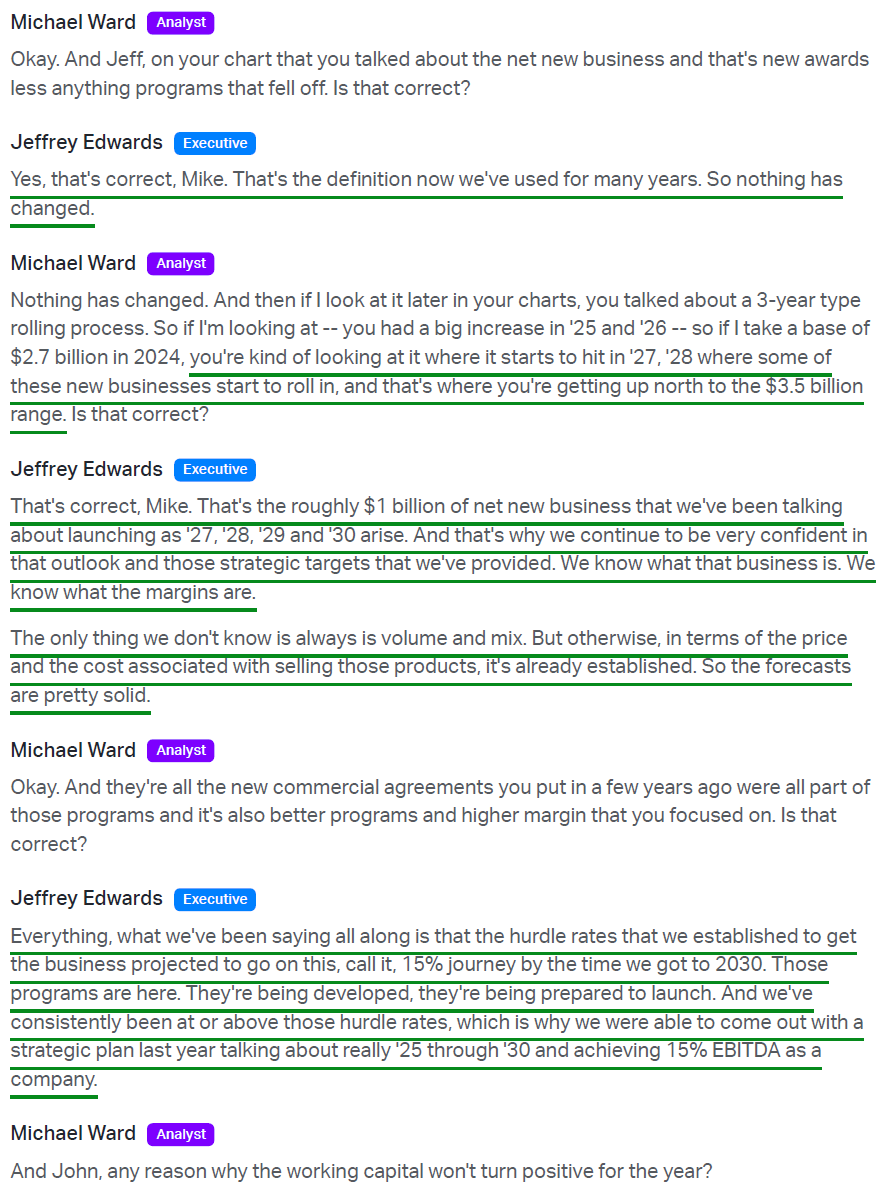
~$1B of net new business launching as 2027-2030 arrive. Pricing and costs already set, volume/mix the only variable. Available capacity means minimal incremental capex.
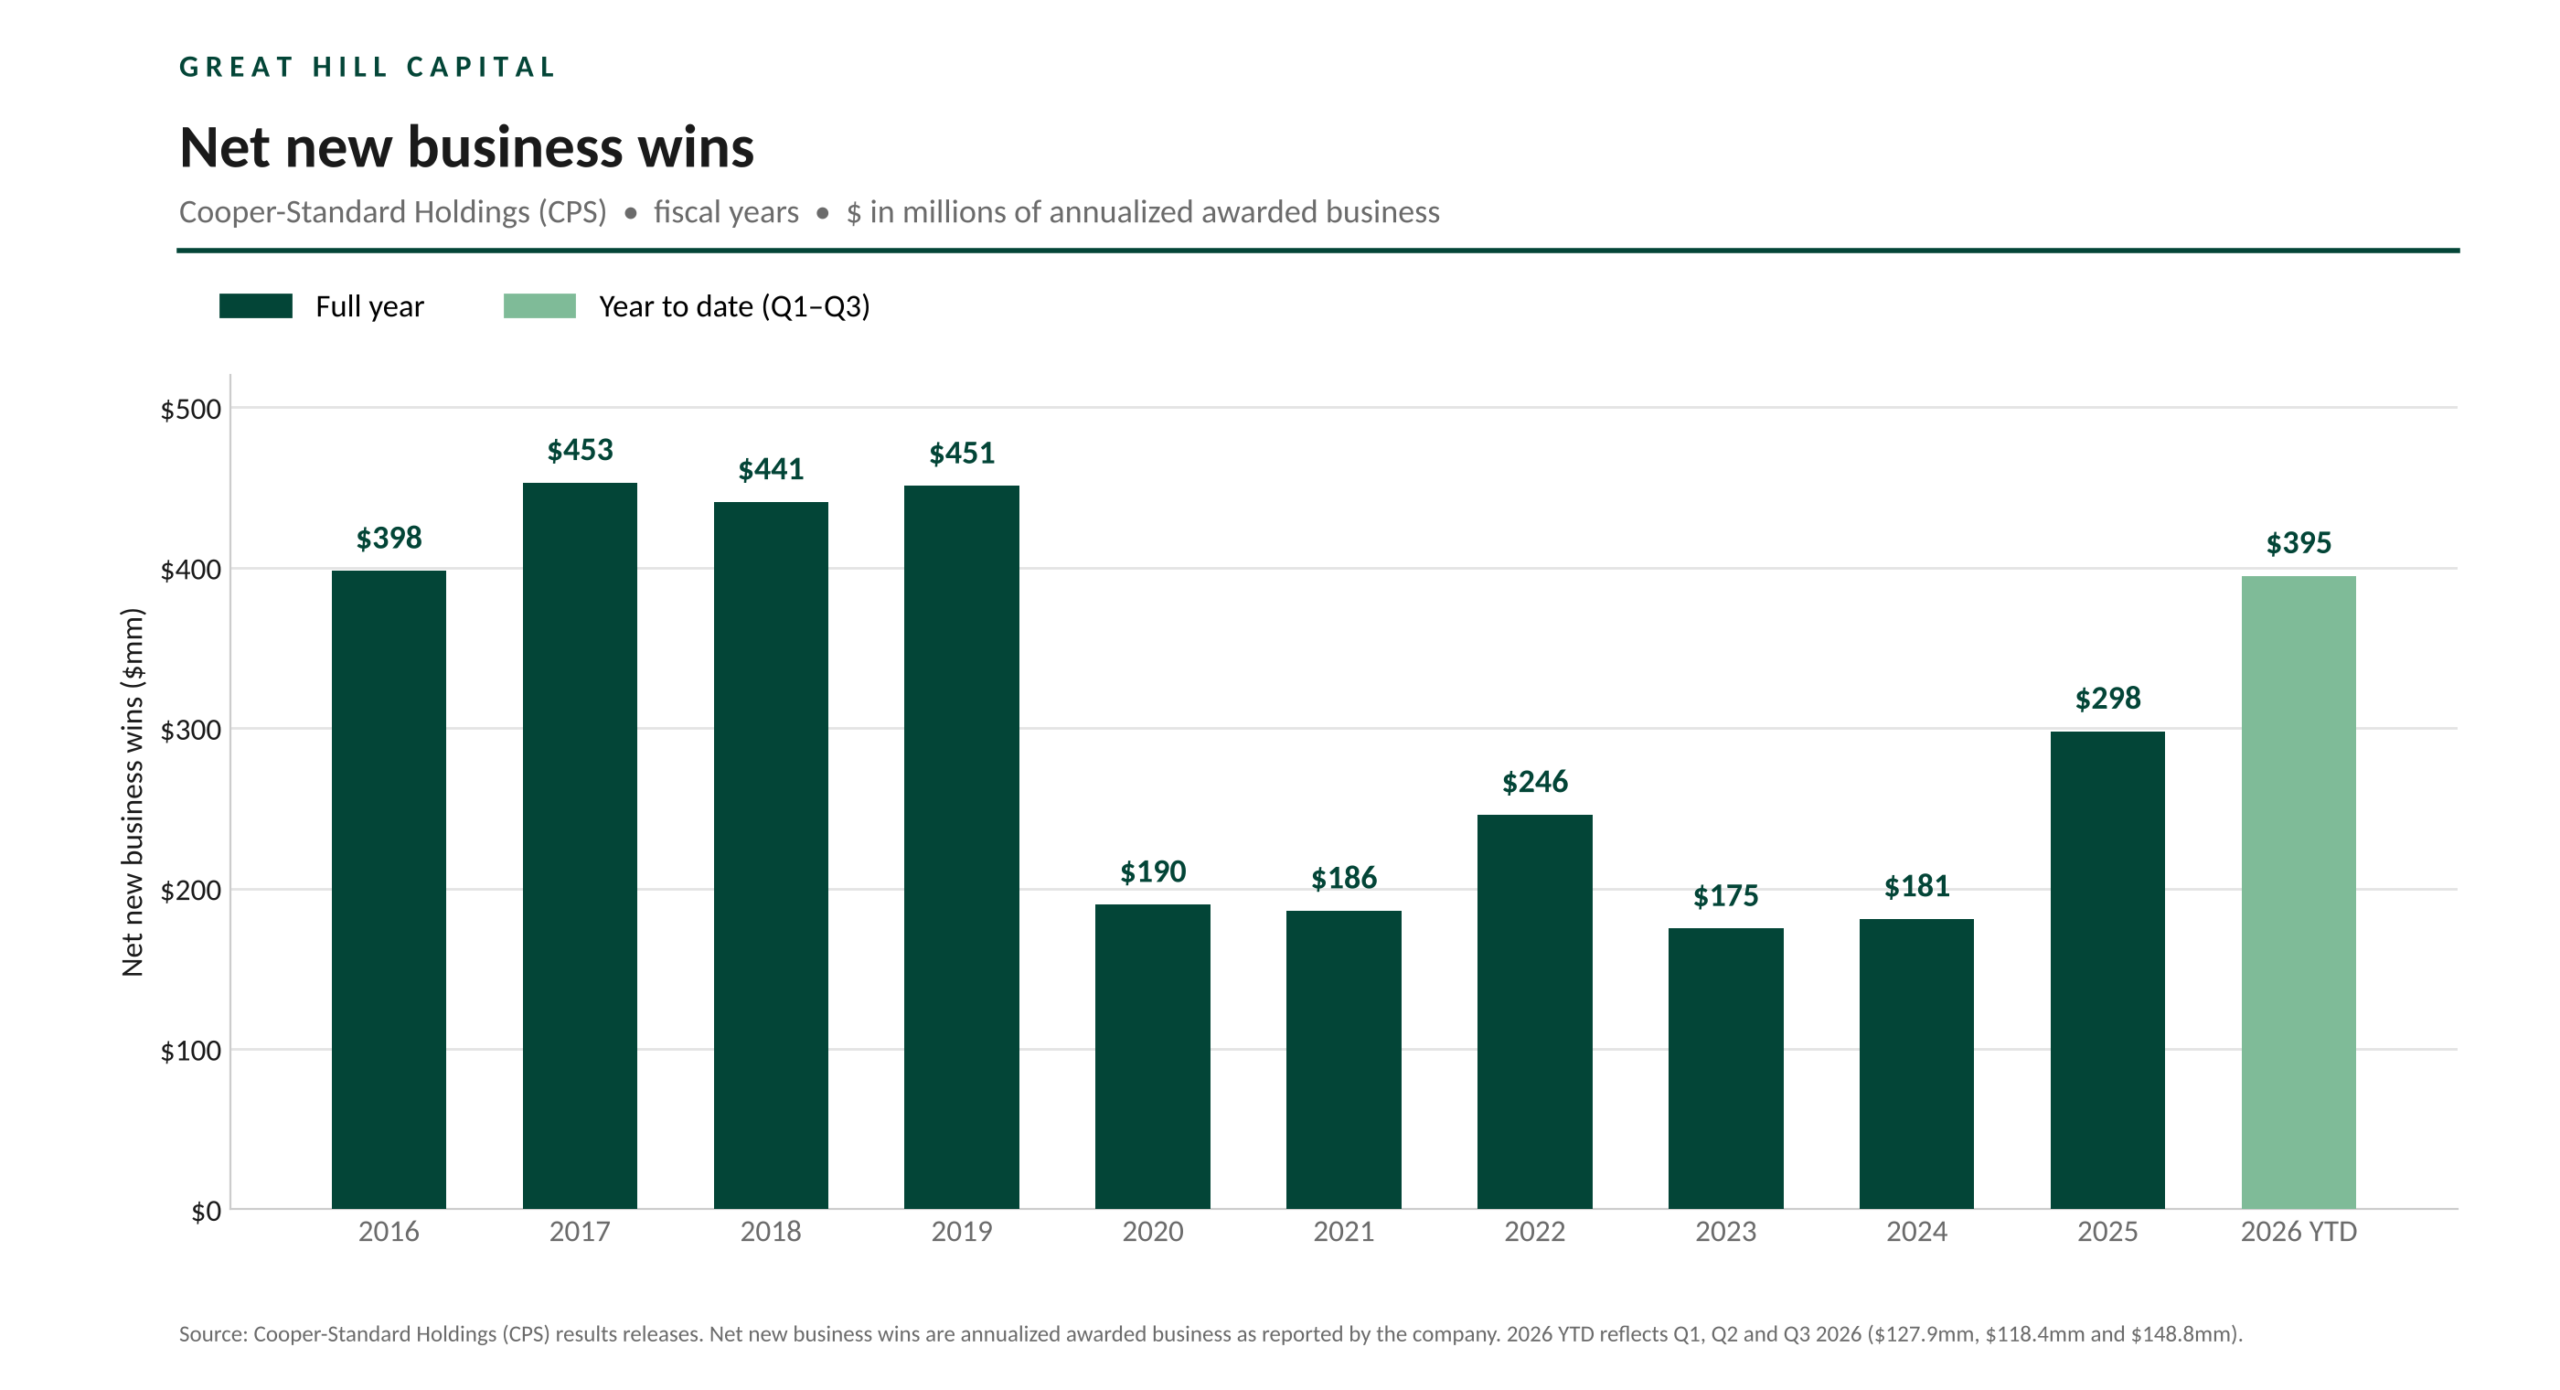
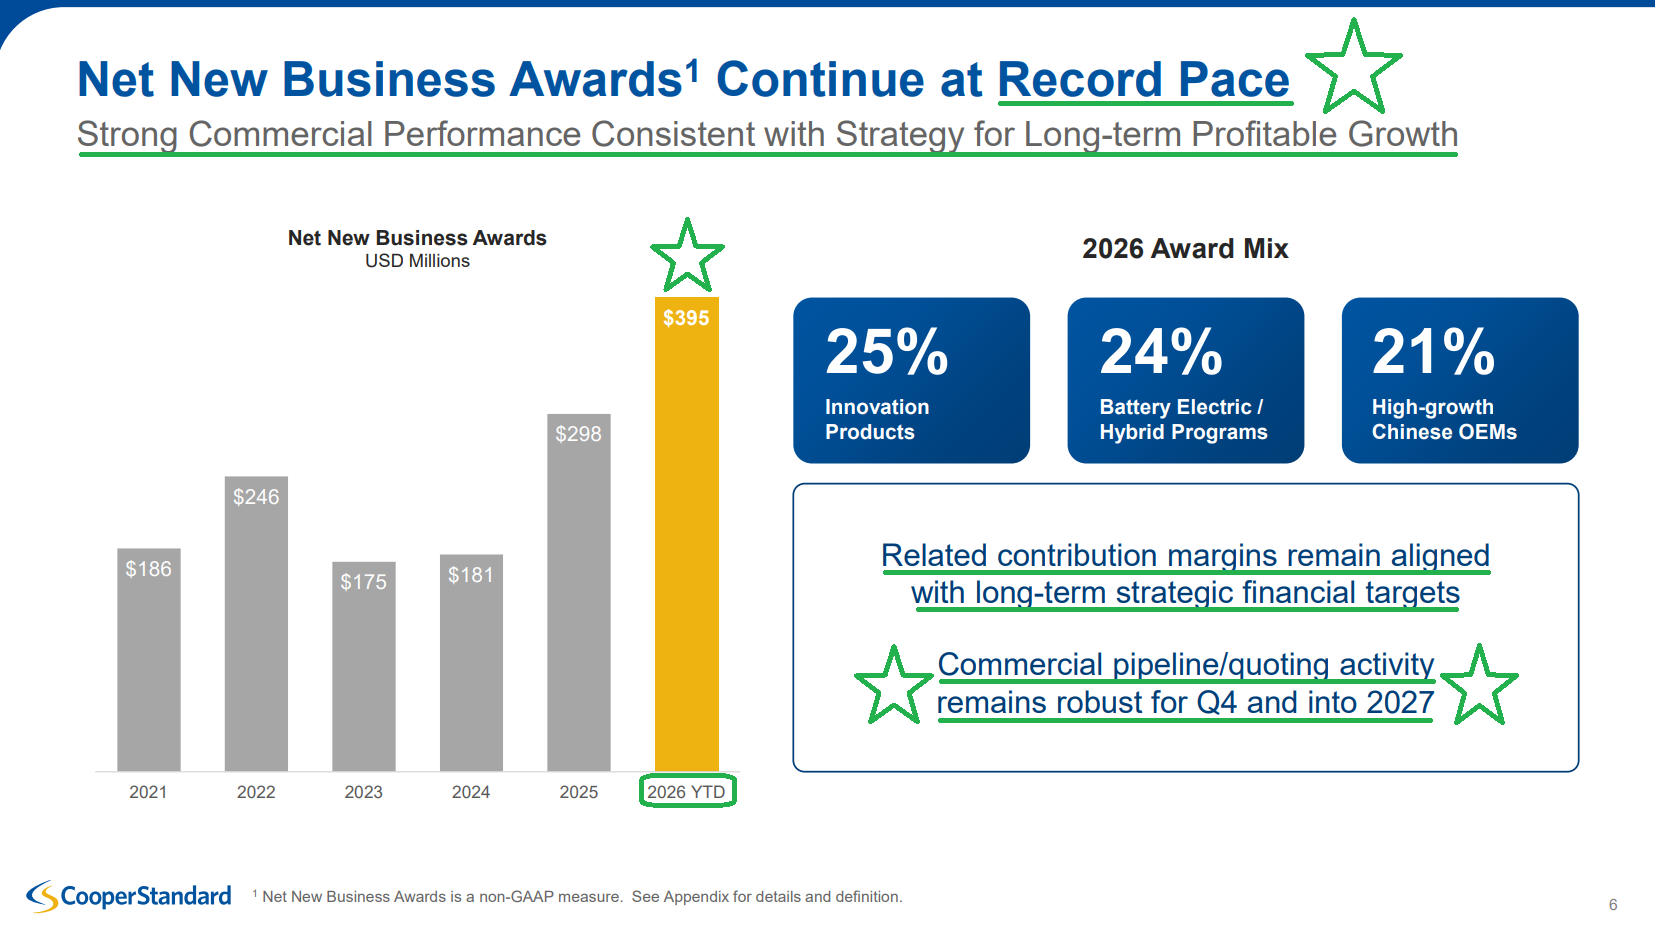
Net new business awards (the #1 future growth signal): $148.8M in Q3 (+54.4% Y/Y), bringing YTD to $395.1M (+72.9% Y/Y), already ~33% above FY25’s $298M and more than double 2024’s $181M in just nine months.
2026 on track for a record year: ~$58M shy of 2017’s $453M high, with pipeline/quoting activity robust into Q4 and 2027.
$28.2M of Q3 awards ($96.6M YTD, ~24%) tied to battery electric or full-hybrid platforms. YTD mix: ~25% innovation products, ~24% BEV/hybrid, ~21% high-growth Chinese OEMs. Contribution margins consistent with long-term targets.
2026 goal of >$400M in awards (+34% Y/Y vs. FY25’s $297.9M) essentially met with a quarter to go. Chinese OEMs ramp faster than the typical 2-3 year Western OEM cycle.
Plant launches up 100%+ Y/Y in Q3, including conquest business won mid-program from struggling competitors.
Plan to triple global sales to Chinese OEMs over five years (high margins, low capex). China revenue CAGR >15%. Chinese OEMs expected to go from ~36% of China revenue to >60% by 2030.
Fluids business is expected to double over five years (organic and potentially inorganic growth).
FY2026 guidance: sales narrowed to $2.75B-$2.85B (from $2.7B-$2.9B), $2.8B midpoint unchanged (~2.2% growth). Production assumptions: NA 15.0M (from 15.1M), Europe 17.2M (from 16.9M), Greater China 31.0M (from 31.6M), South America 3.2M (from 3.1M).
GM Q3: New full-size truck volumes expected ~flat from 2026 to 2027 during the launch, with upside opportunity in 2028, while GM also unlocks capacity in full-size SUVs and high-volume crossovers
Secular Drivers
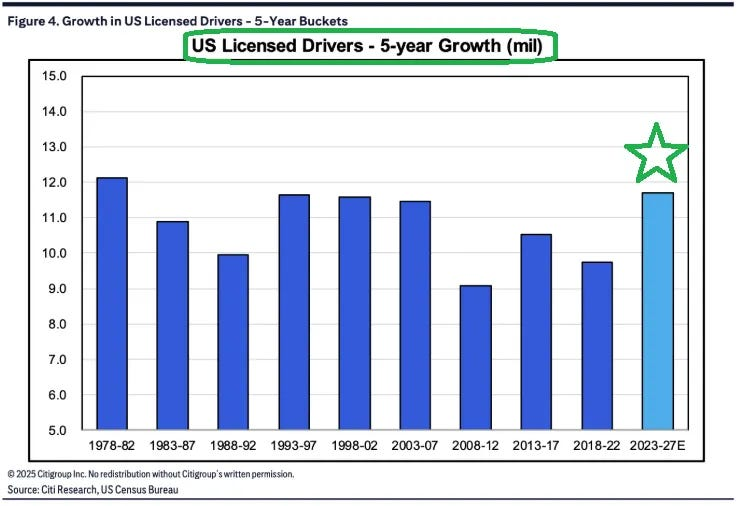
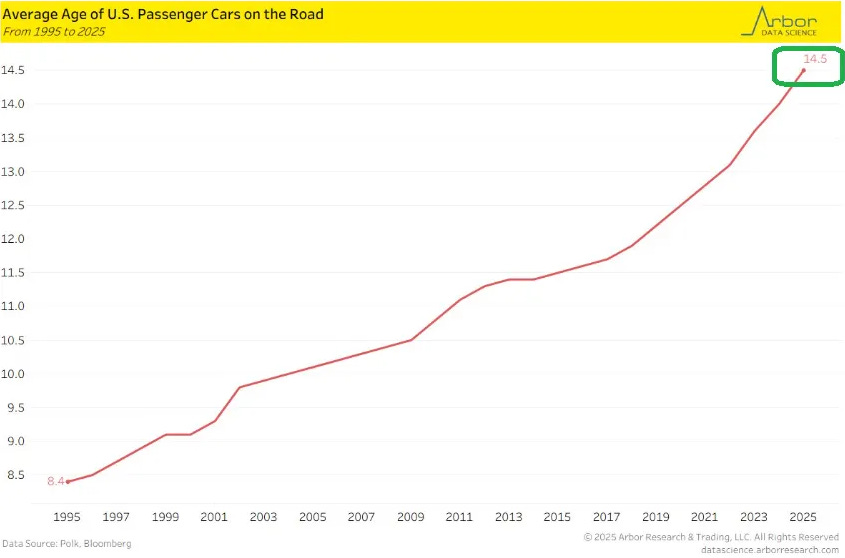
Highest U.S. licensed driver growth in 40+ years. Record vehicle age (14.5 years) driving replacement demand.
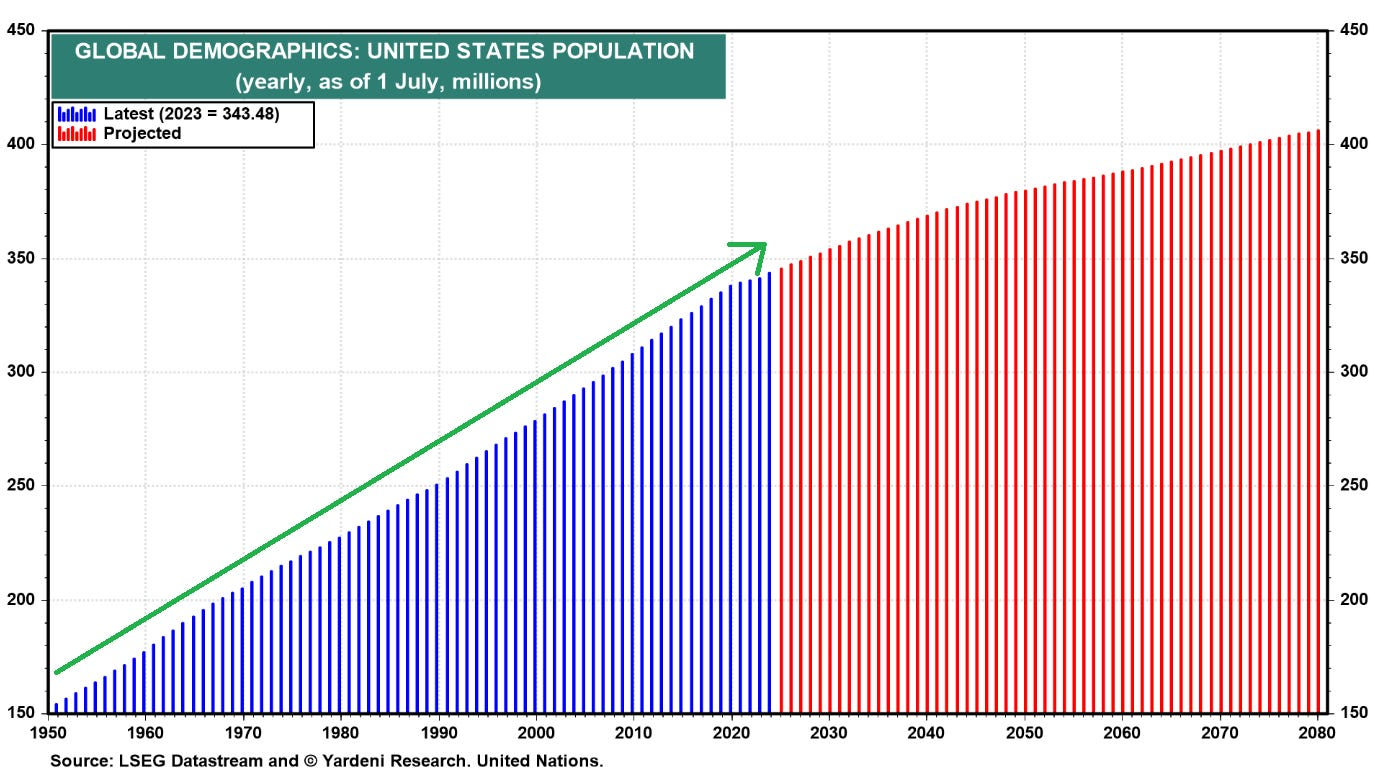
U.S. population >30% higher than prior cycles, with 70M+ millennials now in prime vehicle ownership years.
Depleted domestic inventories vs. historical averages. Pent-up demand: U.S. production ~15M units vs. 17M+ pre-COVID historical; 5-7M deferred units after sub-trend years.
Incentives (a strong leading indicator) have room to move higher: ~6.5% currently vs. 9.8% long-term average. Past 40-year cycles peaked at 17M-18M+ SAAR despite a 30-40% smaller population.
2030 conservative assumptions use a “mortician’s forecast” (~15.3M NA units, no hybrid/EV mix benefit).
S&P Global Mobility NA production forecast: 15.17M (2027), 15.42M (2028), 15.72M (2029), 16.10M (2030), above the plan’s ~15.3M ceiling by 2030.
Rule of thumb: ~$100 of CPS NA sales per NA vehicle produced (2025), so each +1M units = ~$100M of sales and ~$30M-$35M of adjusted EBITDA at 30%-35% incremental VCM. Conservative: 2025 content, no hybrid/innovation mix lift.
U.S. SAAR 16.05M YTD through October (-1.8% Y/Y, NADA).
GM Q3: raised its U.S. SAAR outlook to the mid-16M range (from low-16M)
Debt Refinancing & Balance Sheet
Successfully completed global refinancing on March 4, 2026: replaced $612M 13.5% First Lien due 2027 and $388M 10.625% Third Lien due 2027 with $1.1B 9.25% Senior Secured First Lien Notes due 2031.
Benefits: No material debt maturities until 2031. FY26 net cash interest guide cut to $90M-$100M (from $105M-$115M).
ABL amended in Q3: upsized to $200M (from $180M), maturity extended to September 2031 (from May 2029), lower spreads and fees. $193.1M availability remains untapped.
Net leverage 5.4x at Q3 (net debt ~$1.03B, TTM adjusted EBITDA $192.7M), gross leverage 5.9x. Target: net leverage <2x by 2028.
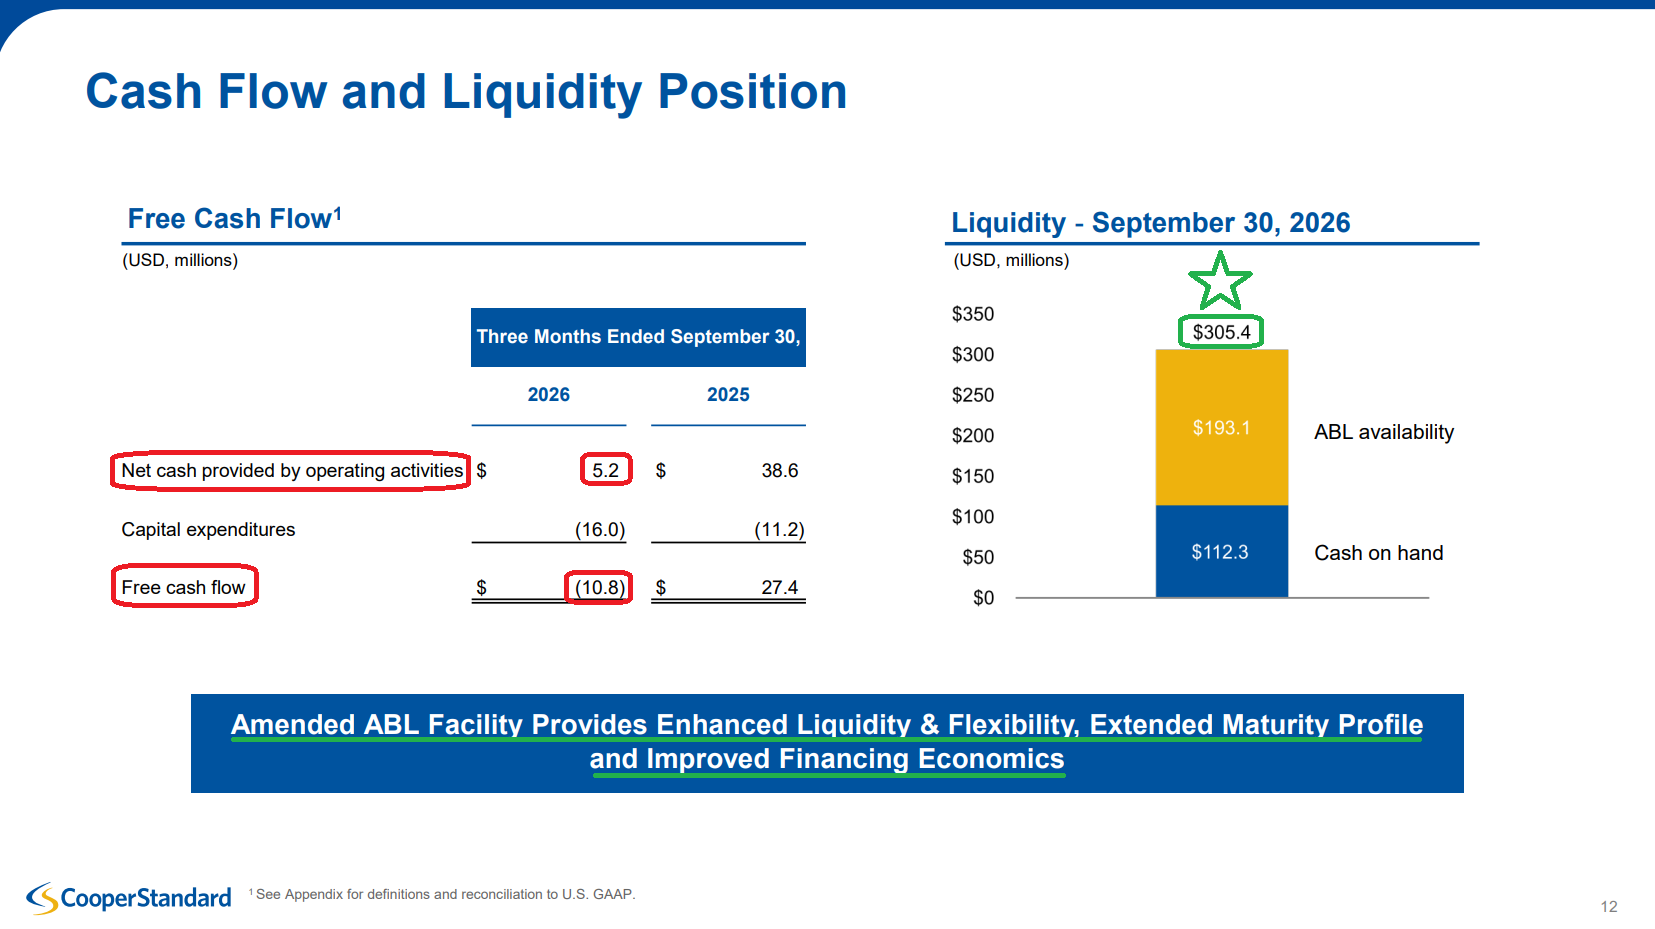
Liquidity: $112.3M cash + $193.1M undrawn ABL (~$305.4M total).
Management
Chairman/CEO Jeffrey Edwards: 39+ years of experience, in the role since 2013. Respects equity — share count has been reduced over the years.
Edwards has material skin in the game, owning ~2% of shares outstanding.
Compensation tied to ROIC. True partners.
Key Financials & Valuation
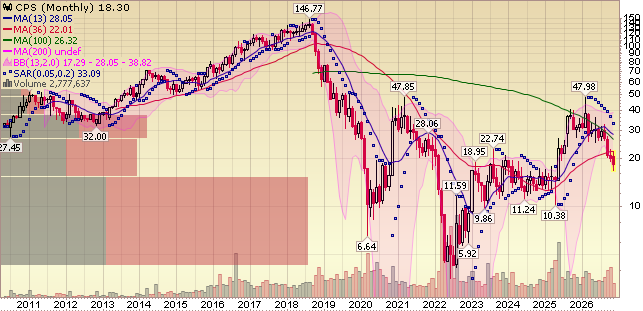
Shares at $18.58, market cap ~$391.6M.
Positive FCF three straight years (2026 would be the fourth). 2025: $16.3M (despite Novelis disruptions). Capex raised to $65M-$70M (~2.4% of sales). Net cash taxes cut to $15M-$20M (from $30M-$35M).
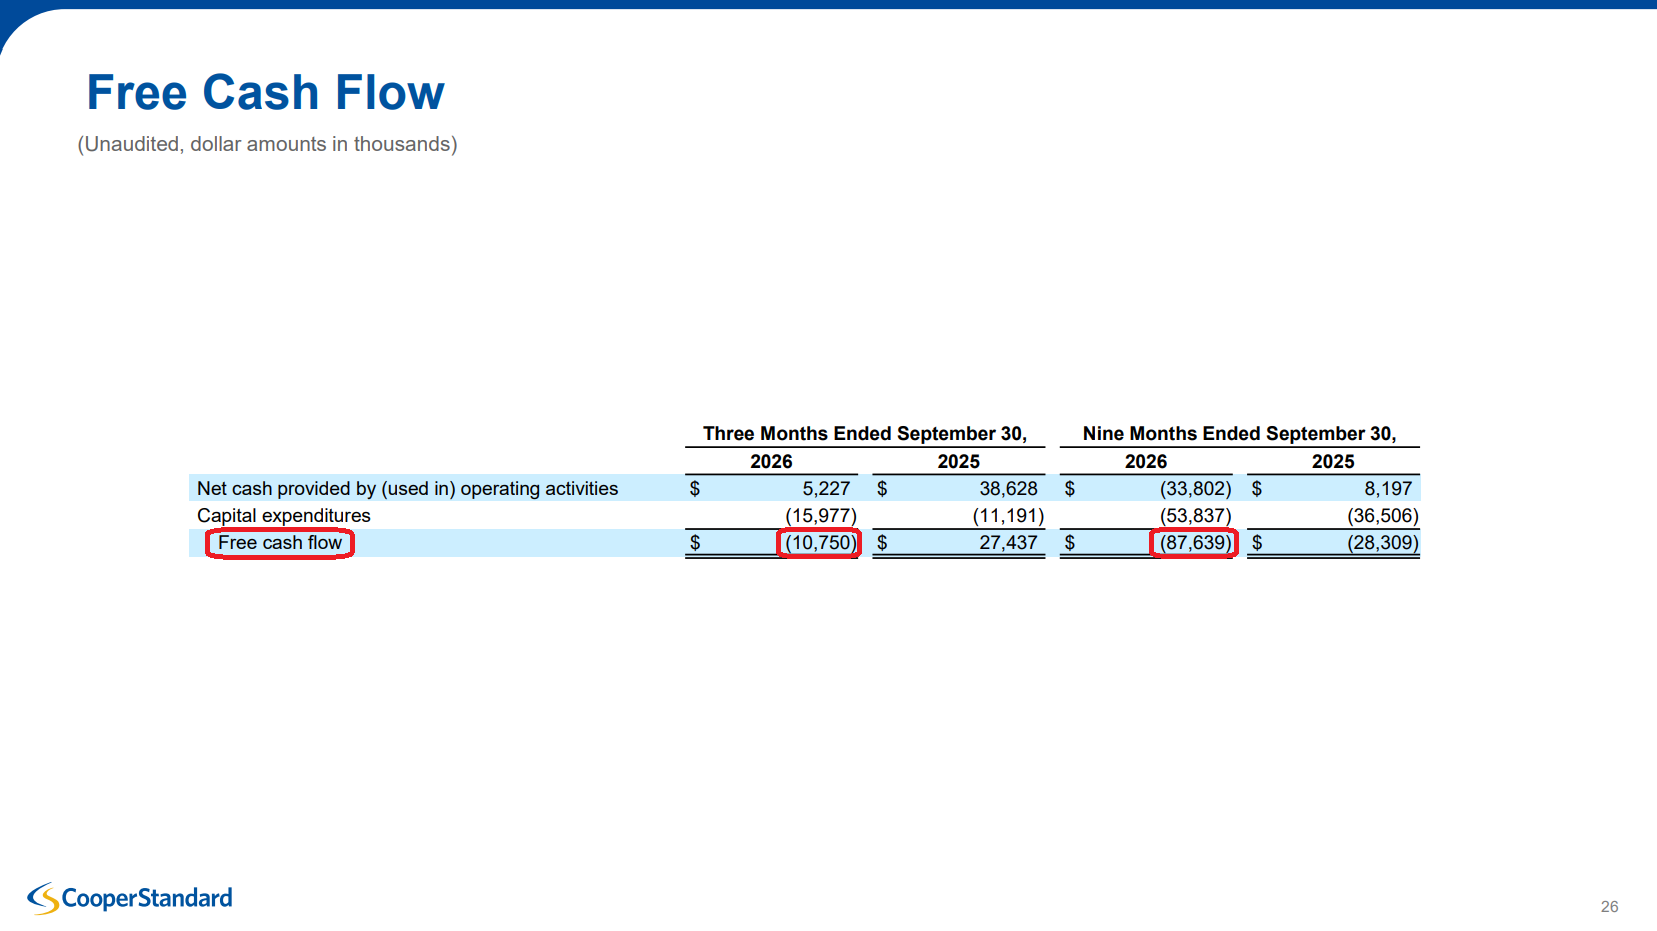
Q3 FCF -$10.8M vs +$27.4M prior year (~$38.2M swing) on lower cash earnings, working capital tied up by elevated material costs, higher cash taxes and restructuring cash. YTD FCF -$87.6M vs -$28.3M.
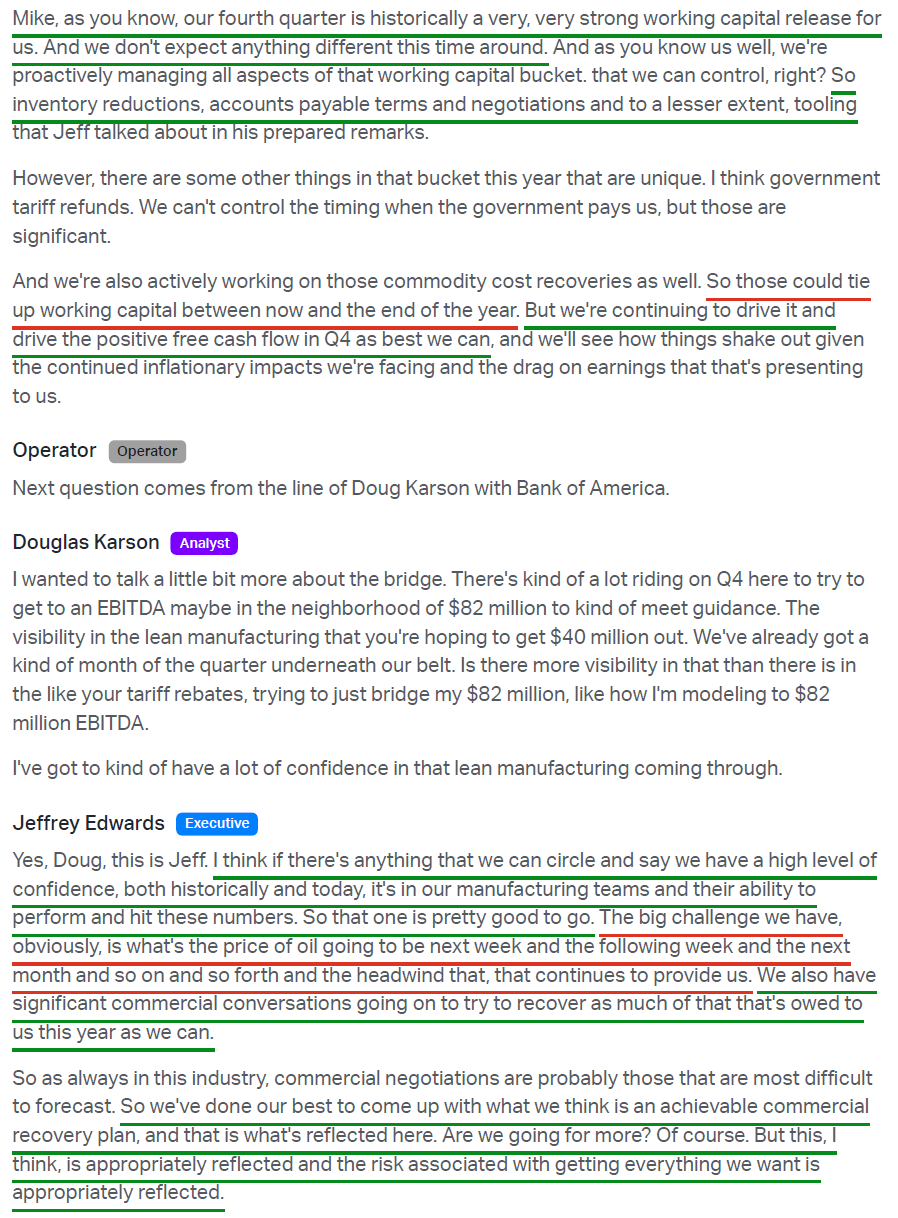
Positive Q4 FCF expected on the seasonal working capital release (receivables unwind, inventory reductions). Full-year positive would require ~$88M in Q4.
Q3 capex $16.0M (2.3% of sales). YTD capex $53.8M (2.5% of sales).
With leaner operations and conservative assumptions, path to $10+ EPS long-term (vs. 2017 peak: $3.6B revenue, 12.5% EBITDA margin, $7.21 EPS at $146/share).
Q3 Commentary
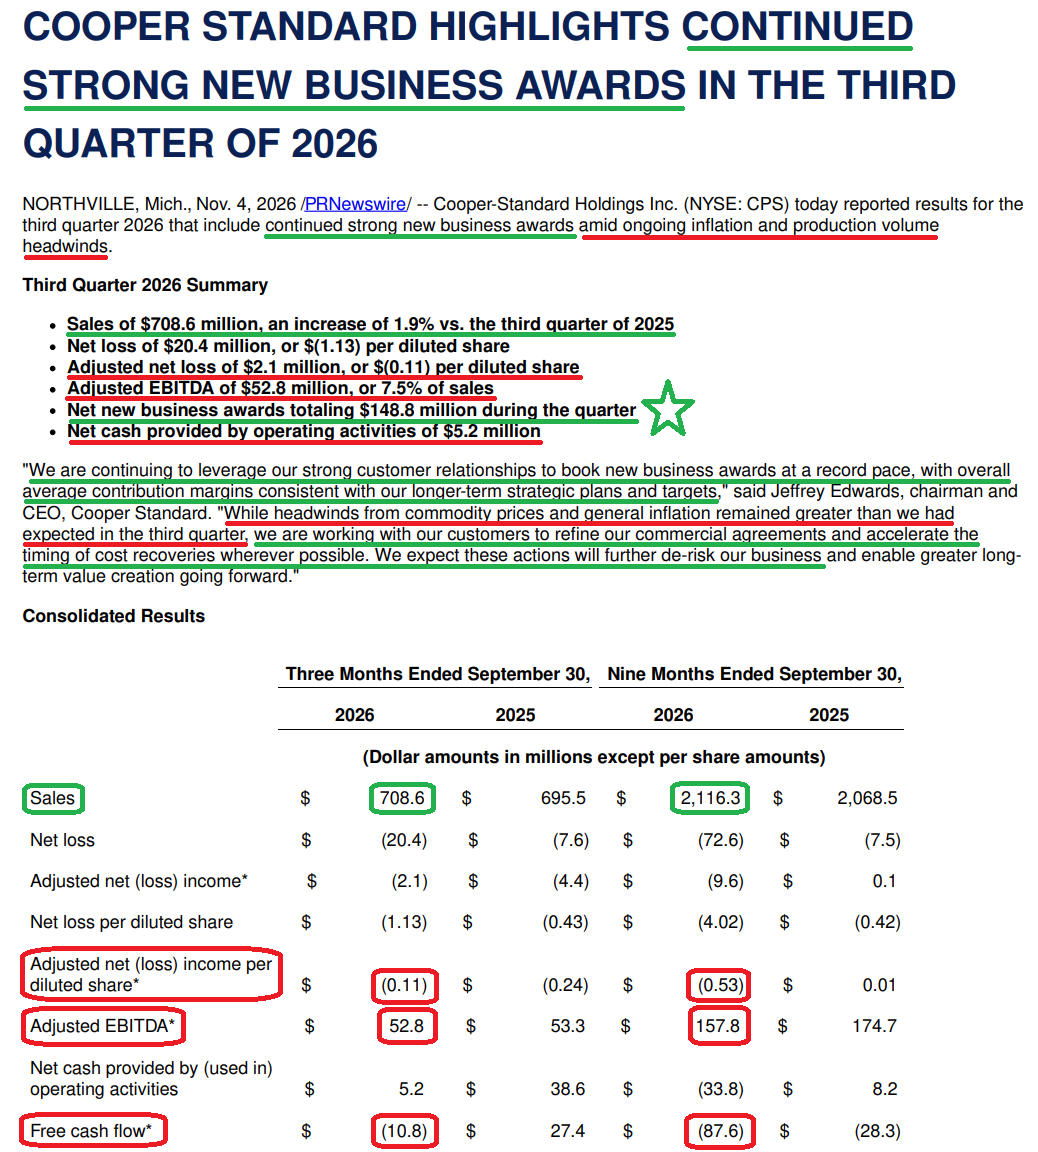
Cooper Standard’s third quarter was not the one we, or management, had penciled in. While revenue of $708.6M (+1.9% Y/Y) grew despite a 2.3% decline in global light vehicle production, profitability remained under pressure, with adjusted EBITDA of $52.8M (7.5% margin) coming in short of the $71.1M consensus. The culprit was the same one that weighed on the second quarter: oil-linked input costs across rubber and plastic feedstocks, alongside elevated aluminum prices and stubborn general inflation, with customer recoveries taking longer than expected. The results led management to lower full-year adjusted EBITDA guidance to $235M-$245M from $265M-$295M.
Understanding why those recoveries ran late starts with what management laid out on the Q2 call. At the time, management framed the commodity hit as a timing difference, with index-based contracts expected to catch up in the back half and price increases taking effect across all purchase orders on July 1. Given how the agreements are structured, that expectation was entirely reasonable. Today, >70% of CPS’s commodity exposure is covered by contracts tied to published commodity indices, with the remainder negotiated with customers on a rolling basis. When input costs spike, CPS absorbs the higher costs upfront before recovering them through price adjustments as the indices reset over the following period. That structure works exactly as designed when a spike is short-lived.
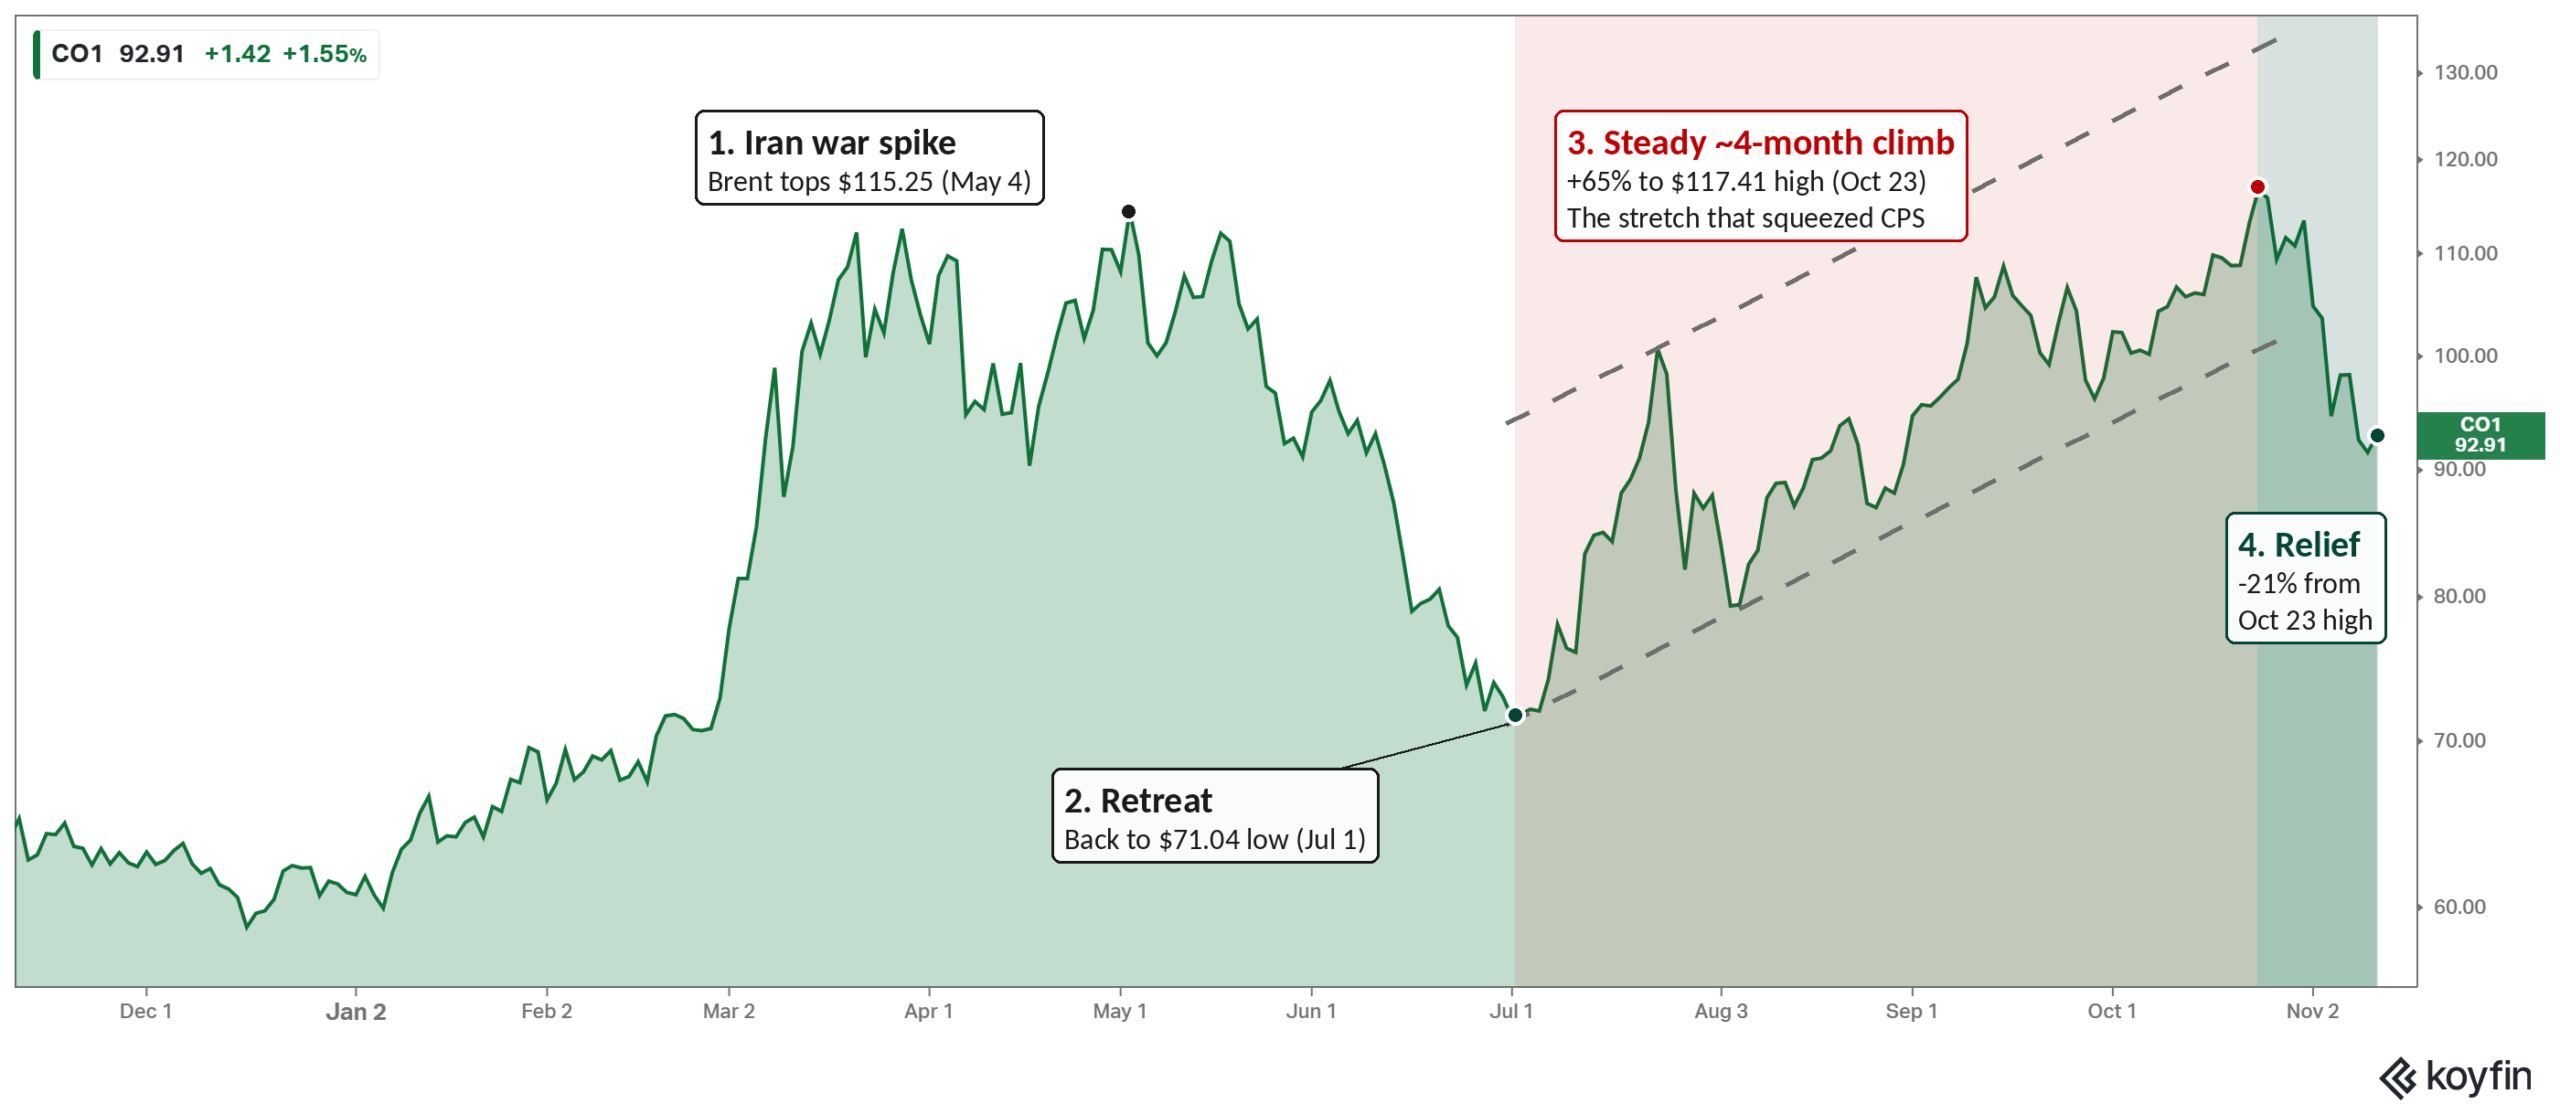
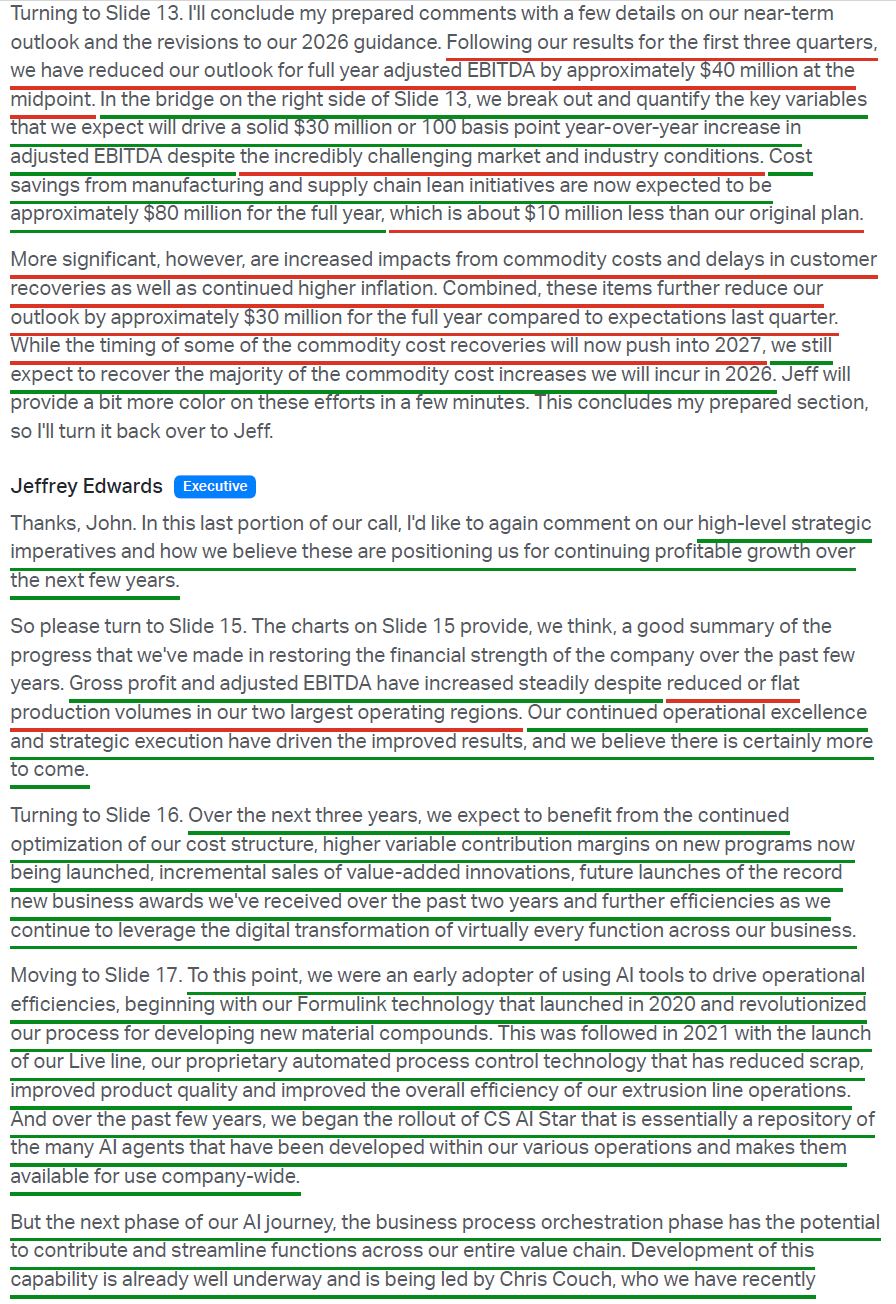
The problem is that oil never gave the contracts a chance to catch up. After retreating from its initial spike at the outset of the Iran war, oil climbed steadily for nearly four months, from early July through late October, remaining $30-$40 per barrel above the ~$65 assumption in the plan. Each reset was chasing a price that had already moved higher, stretching the recovery lag from a quarter into the better part of a year. While customers are fully honoring the agreements and management remains highly confident it will recover the majority of this year’s commodity costs, some recoveries will now extend into 2027. Importantly, it remains a question of WHEN, not IF.
The quarter marked the first significant test of the index-based agreements, providing a valuable learning experience and an opportunity to make them stronger. CPS is now negotiating shorter reset periods with its customers while refining the indices used to calculate recoveries. CPS holds more leverage in those conversations than might initially appear. Over the past two years, automakers have awarded CPS a growing stream of new business, much of which is now launching on new platforms. A financially strained supplier in the middle of those launches is the last thing any customer wants. As Edwards put it, management is “making every effort to turn this current crisis into future opportunity,” with the end result being a more de-risked business heading into 2027.
The commodity squeeze is hardly the first curveball Cooper Standard has faced, with management steering the company through a near-uninterrupted gauntlet of industry-wide disruptions over the past six years. COVID shut down production in 2020, followed by the semiconductor shortage and supply chain chaos that hobbled the industry through 2021 and 2022, along with the inflation spike that followed. The 2023 UAW strike halted production at Ford, GM and Stellantis, customers representing nearly 60% of CPS’s sales. Tariffs and a trade war followed in 2025, along with a handful of fires at the Novelis aluminum plant that idled production of the Ford F-150, CPS’s single most valuable platform. A broader slowdown in EV demand triggered a wave of OEM write-downs, with EV programs CPS had won and prepared to launch subsequently scaled back or scrapped before ever reaching production. All of that came before the Iran war sent oil sharply higher this year.
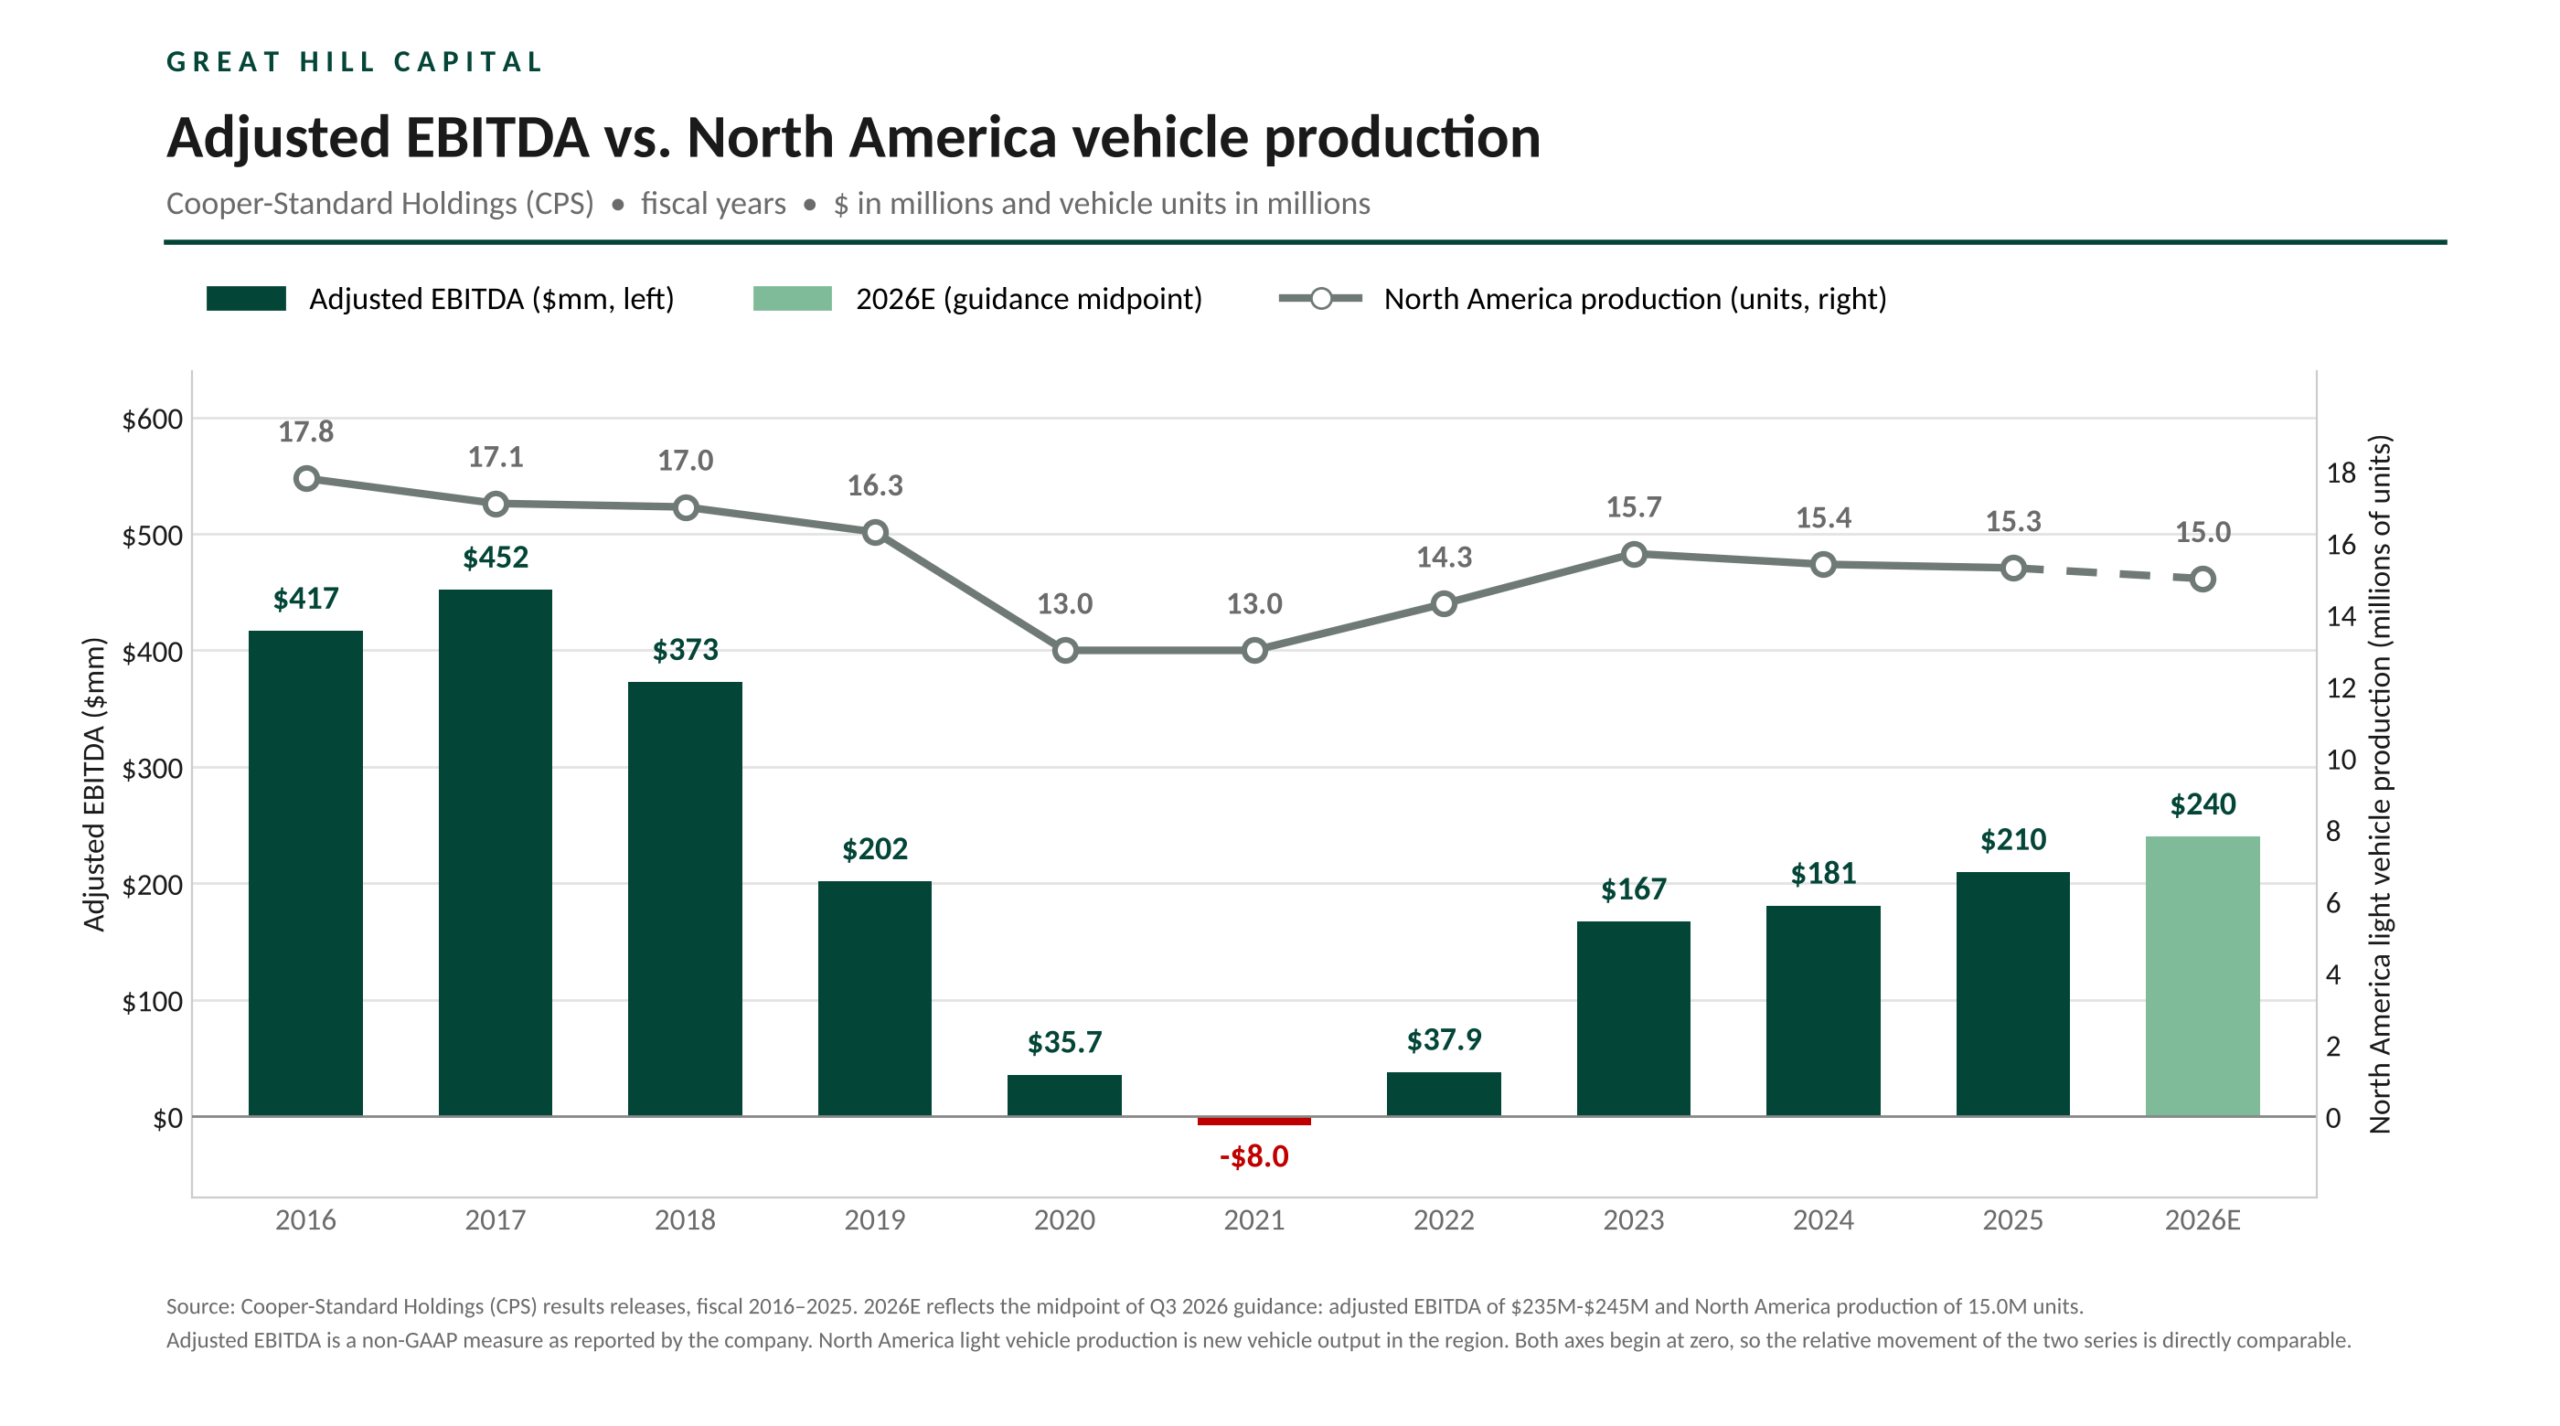
Combined, these headwinds have driven North American production, CPS’s largest region, lower every year since 2023, from 15.7M units to the 15.0M expected this year, with CPS revenue stuck in a $2.7B-$2.8B range. Against that backdrop, what management has delivered is nothing short of remarkable. Adjusted EBITDA climbed from $167.1M in 2023 to ~$240M expected this year at the guidance midpoint (+~44%), with margins expanding from 5.9% to an estimated ~8.6%. Even this year’s reduced guidance calls for 14.5% EBITDA growth on just ~2.2% sales growth, alongside ~100 bps of margin expansion, putting 2026 on track for the highest adjusted EBITDA since 2018. Hats off to management, whose unwavering focus on what it can control has made CPS a far leaner and more efficient business than the one that entered this stretch of disruptions.
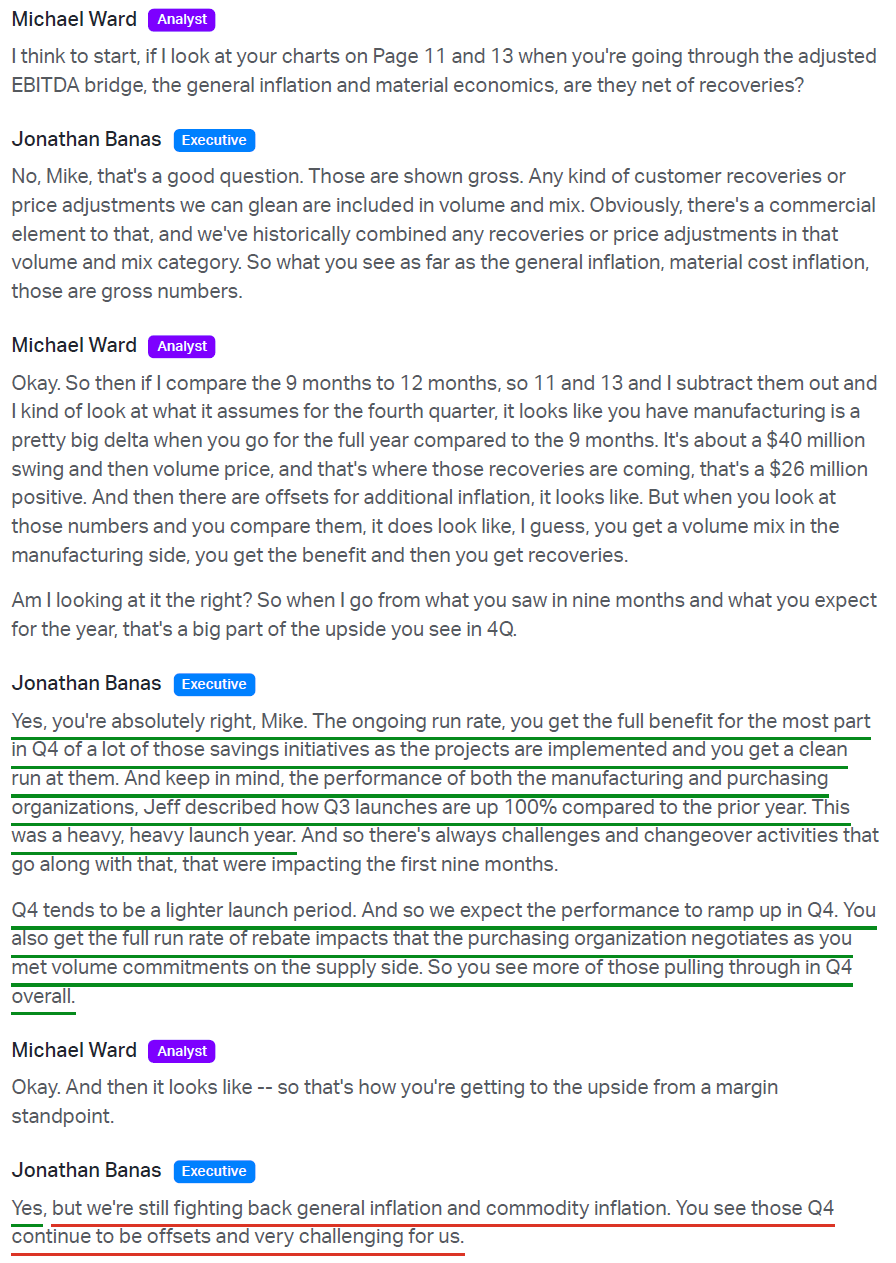
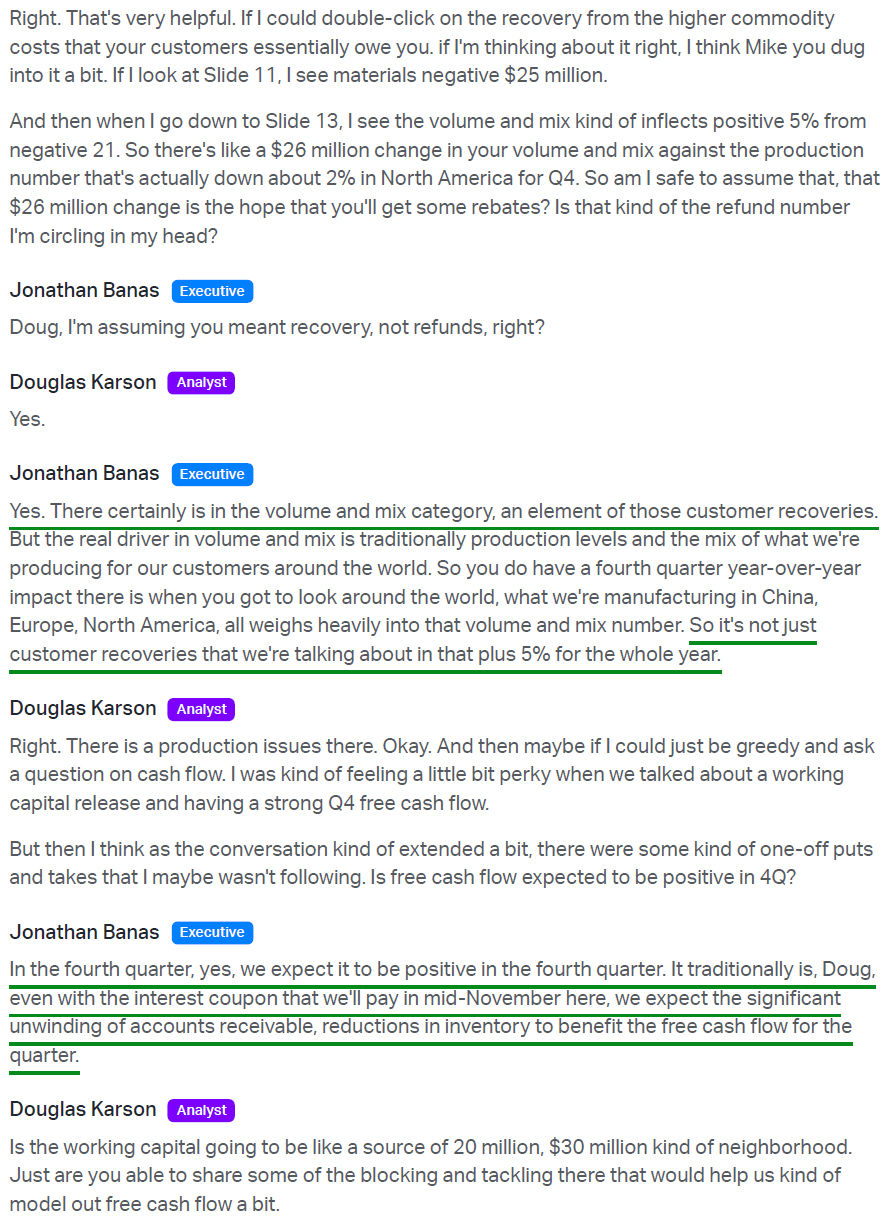
Delivering on the $240M full-year guide requires ~$82M of adjusted EBITDA in the fourth quarter, up ~135% from $34.9M a year ago, at margins of ~12%. This is where the leaner cost structure has to prove itself. In addition to a heavy launch schedule that weighed on Q3 profits but eases in Q4, management expects $40M of productivity savings in the quarter, on top of the $40M delivered YTD. Asked about visibility, Edwards said the manufacturing piece is “pretty good to go,” leaving commercial recoveries as the harder variable to forecast. Management included only a portion of those recoveries in its guidance, describing the estimate as conservative. The recent pullback in oil prices could offer some help on that front as well, with the Q4 guide assuming ~$100 oil and leaving room for upside if lower prices hold.
The good news is that none of this short-term commodity pressure puts CPS’s back against the wall, thanks in large part to the well-timed refi completed in March, which pushed all material maturities out to 2031. Management also amended its ABL during the quarter, upsizing the facility to $200M from $180M while extending its maturity to September 2031 at lower spreads and fees. With more than $300M of liquidity and the ABL untapped, the quarter’s miss is, the way we see it, nothing more than short-term noise.
Putting input cost pressures aside, the metric that actually moves the needle is new business awards, the single most important indicator for long-term investors in CPS. Q3 awards came in at $148.8M (+54.4% Y/Y), bringing the year-to-date total to $395.1M (+72.9% Y/Y). That puts CPS within striking distance of its full-year $400M target with a quarter to spare and already more than doubles the $181.4M booked in all of 2024. With quoting activity and the commercial pipeline remaining robust heading into Q4 and 2027, CPS is within a stone’s throw of 2017’s $453M high and on track for a record year.
The quality of the wins matters as much as the quantity. Every award is quoted against hurdle rates designed to support the company’s long-term ~15% margin target, with management confirming that average contribution margins remain consistent with that goal. Year to date, ~25% of awards have come from innovation products that drive higher CPV, with ~21% tied to fast-growing Chinese OEMs, which bring products to market faster than the typical two-to-three-year ramp at Western automakers. The ramp is already visible on the factory floor, with plant launches up more than 100% Y/Y in Q3, including conquest business won mid-program from competitors. CPS has the available capacity to launch much of this business with minimal incremental capital investment. With these awards in hand, more than 80% of the incremental revenue to 2030 is already booked. As management put it on the call, “We know what that business is. We know what the margins are. The only thing we don’t know, as always, is volume and mix.”
That booked business forms the foundation of the 2030 plan, which management reaffirmed in full on the call despite lowering this year’s guidance. The plan calls for sales of $3.8B, adjusted EBITDA margins approaching 15% and ROIC of ~25%. Fluid Handling is expected to roughly double to $2.0B+ in revenue at 16%+ margins, with Sealing reaching $1.8B+ at 13%+ margins. Getting there does not require a dramatic rebound in the auto market. It simply requires CPS to launch business it has already won at margins it has already quoted.
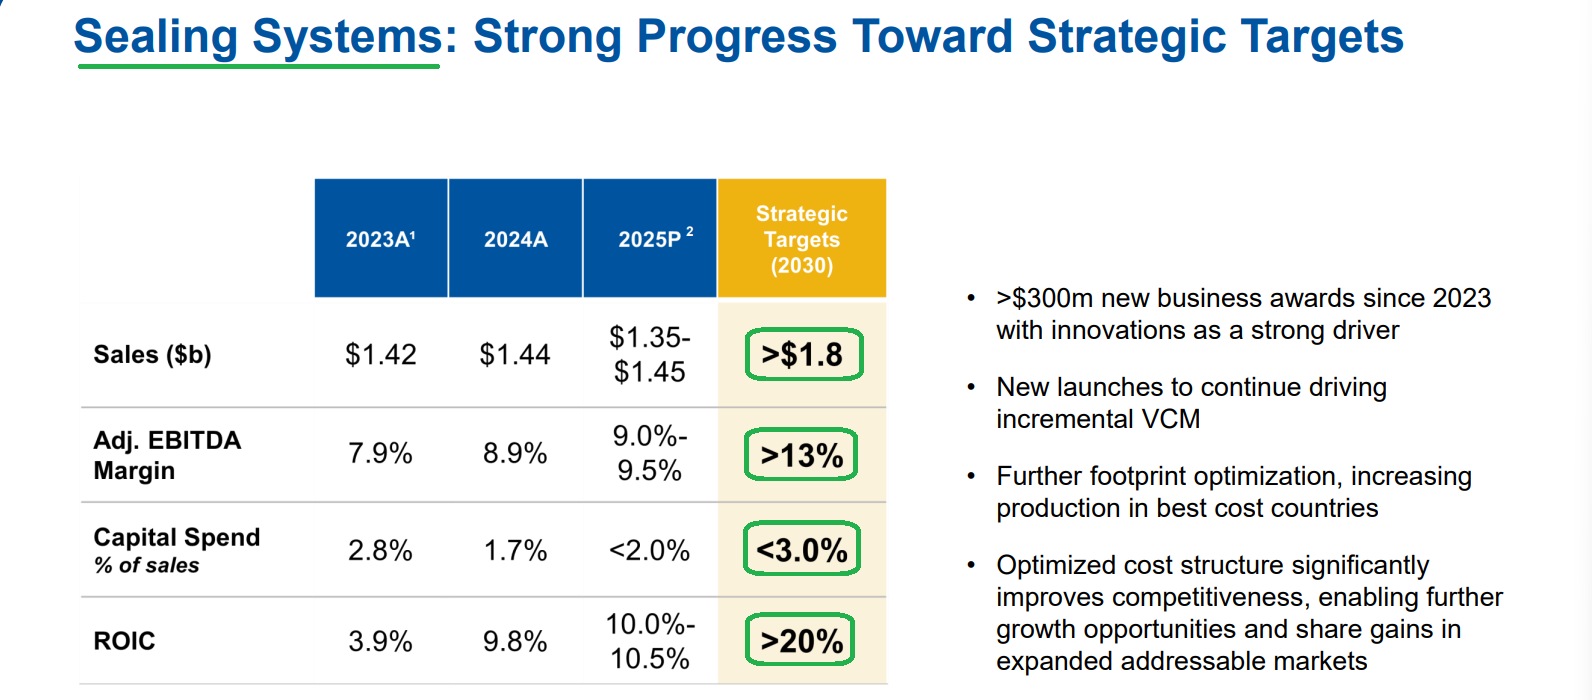
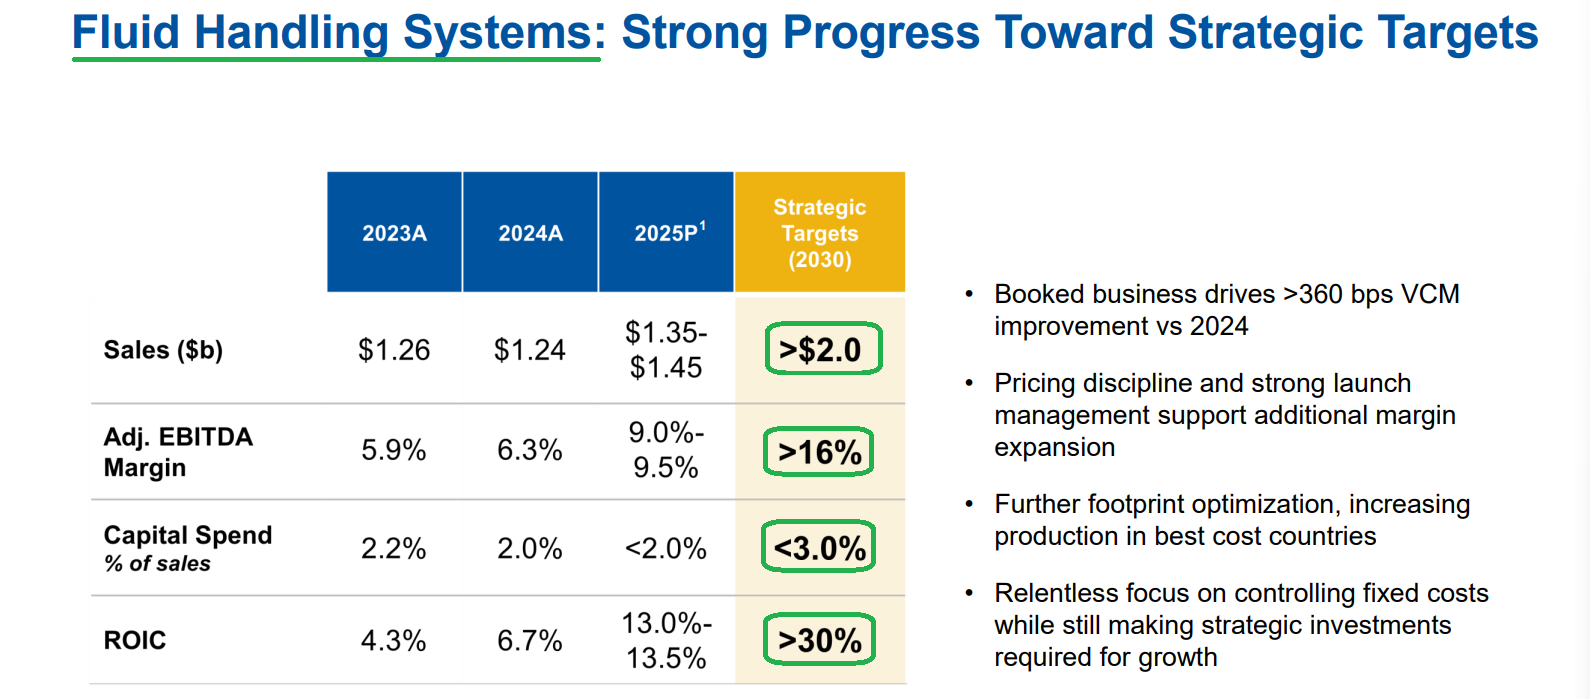
To translate that plan into earnings power, we assume D&A converges with CapEx at 2.5% of sales. We also hold interest expense at today’s ~$110M run rate, give no credit for debt paydown, apply a 25% tax rate and assume modest share dilution of ~1% per year. On those assumptions, delivering the 2030 plan translates to $13.97 in adjusted EPS. Even if CPS captures only half of its targeted margin expansion, reaching ~$440M of adjusted EBITDA at ~11.6% margins, we estimate adjusted EPS of $9.40. For context, the original investment case was anchored to the 2017 peak, when CPS generated $3.6B in sales at a 12.5% EBITDA margin, earned $7.21 per share and traded at $146, despite being a far less efficient business than the one operating today.
What makes us highly confident in the plan is not the targets themselves, but how much management left on the table in setting them. Two of the biggest drivers of an auto supplier’s results, the mix of vehicles being built and the number of them, are both assumed to remain at depressed 2025 levels through the end of the decade, an outcome we assign 0% odds of playing out.
Powertrain mix is the obvious source of upside. The 2030 targets hold mix unchanged from 2025, when hybrids (HEV and PHEV) accounted for 14.3% of U.S. new-vehicle sales. Hybrids are CPS’s sweet spot, carrying 80%+ more Fluid Handling content per vehicle than a comparable ICE vehicle.
The hybrid pivot now underway in the U.S. is a best-case scenario for CPS, with hybrids accounting for a record 17.7% of Q3 retail sales and 15.7% of YTD sales (+3.1 ppts Y/Y). Demand continues to outrun supply, with new hybrids selling in a median of 20 days versus 52 days for gas vehicles. Industry forecasts call for hybrids to finish at ~17% of U.S. sales in 2026 and reach 32% by 2035, more than double the mix embedded in the 2030 plan. The number of hybrid models on the market is also expected to ~triple, from 37 in 2025 to 100 by 2030 and 115 by 2033.
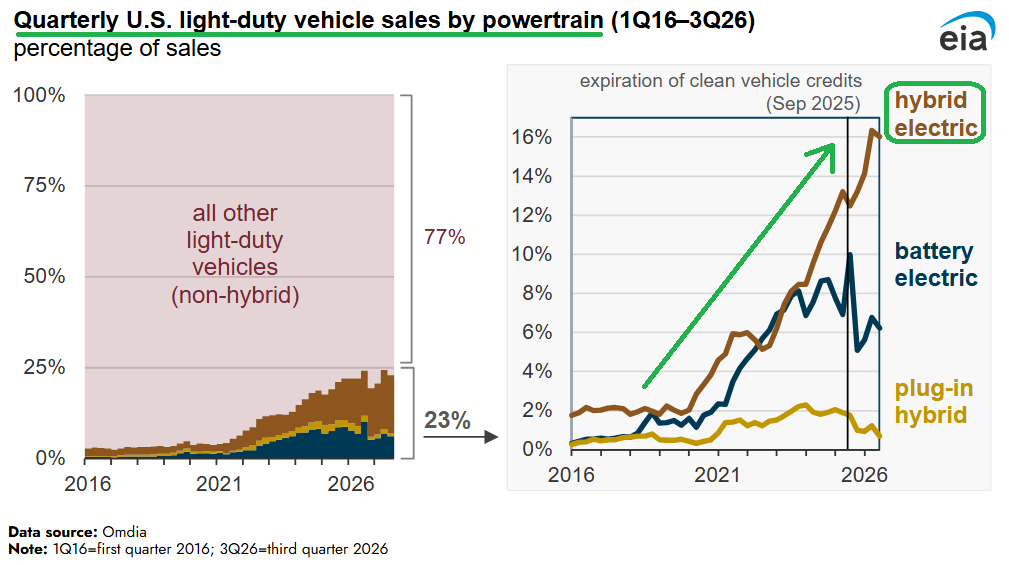
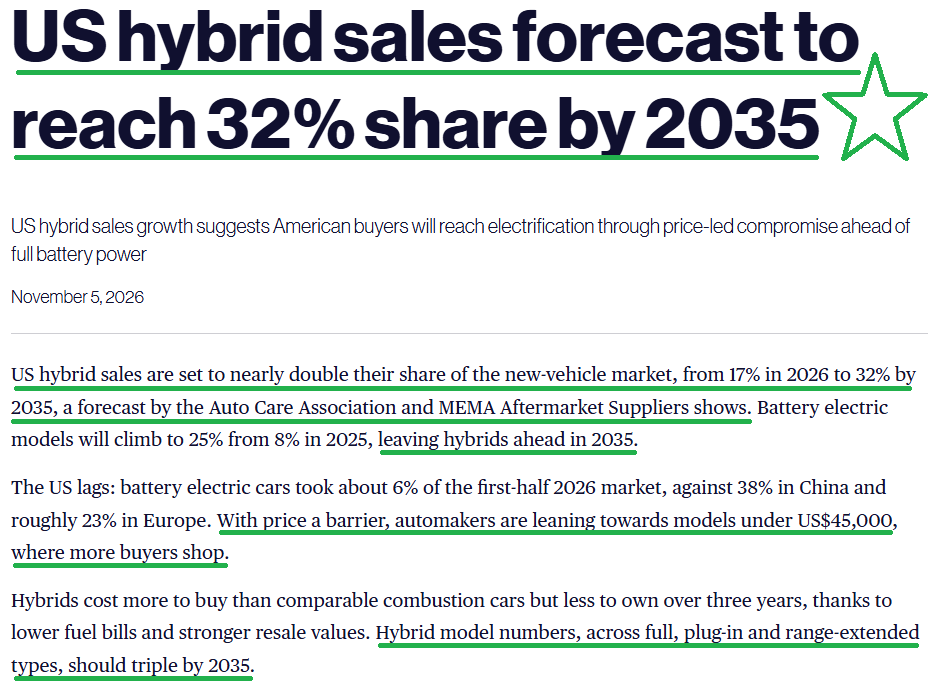
The automakers with the most ground to make up are CPS’s three largest customers, which together account for ~56% of sales. Ford offers three hybrid nameplates today (the Maverick, F-150 and Escape), GM just one in a version of its niche Corvette, and Stellantis one in the Jeep Cherokee Hybrid. All three are now moving to close that gap.
Ford (~27% of sales) plans to “extend our hybrids across our entire lineup over the next several years.” It expects ~50% of its global volume to come from hybrids, extended-range EVs and fully electric vehicles by 2030, up from 17% in 2025.
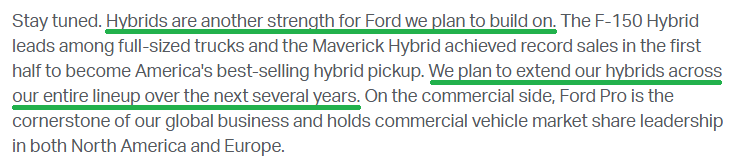
Source: Ford Q2 Earnings Call
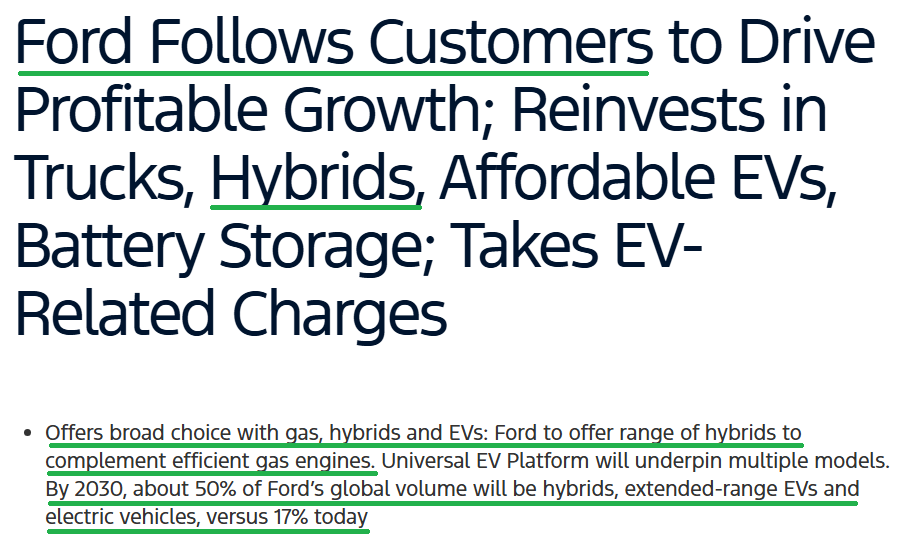
GM (~19% of sales) was the last major domino to fall. After largely sitting out the hybrid market this decade, GM now plans hybrid versions of the Chevrolet Traverse, Buick Enclave and GMC Acadia, three of its strongest-selling SUVs that together represented ~243,000 annual units at 2025 sales levels. The Traverse alone is CPS’s #6 vehicle platform.
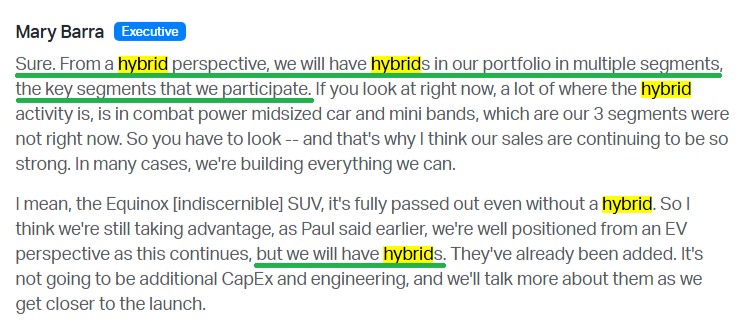
Source: GM Q3 Earnings Call

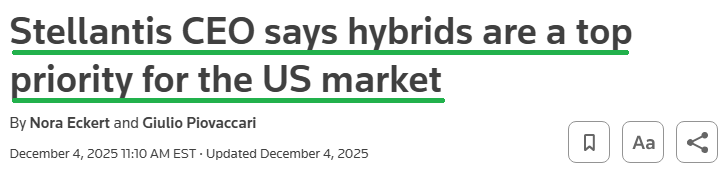
Stellantis (~10% of sales) has committed to 24 conventional hybrid launches globally through 2030, with its CEO calling hybrids a top priority for the U.S. market. The Cherokee Hybrid, CPS’s #10 vehicle platform, is already giving Jeep a boost, with more hybrids on the way.
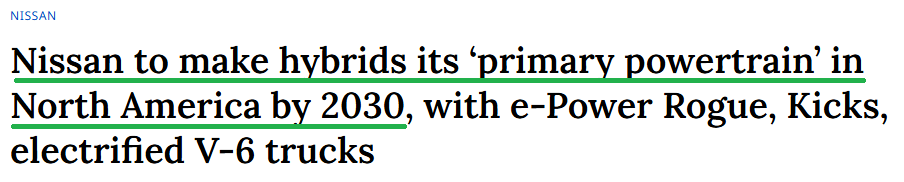
Nissan (~4% of sales) plans to make hybrids its “primary powertrain” in North America by 2030.
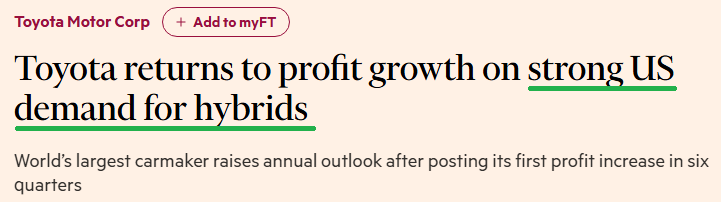
Toyota is already showing where the market is headed. Conventional hybrids accounted for ~51% of Toyota and Lexus U.S. sales in Q3, while Toyota’s electrified sales climbed 29%.
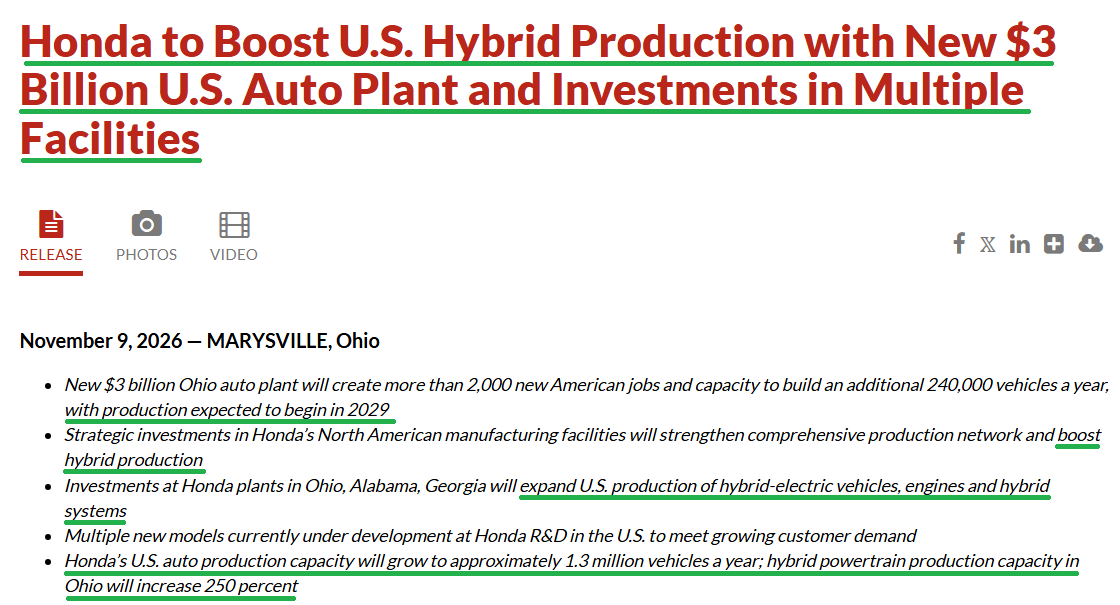
Honda’s hybrid sales rose 21% in Q3 to ~30% of its U.S. mix. Earlier this week, Honda announced a $3B hybrid plant in Ohio with annual capacity of 240,000 units starting in 2029, increasing hybrid powertrain capacity in the state by 250%. The plant builds on investments across Honda’s existing U.S. facilities to expand hybrid production. The company plans to introduce 15 new hybrid models by March 2030, primarily for North America.
Hyundai posted record Q3 hybrid sales (+35% Y/Y), with hybrids accounting for ~28% of its U.S. mix. The company plans to offer more than 10 hybrid models in North America by 2030, with hybrids accounting for almost half of regional sales.

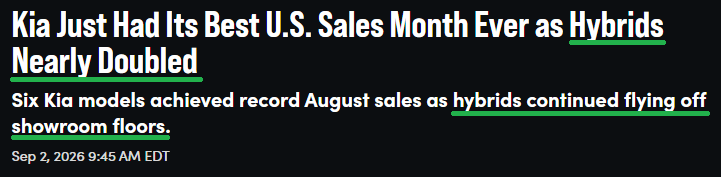
Kia’s U.S. hybrid sales surged 118% Y/Y in Q3, driving an overall record quarter for the brand. Kia is targeting more than 25% hybrid share in the U.S. this year and plans to offer eight hybrid models by 2030.
It does not get much clearer than automakers committing billions of dollars and their product roadmaps to a single powertrain. CPS stands to benefit more than most, with revenue over-indexed to the Detroit late adopters now stepping on the gas to rebuild their lineups around hybrids.
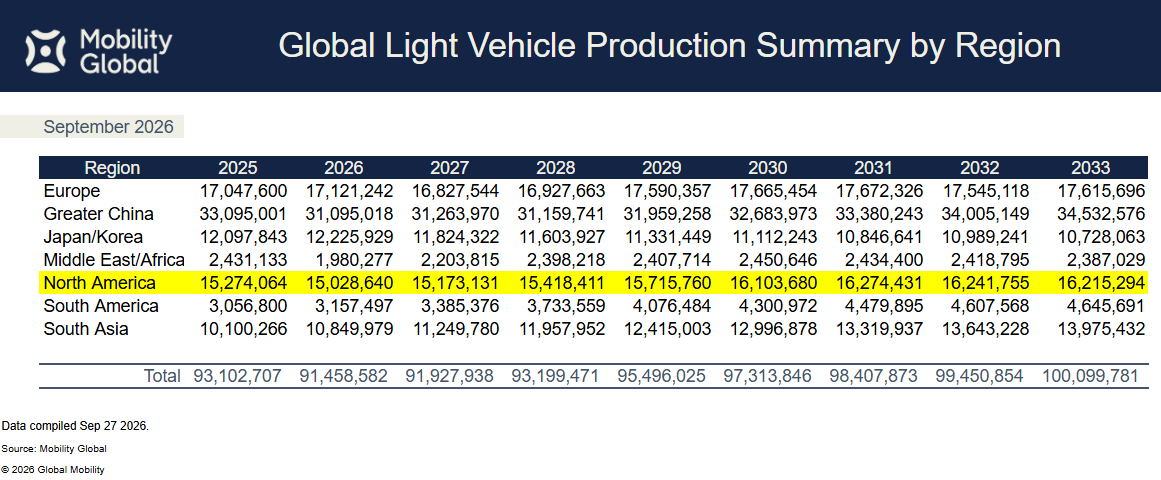
The second driver is volume. Management has built its outlook around what it calls a “mortician’s forecast” for production, with the 2030 plan assuming North American production of no more than ~15.3M units. S&P Global Mobility’s latest forecast calls for production to climb every year from here, from 15.17M in 2027 to 15.42M in 2028, 15.72M in 2029 and 16.10M by 2030, finishing well above the plan’s ceiling.
As a rule of thumb, CPS generated ~$100 in North American sales for every vehicle produced in the region in 2025. Each additional 1M units therefore adds ~$100M in sales and ~$30M-$35M of adjusted EBITDA at the 30%-35% incremental contribution margins management has cited on new production. That math is conservative in its own right. It is based on 2025 content, before the booked business launches, and assumes no lift from hybrids or innovation products. It also weights every vehicle in the region equally, while CPS’s content averages ~$190 per vehicle on its top ten platforms and ~$450 on the F-150, the flagship of an F-Series lineup that sold 828,832 trucks in the U.S. last year. A recovery led by CPS’s biggest programs would carry well more than ~$100 per unit.
Beneath the forecasts sits a beach ball of pent-up demand that can only be held underwater for so long. Every U.S. auto cycle since the 1970s has peaked between 17M and 18M SAAR, when the population was ~30% smaller than it is today. This year, SAAR is running at 16.05M through October.
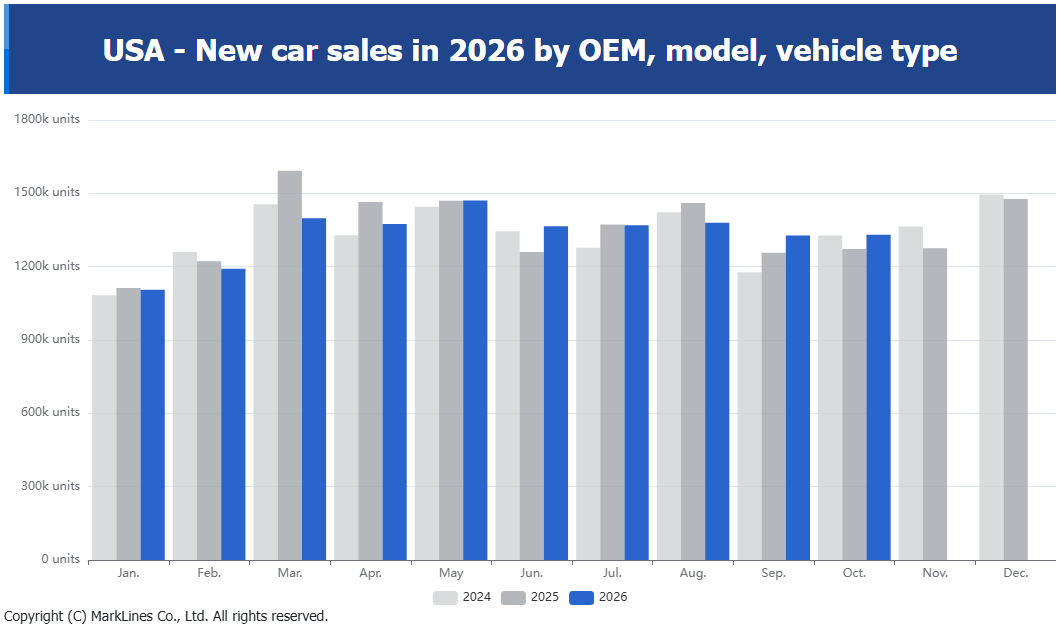
The U.S. population has grown to a record ~343M, with millennials, now the largest generational cohort at more than 74M people, moving through their prime family formation and vehicle ownership years. Growth in licensed drivers is also running at its strongest pace in more than 40 years.
At the same time, the average vehicle on U.S. roads has reached a record 14.5 years old, up from 8.4 years in 1995, building a replacement demand that cannot be deferred forever.
Putting it all together, the market spent this quarter fixated on a commodity recovery lag that has been a question of WHEN, not IF, from the start and that management is already working to shorten. In the process, it overlooked what actually drives CPS’s value over the next 3-5 years. New business awards are headed for a record year at margins that support the long-term targets, with more than 80% of incremental revenue to 2030 already booked. The 2030 plan was reaffirmed in full, built on 2025 mix and a mortician’s forecast for volumes. Hybrids are taking share faster than anyone expected, with CPS’s largest customers stepping on the gas to catch up. Every driver that moves the needle is pointing in the right direction, with most moving faster than the plan assumes. Rarely has the gap between what the market is focused on and what actually drives value been this wide, which, for long-term investors, is about as close to manna from heaven as it gets.
Q3 Earnings Breakdown
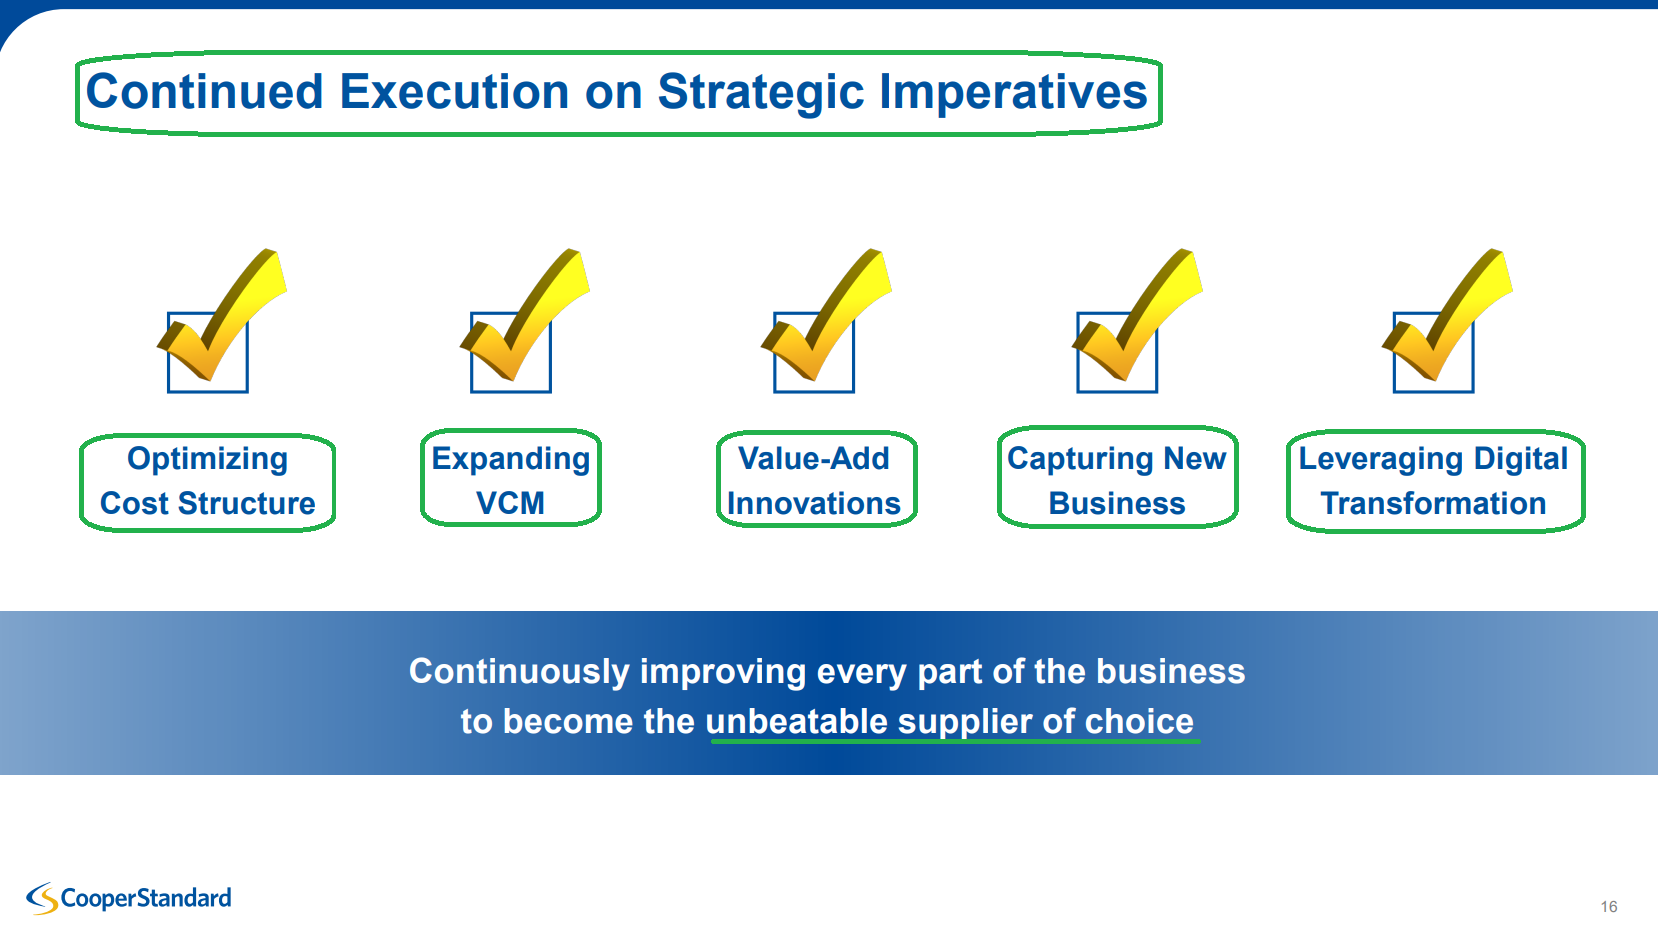
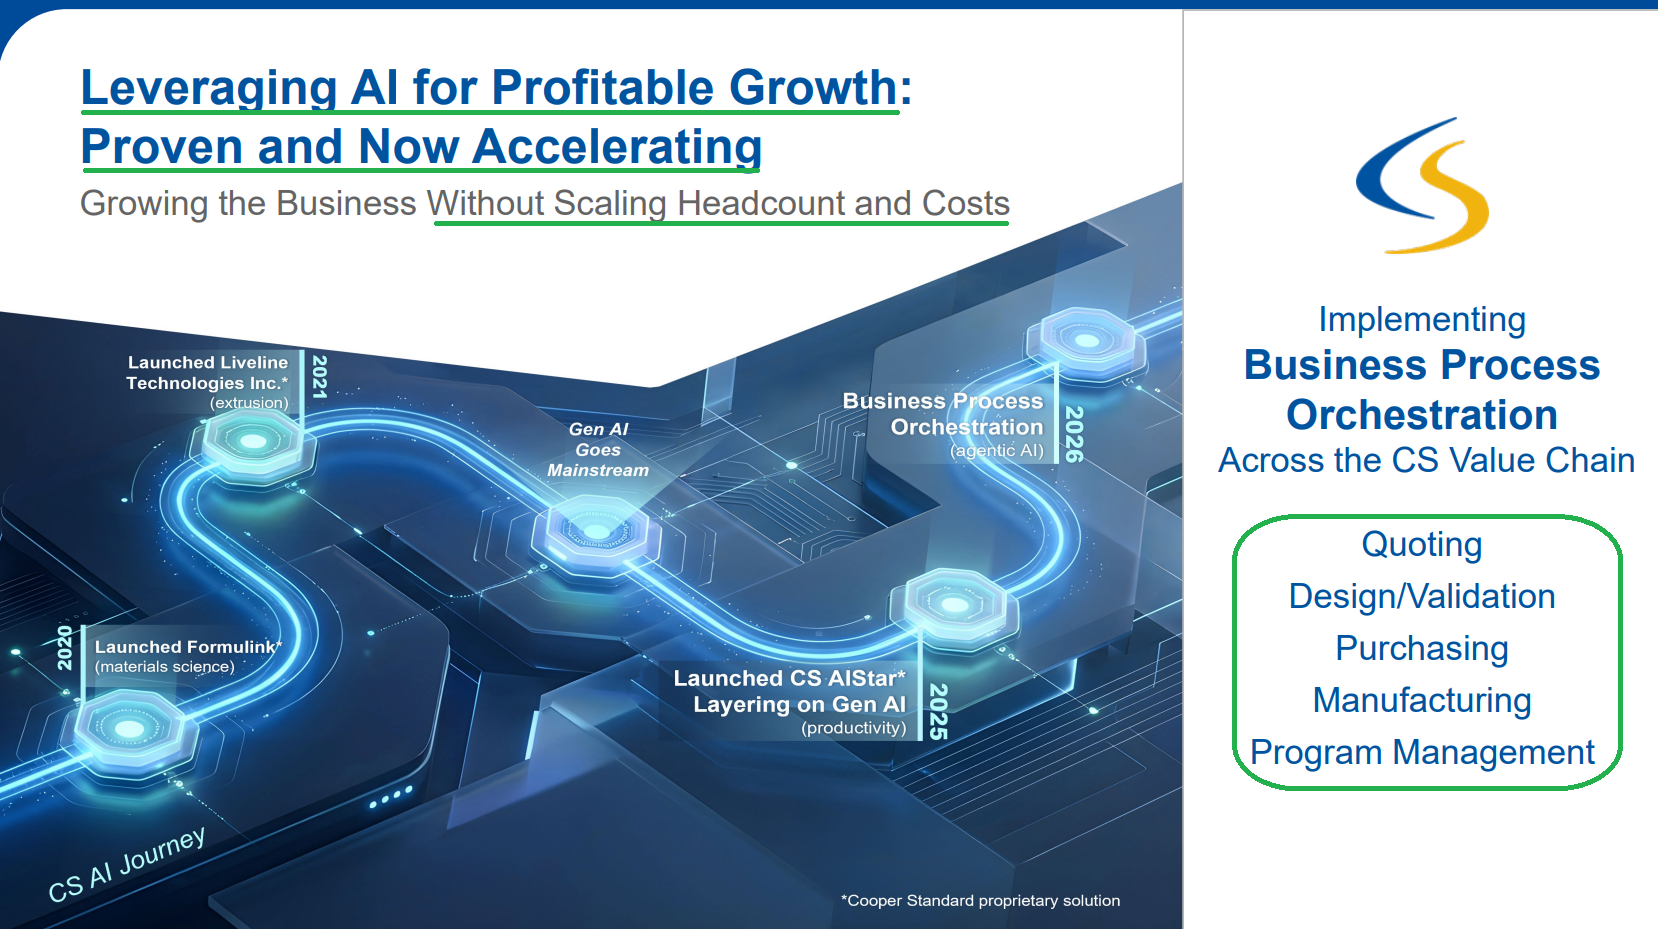
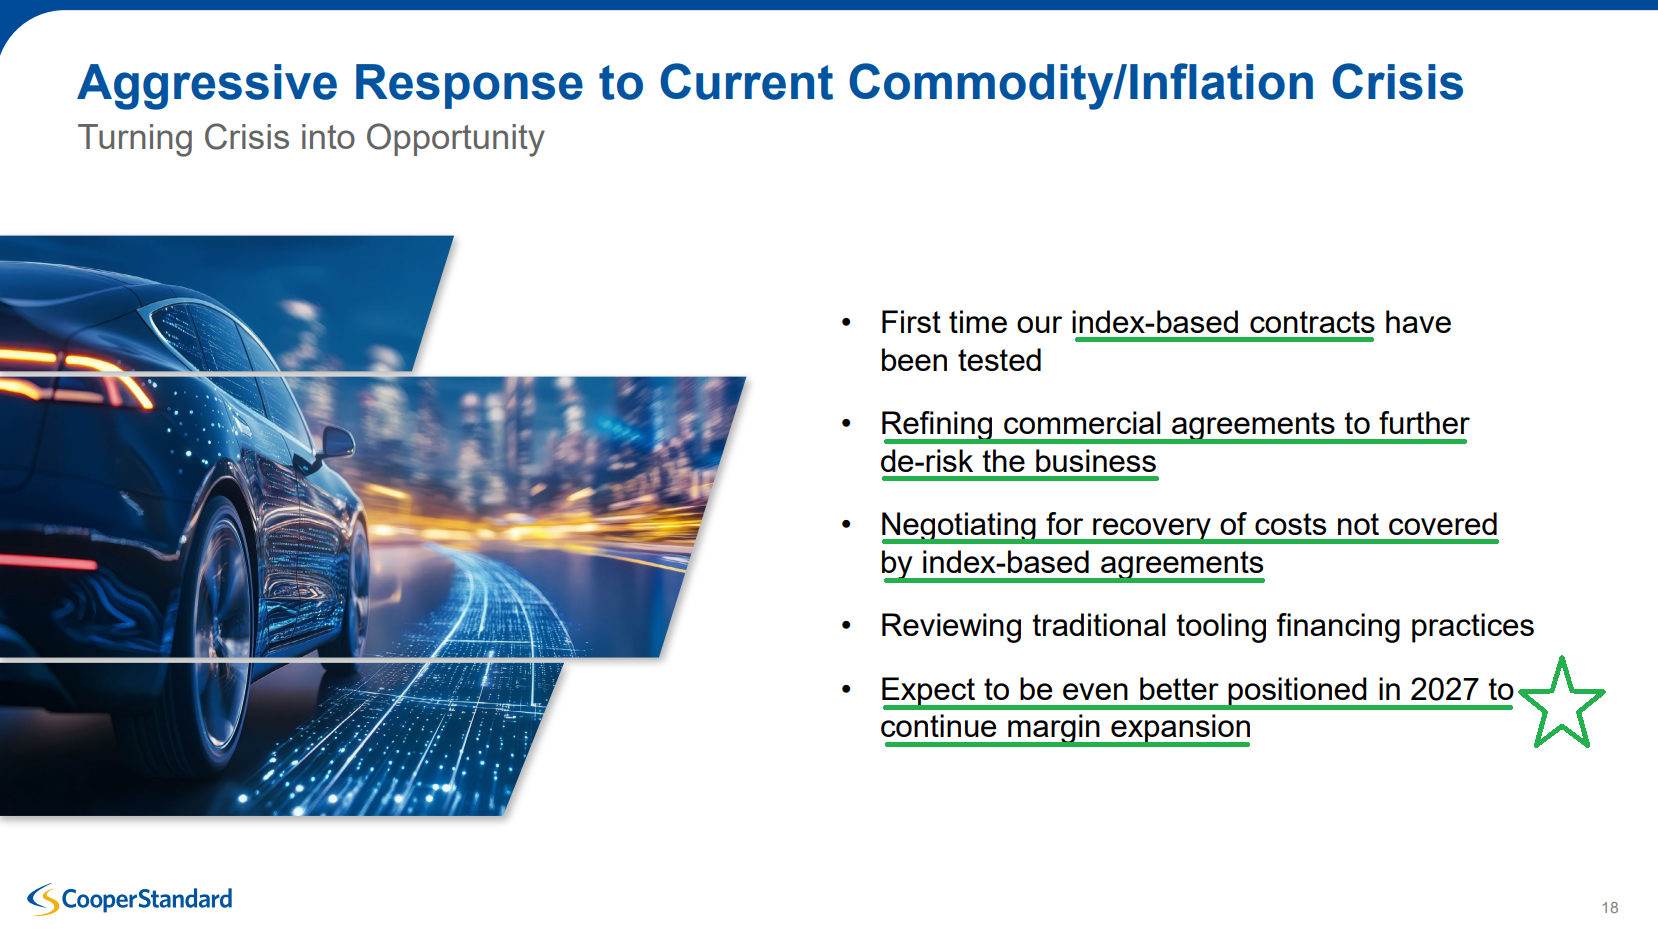
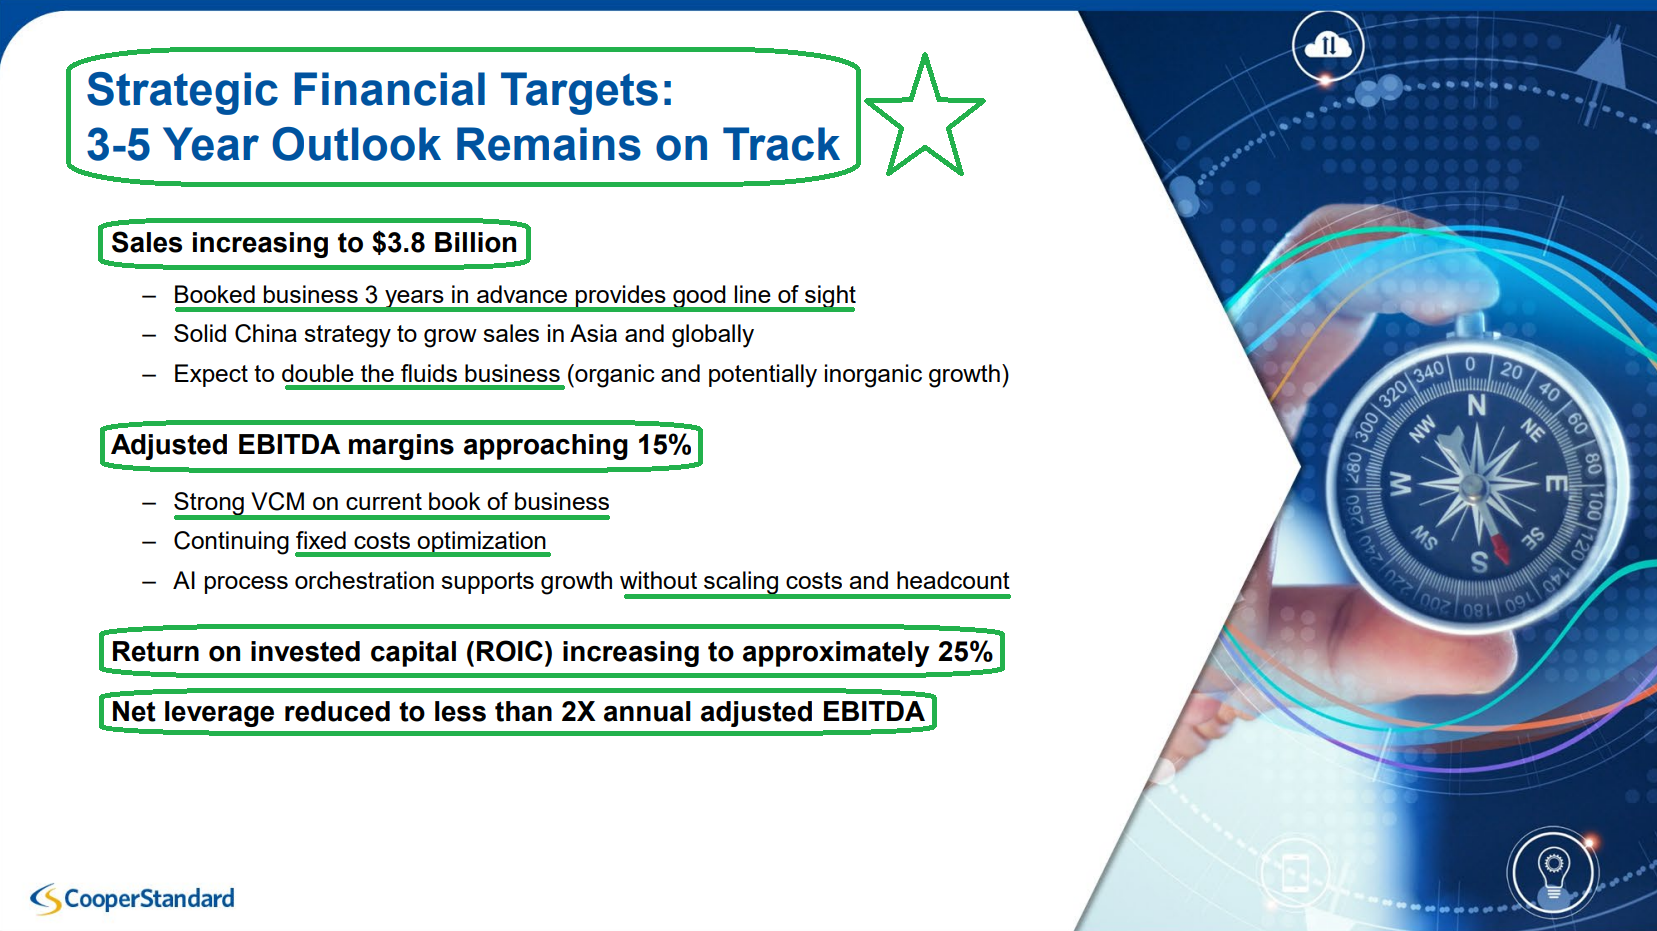
10 Key Points
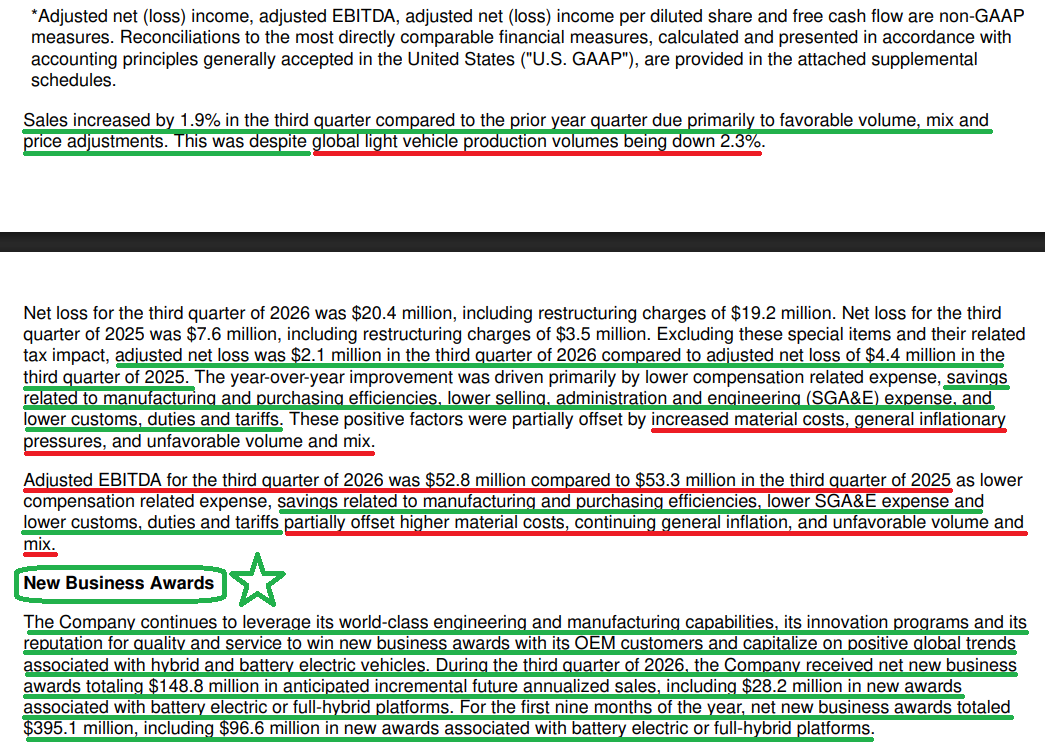
1) Revenue totaled $708.6M (+1.9% Y/Y, -1.8% Q/Q), coming in slightly below consensus of $714.7M. Growth was 1.3% excluding FX despite global light vehicle production falling 2.3% Y/Y, with favorable volume and mix adding ~$9M net of customer price adjustments and recoveries, plus a ~$4M FX tailwind. YTD sales reached $2.1B (+2.3% Y/Y), carried primarily by currency.
2) Gross profit came in at $77.8M (-10.7% Y/Y), with gross margins falling ~150 bps to 11.0% from 12.5% a year ago and ~60 bps sequentially from 11.6% in Q2. Higher material costs drove the pressure, led by oil-linked rubber and plastic feedstocks, along with aluminum. General inflation and elevated launch costs tied to recent conquest business and mid-program transitions added to the pressure. YTD gross margins stand at 11.5% versus 12.4% a year ago, with management expecting performance to ramp in Q4 as the launch schedule lightens and lean savings reach full run rate.
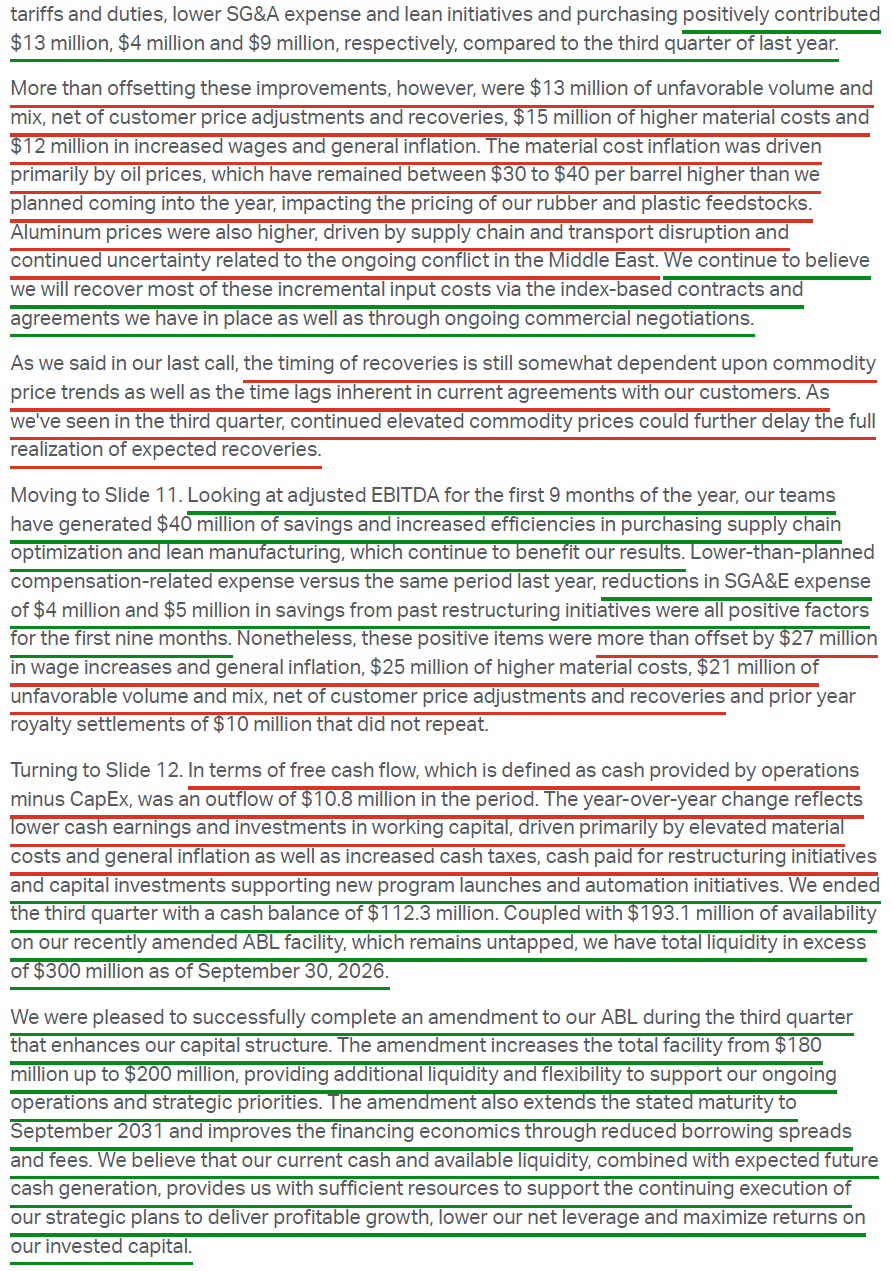
3) Adjusted EBITDA totaled $52.8M (7.5% margins) versus $53.3M (7.7%) a year ago, down 0.8% Y/Y with margins off ~20 bps, missing consensus of $71.1M. Sequentially, adjusted EBITDA slipped 2.0% from $53.9M, with margins flat. The quarter benefited from $15M of lower incentive compensation, $13M of lower customs, duties and tariffs, $9M of manufacturing and purchasing lean savings, and $4M of lower SGA&E. Those gains were more than offset by $15M of higher material costs, $13M of unfavorable volume and mix net of recoveries, and $12M of wages and general inflation. YTD adjusted EBITDA of $157.8M (7.5% margins) compares with $174.7M (8.4%), with $40M of lean savings and $5M of restructuring savings banked YTD.
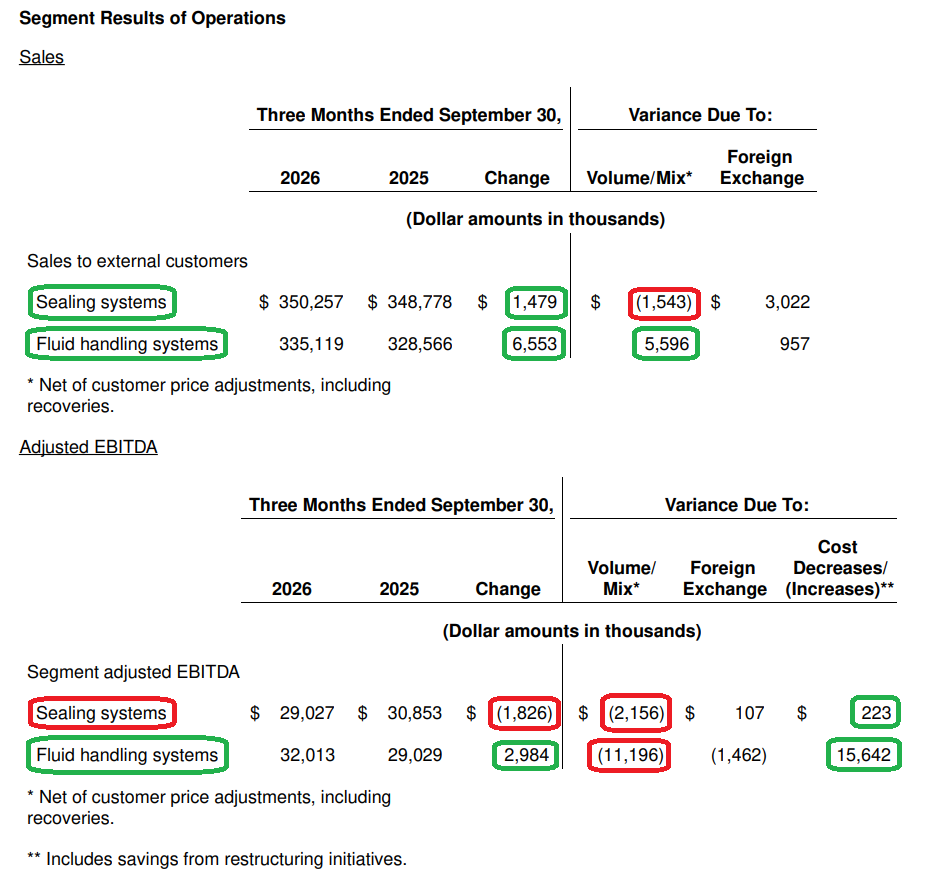
4) Fluid handling systems delivered revenue of $335.1M (+2.0% Y/Y, -2.9% Q/Q), driven by $5.6M of favorable volume and mix, plus $1.0M of FX. Adjusted EBITDA rose 10.3% Y/Y to $32.0M (9.6% margins) from $29.0M (8.8%), with margins up ~70 bps. Net cost decreases of $15.6M, including restructuring savings, more than offset $11.2M of unfavorable volume and mix net of price and recoveries, plus $1.5M of FX. Sequentially, segment EBITDA climbed 15.6% from $27.7M (8.0%) in Q2, with margins up ~160 bps. Management reiterated its plan to double the fluids business, now noting that the path could include inorganic as well as organic growth.
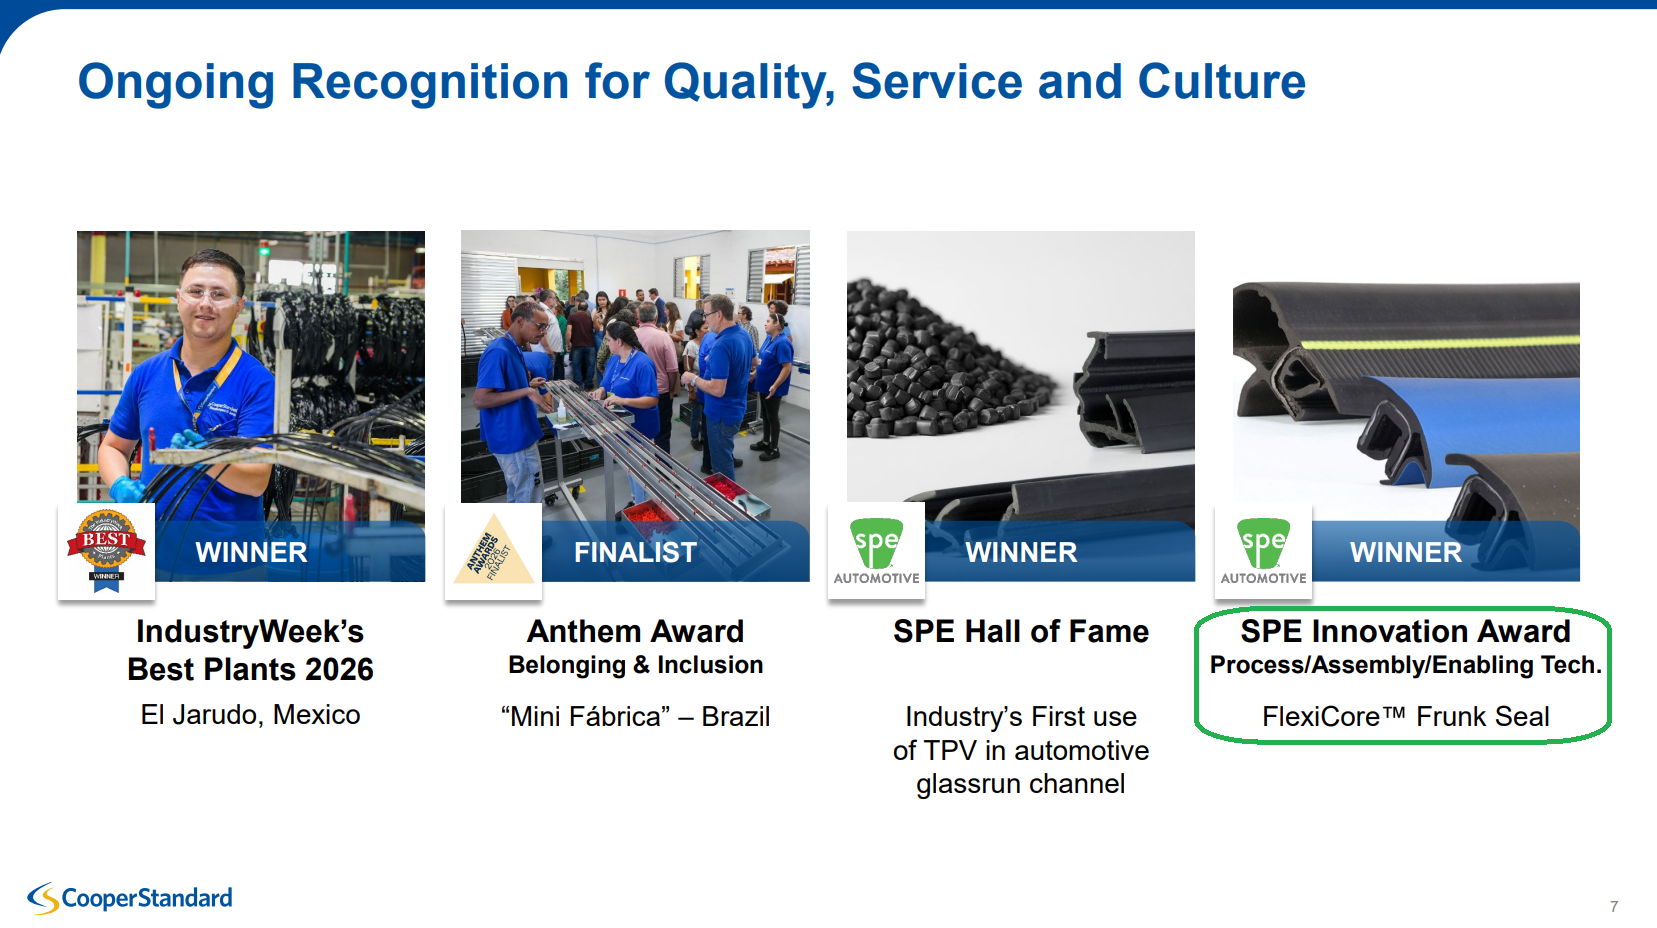
5) Sealing systems delivered revenue of $350.3M (+0.4% Y/Y, -1.1% Q/Q), with a $3.0M FX tailwind offsetting $1.5M of softer volume and mix. Adjusted EBITDA came in at $29.0M (8.3% margins) versus $30.9M (8.8%) a year ago, down 5.9% Y/Y with margins ~60 bps lower. Volume and mix (-$2.2M) drove the decline, while cost savings roughly matched inflation (+$0.2M net). Sequentially, the segment rebounded from $26.1M (7.4% margins) in Q2, up 11.2% Q/Q with margins ~90 bps higher. On the innovation front, the FlexiCore Frunk Seal earned an SPE Innovation Award, adding to the recognition for CPS’s FlexiCore platform.
6) CPS secured $148.8M of net new business awards in Q3, up 54.4% from $96.4M a year ago and 25.7% from $118.4M in Q2. That brings YTD awards to $395.1M (+72.9% Y/Y), essentially reaching the full-year $400M target with a quarter to spare. YTD awards already sit ~33% above all of FY25’s $297.9M and more than double FY24’s $181.4M, leaving CPS just ~$58M shy of 2017’s $453M high. The YTD mix breaks down as ~25% innovation products, ~24% battery electric or hybrid programs, and ~21% high-growth Chinese OEMs, with management noting that average contribution margins remain consistent with its long-term strategic targets. Management expects ~$1B of net new business to launch as 2027 through 2030 arrive. Pricing and costs on that business are already set, leaving volume and mix as the only real variables, with available capacity allowing most of it to launch with minimal incremental capex.
7) Q3 marked the first significant test of the index-based commercial agreements, with oil running $30-$40/bbl above the ~$65 planning assumption. Aluminum was also elevated due to supply chain and transport disruptions tied to the Middle East conflict. Customers are honoring the agreements, though recoveries are lagging on timing, with continued high commodity prices stretching that lag and pushing some recoveries into 2027. Management still expects to recover the majority of 2026 commodity cost increases while renegotiating with customers to shorten recovery timing and refine the indices. Management expects these changes to further de-risk the business and leave CPS better positioned for margin expansion in 2027.
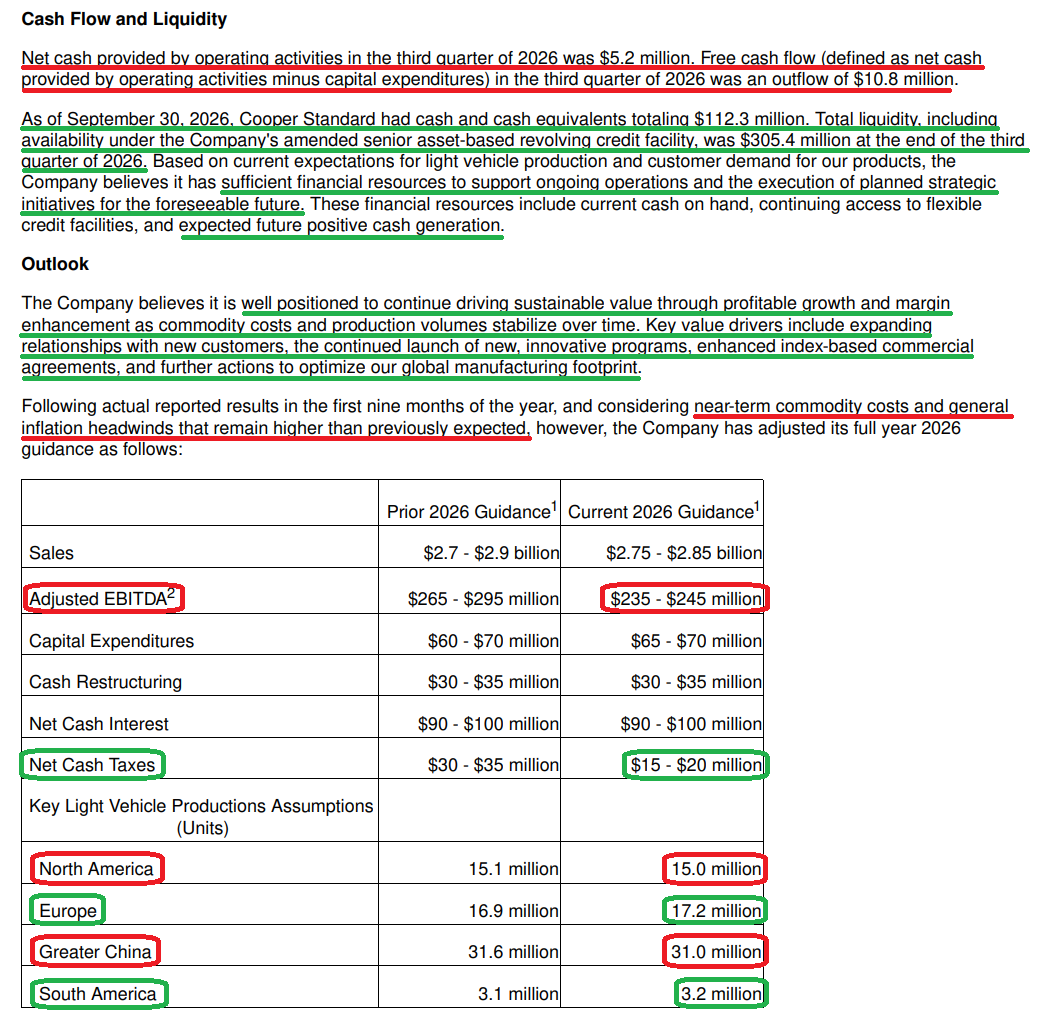
8) Operating cash flow totaled $5.2M versus $38.6M a year ago, with capex of $16.0M (2.3% of sales) up from $11.2M (1.6%) on launch-related and automation investments. Free cash flow came in at an outflow of $10.8M versus +$27.4M in the prior year, a ~$38.2M swing. Lower cash earnings, working capital tied up by elevated material costs and inflation, higher cash taxes, and restructuring cash outflows drove the decline. YTD free cash flow stands at -$87.6M versus -$28.3M, with YTD capex of $53.8M (2.5% of sales). Management expects positive Q4 free cash flow on the usual seasonal working capital release, even with the mid-November interest coupon. The timing of government tariff refunds and commodity recoveries remains the swing factor.
9) CPS ended the quarter with $112.3M of cash (vs. $126.6M in Q2) and total liquidity of $305.4M (up from $294.2M), including $193.1M of undrawn ABL availability. The ABL was amended during the quarter, upsized to $200M from $180M, with maturity extended to September 2031 from May 2029, alongside lower borrowing spreads and fees. Net debt stands at $1.03B against TTM adjusted EBITDA of $192.7M, putting net leverage at 5.4x (vs. 5.3x in Q2), with gross leverage at 5.9x and interest coverage at 1.7x. Following the March refinancing, CPS has no material debt maturities until 2031, with net leverage targeted below 2x.
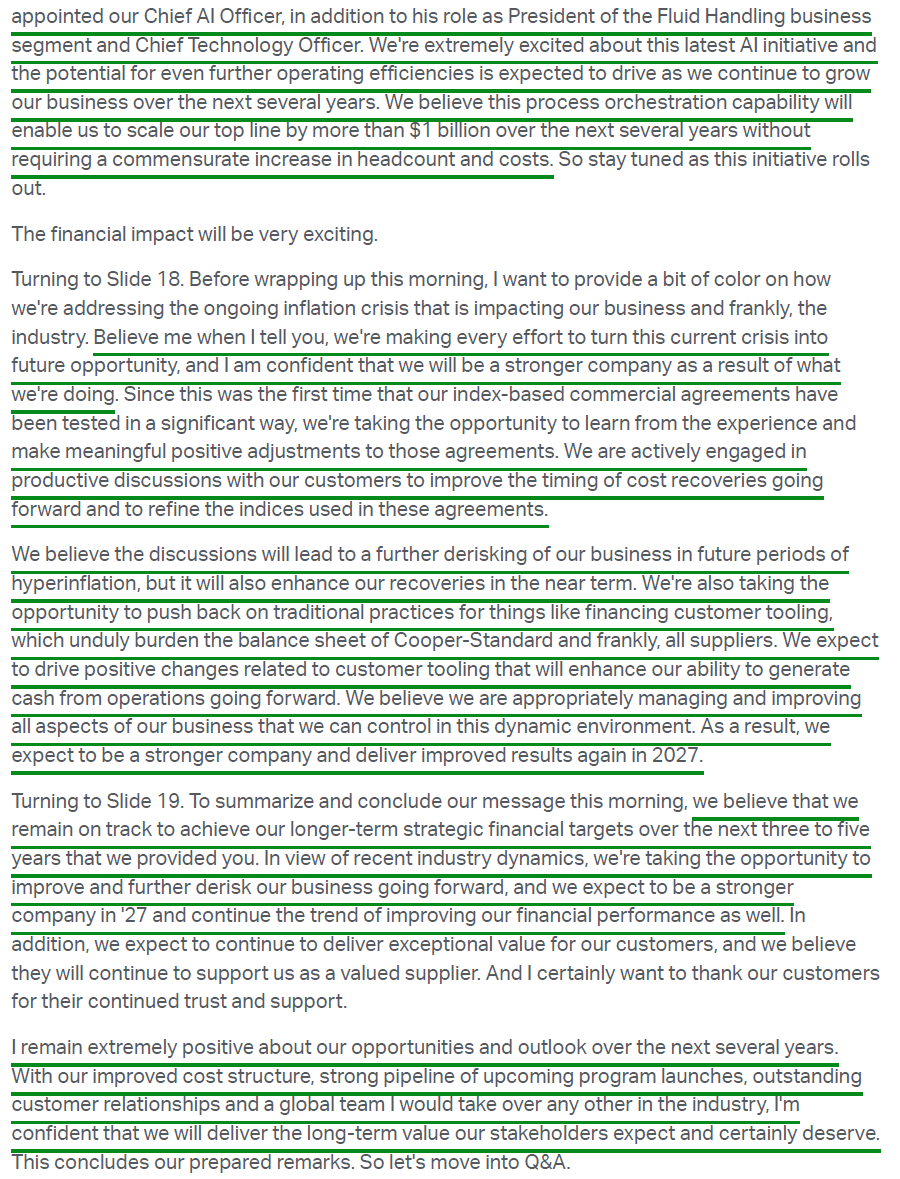
10) Management cut FY26 adjusted EBITDA guidance to $235M-$245M from $265M-$295M, lowering the midpoint by ~$40M (-14.3%) to ~$240M. That’s still +14.5% Y/Y versus FY25’s $209.7M on sales expected to grow just ~2.2%, with margins of ~8.5% (+~100 bps Y/Y). Sales guidance narrowed to $2.75B-$2.85B from $2.7B-$2.9B, with the $2.8B midpoint unchanged. Lean savings are now expected at ~$80M for the year (vs. ~$90M originally), with commodities, delayed recoveries and inflation taking another ~$30M off the outlook versus last quarter, based on an assumption of ~$100/bbl oil. Production assumptions now call for North America at 15.0M (from 15.1M), Greater China at 31.0M (from 31.6M), Europe at 17.2M (from 16.9M), and South America at 3.2M (from 3.1M). The guide implies Q4 adjusted EBITDA of ~$82M, up ~135% Y/Y from $34.9M and ~56% Q/Q, at ~12% margins. Drivers include a lighter launch schedule, full run-rate lean savings, purchasing rebates, and commercial recoveries.
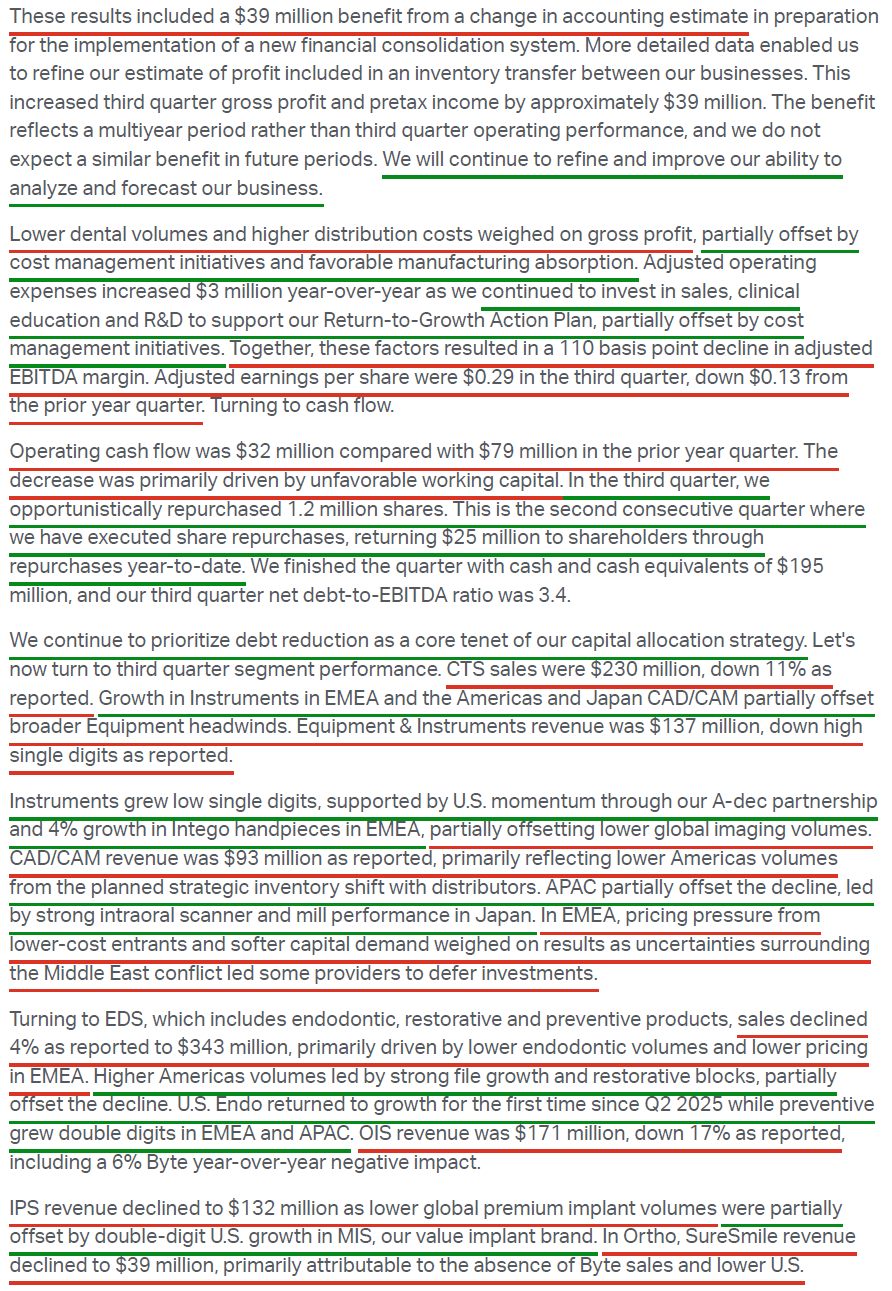
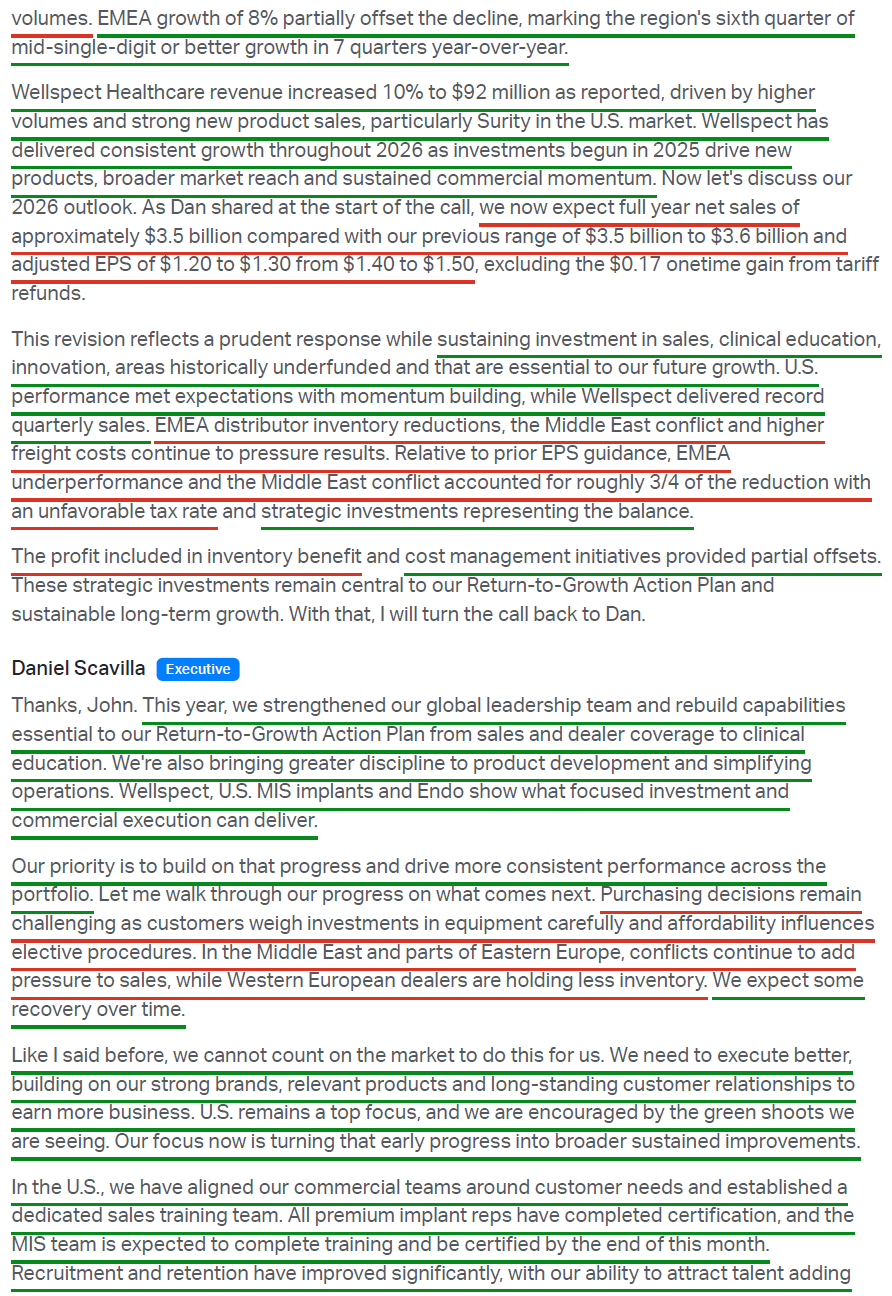
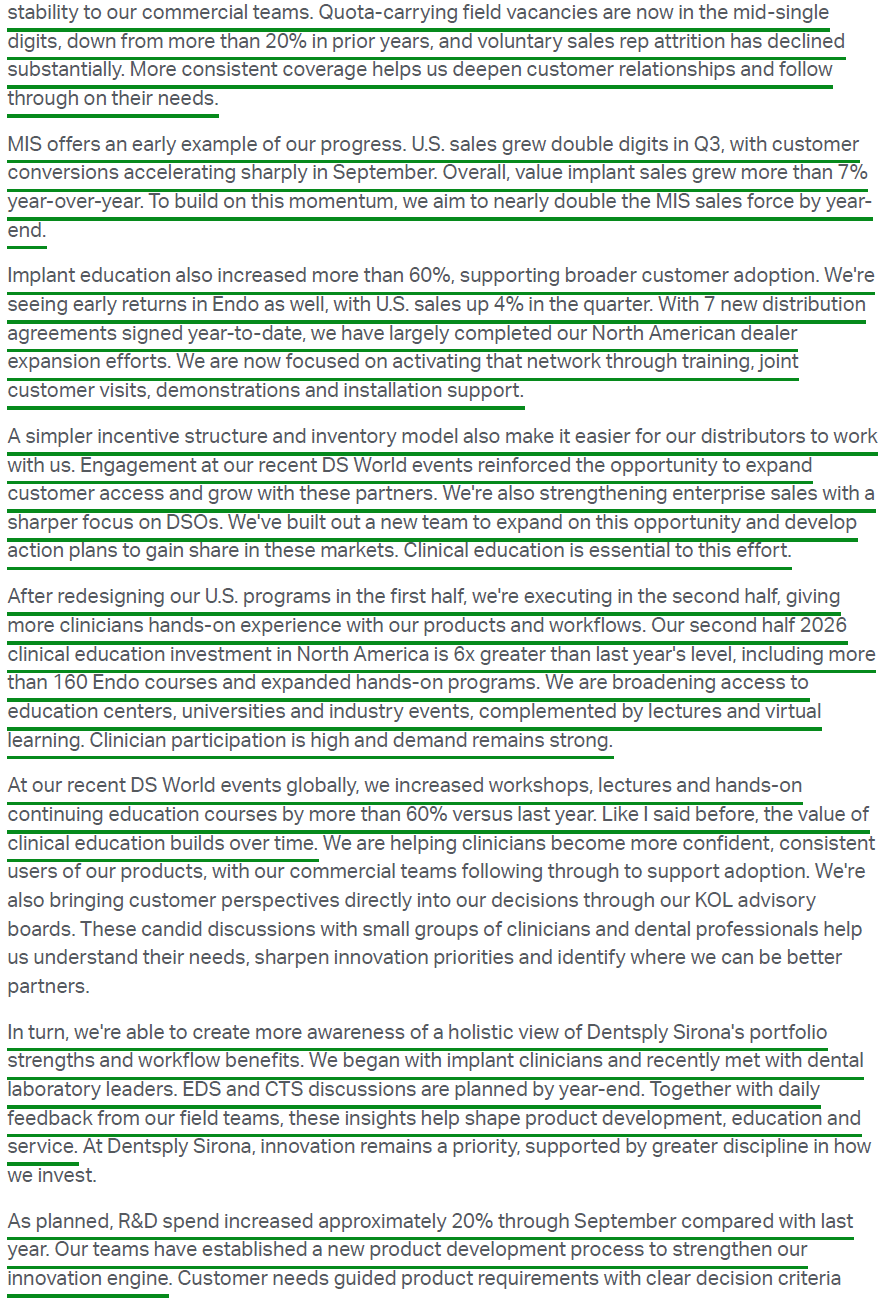
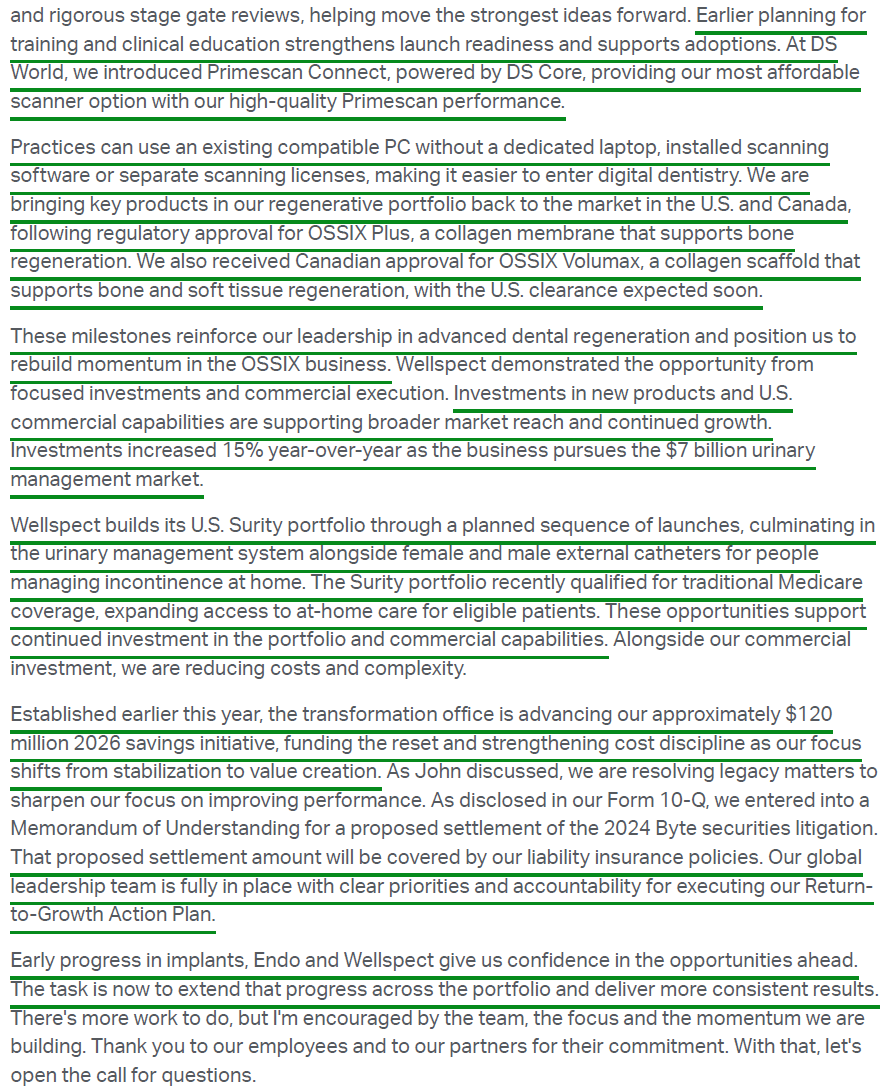
Earnings Call Highlights
Dentsply Sirona Update
For newer readers, here’s a brief overview of the key drivers behind our Dentsply Sirona (XRAY) thesis, a global dental leader with a proven new CEO, a clear self-help playbook, and a cyclical inflection underway as the industry turns the corner:
Company Overview
Born from the 2016 $14.5B merger of equals: Dentsply International (founded 1899, consumables) and Sirona Dental Systems (founded 1877, equipment)
World’s largest diversified manufacturer of dental equipment and supplies: consumables, lab products, orthodontics, implants, and premium technologies
FY2025 revenue $3.68B (-3% reported, -4.3% constant currency); 68% of sales outside the U.S. (43% Europe) – a meaningful beneficiary of a weaker USD
FY2025 sales mix: Essential Dental Solutions 40%, Implants & Prosthetics 17%, Equipment & Instruments 16%, CAD/CAM 12%, Wellspect Healthcare 9%, Orthodontics 6%
YTD 2026 sales mix: EDS 40.9%, CTS 27.4%, Implants & Prosthetics 16.9%, Wellspect 10.1%, Orthodontics 4.7%
EDS is the profit engine: ~41% of sales but ~83% of segment adjusted operating income YTD
Market positions: #1 chairside and #2 imaging (CTS); #1 endodontics, #1 preventive, #2 restorative (EDS); #4 implants; #2 continence care (Wellspect)
#1 leader in single-visit dentistry: CEREC chairside milling/printing enables same-day restorations (vs. a 1+ week lab process); U.S. adoption still below 20% – a major long-term tailwind
Higher-ticket CAD/CAM and equipment skew premium and elective, making the segment more cyclical and rate-sensitive
Dental Industry
~$33B industry growing at a ~3-4% CAGR – attractive, durable, and historically GDP+
Sector is cyclical and currently emerging from a multi-year trough
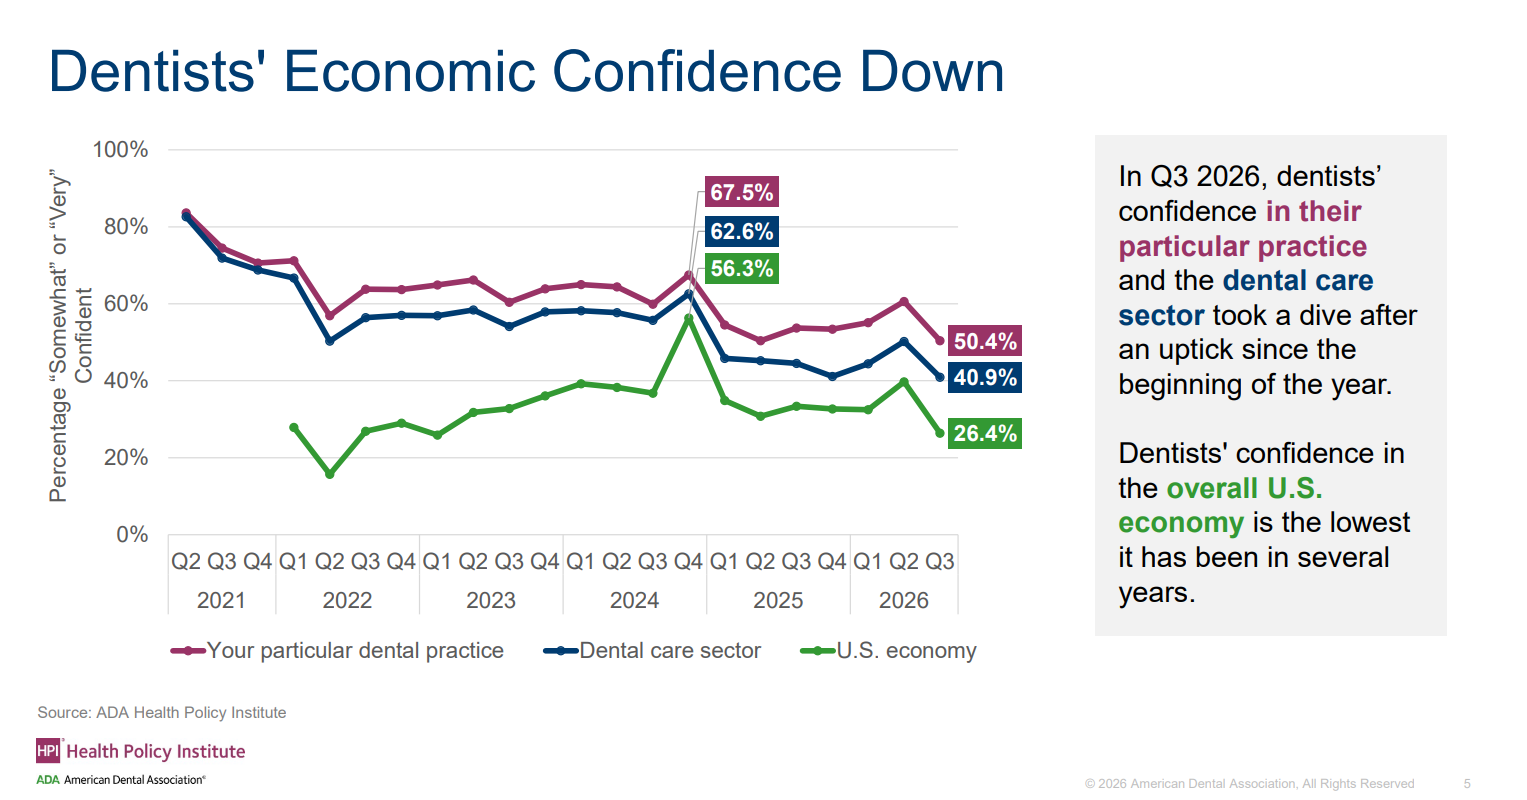
Dentist confidence in their own practices and the dental care sector declined in Q3 2026 after improving since the start of the year
Consumer dental spending continues to lag overall health care spending
Over 10 years, consumer spending on physician services is up 51%, health care up 43%, dental services up 20%
Consumer spending on dental care down 2.4% YTD
Deferred dental care compounds rather than disappears, building a pool of pent-up demand
Peers (Henry Schein, Straumann, Envista, Align) describe stable patient traffic and steady routine procedures, with weakness concentrated in elective/financed procedures and digital equipment
Secular drivers: aging population (more restorative care), aesthetic dentistry demand, shift toward preventive care, digital technology adoption (chairside single-visit)
Turnaround Foundation
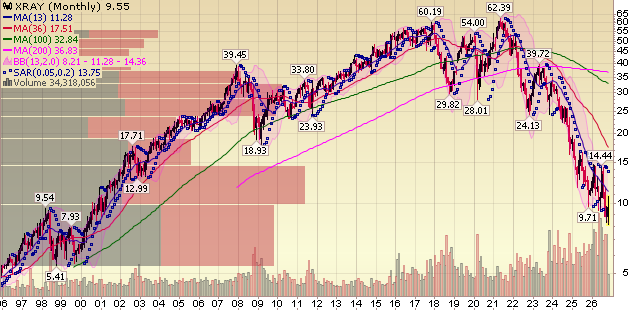
Shares down ~84% from prior highs – market has conflated a cyclical drawdown with permanent impairment
Self-inflicted wound: 2021 $1B Byte acquisition (~6x sales, margin-dilutive clear aligners); sales/marketing suspended in October 2024 after FDA discussions led to write-downs and impairments; Byte headwind (~6 pts of OIS decline in Q3) laps by Q1 2027
Memorandum of understanding (MOU) reached in Q3 2026 for a proposed settlement of the 2024 Byte securities litigation; settlement amount covered by liability insurance
Prior management completed the heavy lifting: ~$300M run-rate cost savings ($200M Phase 1 achieved, $80-100M Phase 2 by end-2025)
Global headcount reduced 8-10%; manufacturing footprint reduced 15-25%
SKU rationalization: ~60% reduction to ~12-15K SKUs (focus on the <15% of products driving ~90% of revenue)
ERP consolidation: from 14 systems to 1 by end-2026
Cost-cutting focus hurt customer relationships, distributor engagement, and commercial execution – creating near-term top-line pressure now being addressed
New CEO: Dan Scavilla
Appointed CEO August 1, 2025; had been a board member since early 2025
Proven track record at Globus Medical (10 years): CFO – Chief Commercial Officer – CEO (2022-2025); stock was a ~4x bagger during his tenure
Led the $3B NuVasive acquisition (2023), doubled the company’s size, created the #2 global spine player, and drove a successful integration – directly relevant to XRAY’s lingering integration questions
Prior: 28 years at Johnson & Johnson in senior leadership roles
Early moves: recruited Aldo Denti (J&J) as CCO, Dustin Shields (Globus) as Chief Transformation Officer, Mark Bezjak (20+ year Zimmer Biomet veteran) to lead North America sales, and Don Zurbay (ex-CEO of Patterson, the #2 dental distributor) to the board
New CFO John Fortson joined July 20, 2026 (EVP & CFO), ex-public-company CFO and CEO; Q3 his first full quarter, focused on strengthening financial systems/forecasting, consistent execution, disciplined investment, and stronger cash generation
Global leadership team now fully in place
Five directors bought ~$516K of stock on the open market in June 2026
Return to Profitable Growth – Commercial Rebuild
24-month plan targeting a return to profitable growth
Top priority: fix the U.S. business (~a third of sales; -6.2% in FY2024, -12.3% in FY2025; Americas -10.6% cc YTD 2026); U.S. performance met internal expectations in Q3
Re-engaged and expanded distribution agreements with Henry Schein, Patterson, Benco, Burkhart, and A-dec; shifting to a drop-ship model with full vendor adoption targeted by Q4
Drop-ship transition (dealers selling down stock rather than reordering) weighed on CTS in Q3: distributor-held CAD/CAM inventory fell ~$9M vs. a ~$20M build in Q3 2025 (~$29M Y/Y swing); distributor CAD/CAM and imaging inventory now below historical averages
Expanded relationship with Midwest Dental Equipment & Supply, with Midwest Dental offering Dentsply Sirona’s technology portfolio in the U.S. effective November 1, 2026
Seven new distribution agreements signed in 2026, mostly giving existing consumables dealers access to the full technology portfolio; North American dealer expansion now largely complete, with focus shifting to activating the network (training, joint customer visits, demonstrations, installation support)
Announced an expanded partnership with Medline Sinclair in Canada, broadening CTS portfolio access; also expanded partnerships with Atlanta Dental and Nashville Dental
Two of the newer U.S. dealers are already growing double digits, though capital sales run on a ~9-month productivity lag, weighting the payoff toward 2027
U.S. sales force stabilizing: sales territories without a rep down to mid-single digits from >20%; voluntary rep attrition down substantially; premium implant reps 100% certified, MIS (value implant brand) team certified by year-end; aiming to nearly double the MIS sales force by year-end
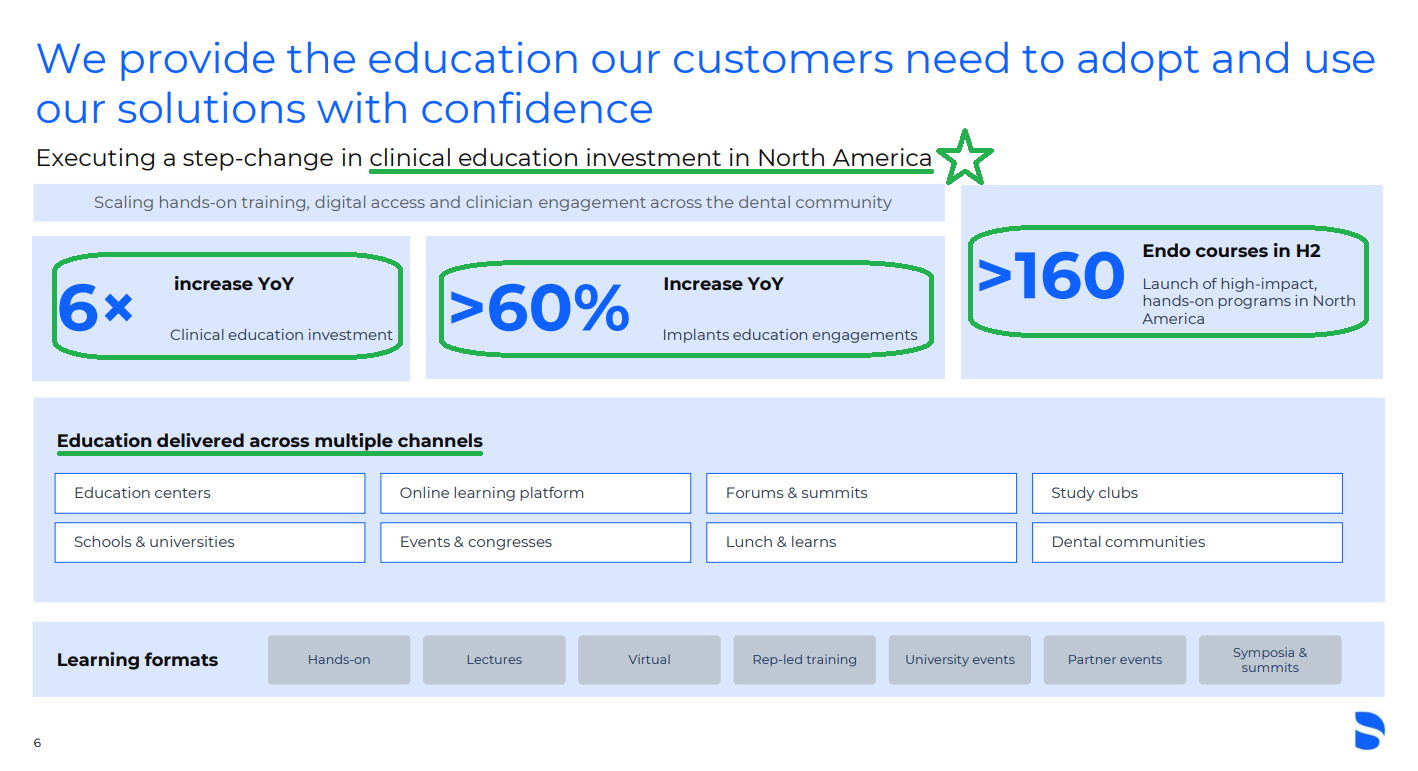
Clinical education: H2 2026 North American investment up 6x Y/Y, including >160 Endo courses; implant education engagements up >60%; DS World events with 60% more workshops, lectures, and hands-on CE courses
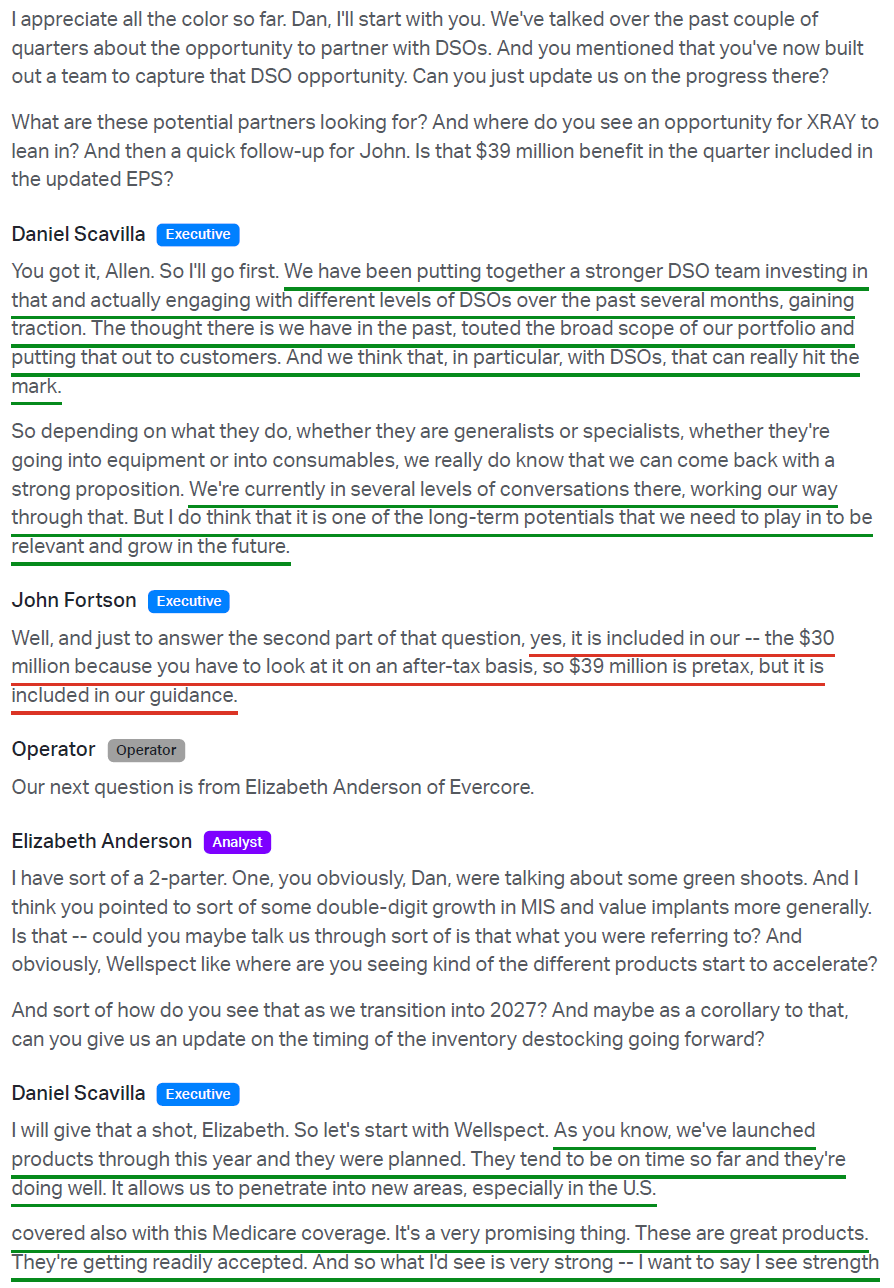
New team built to target dental service organizations (DSOs)
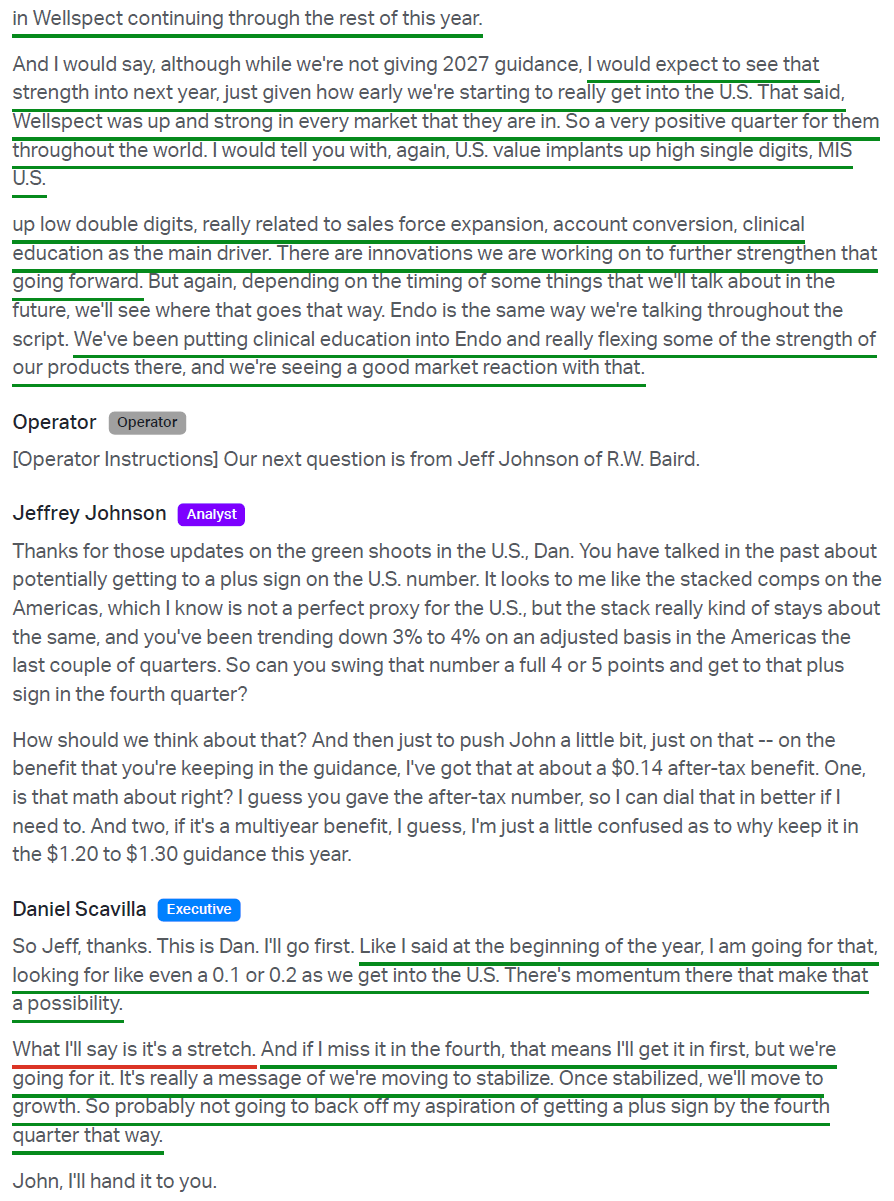
Early U.S. green shoots in Q3: U.S. MIS up low double digits, U.S. value implants up high single digits, U.S. Endo +4% (first growth since Q2 2025); Americas EDS -0.8% cc vs. -3.0% in Q2
Envista blueprint: Envista’s implant business fixed the same problem (premium share loss after underinvestment) with ~$25M/yr in sales coverage, clinical education, and R&D (R&D ~3.7% to ~4.2% of sales, 10x more clinicians trained in 2025 vs. 2023); implants back to ~flat by late 2024 within ~4-6 quarters, fastest growth since 2022 in 2025, and still accelerating in 2026
Return to Profitable Growth – Innovation, Cost Savings & Timeline
Ramping R&D from ~4% to ~5-6% of sales; double-digit increase planned over the next 24 months. Q3 R&D was $42M (5.0% of sales vs. 4.1% in Q3 2025), up ~20% YTD – the step-up continues to show up in the P&L
Q3 launches: PrimeScan Connect (most affordable scanner option, entry point into digital dentistry); OSSIX Plus collagen membrane back on the market in the U.S. and Canada; OSSIX Volumax approved in Canada with U.S. clearance expected soon
Management expects meaningful new product contribution to ramp into 2027 and certainly 2028
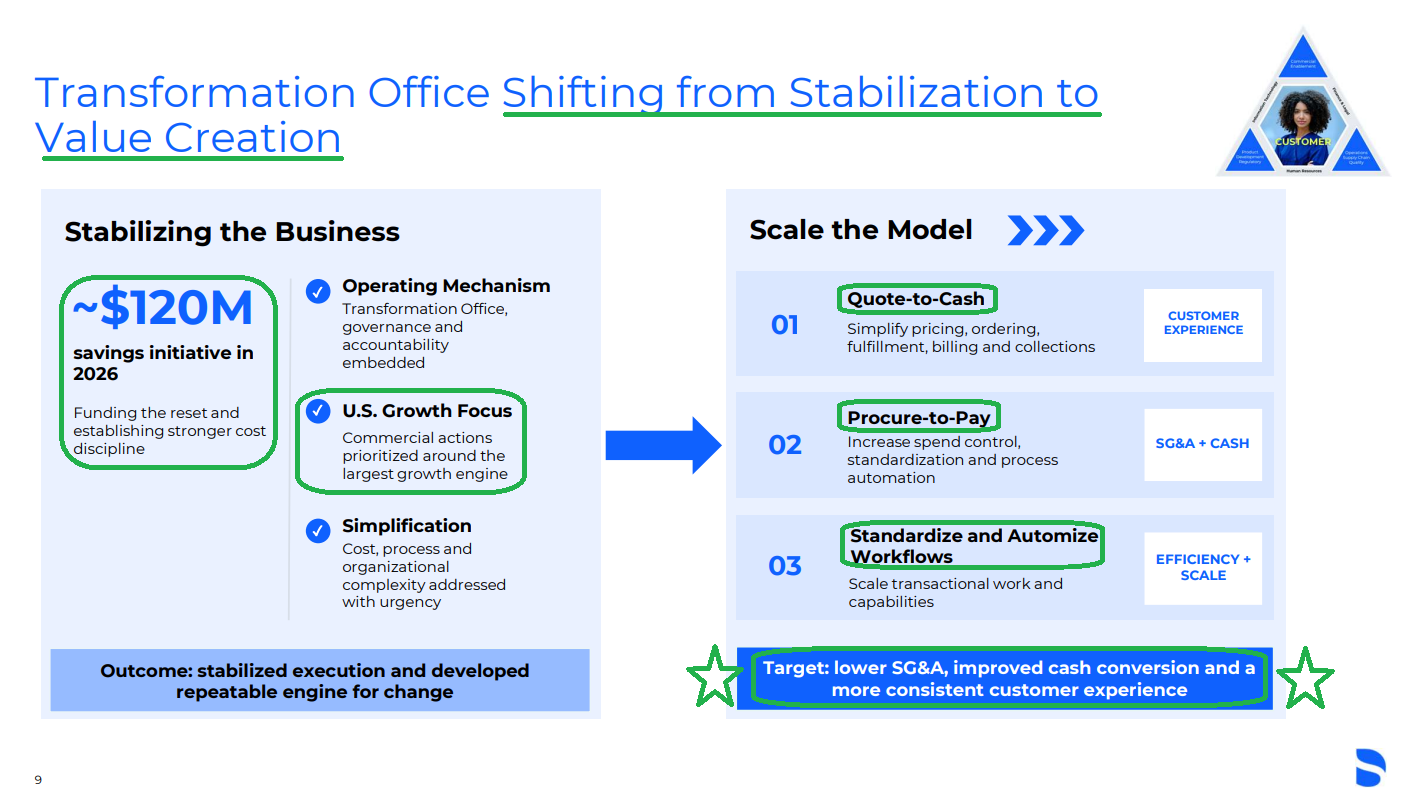
$120M restructuring and indirect cost optimization program announced – savings fully fund the R&D ramp with no margin trade-off
Q3 adjusted OpEx was up $3M Y/Y as cost savings continued to fund sales, clinical education, and R&D per the Return-to-Growth plan
Transformation Office now shifting from stabilization to value creation (quote-to-cash, procure-to-pay, workflow automation), targeting lower SG&A and improved cash conversion
Key levers include indirect cost optimization, lean principles across the organization, simplifying the operating model, and rationalizing legal entities and IT systems
Still targeting a return to positive U.S. growth in Q4 2026 (a “stretch” per Scavilla); if not Q4, then Q1 2027
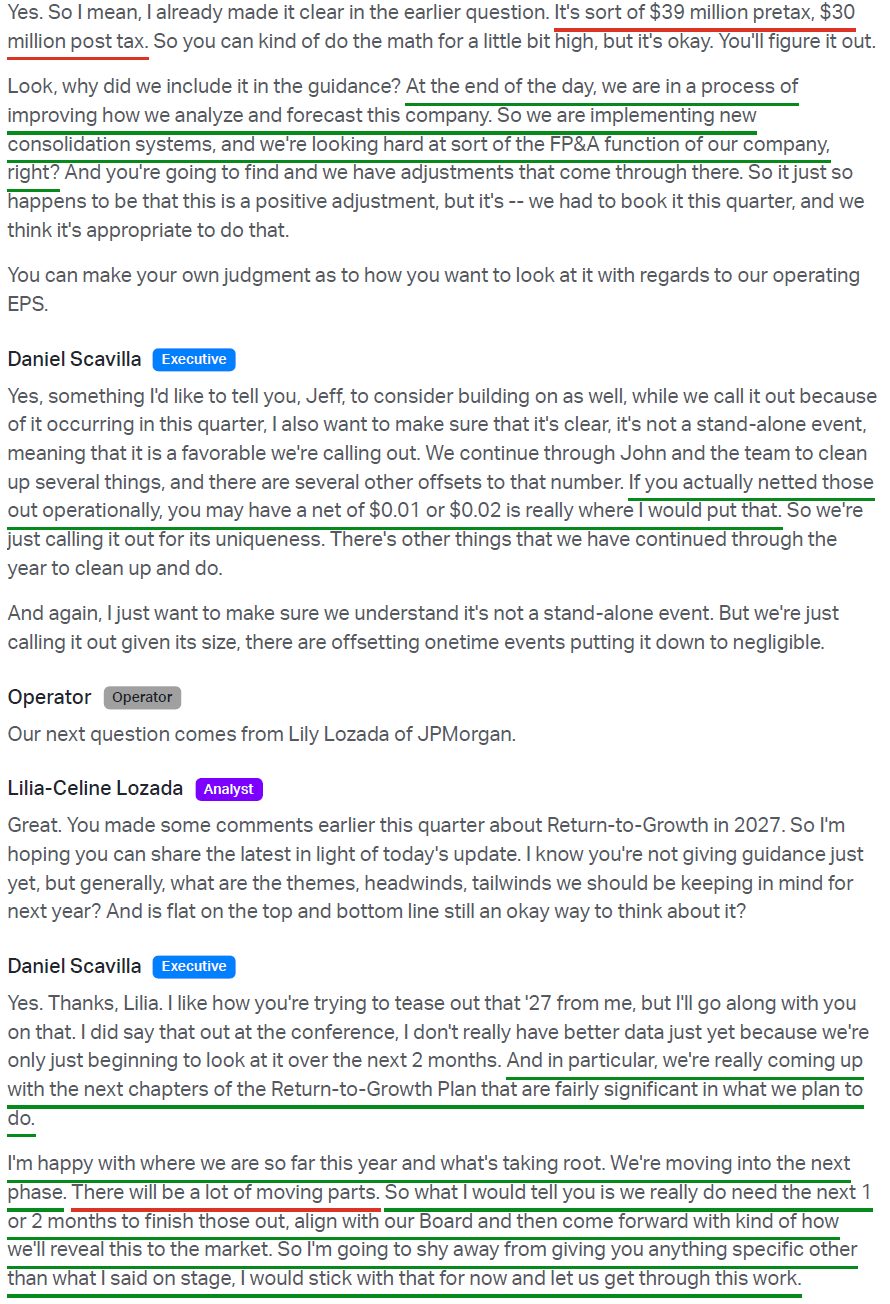
Next chapters of the Return-to-Growth plan described as “fairly significant”; 2027 plan to be finalized and aligned with the board over the next 1-2 months
Guidance assumes no improvement in the underlying dental market – macro recovery would be pure upside
Goal: achieve at or above market growth regardless of the macro dental environment
Wellspect Healthcare – Hidden Asset
Leader in bladder and bowel management (continence care): LoFric and Navina brands; 40+ year history
~10% of total sales YTD ($325M in 2025) but ~40% of FCF – a high-margin, cash-generative segment (~27% segment margins in Q3 even with stepped-up investment)
Consistent mid-single-digit organic growth: +5.8% in 2024, +3.9% in 2025, accelerating to +11.0% cc in Q3 2026 (record quarterly sales of $92M, growth in every region); on track for 5th straight year of top line growth
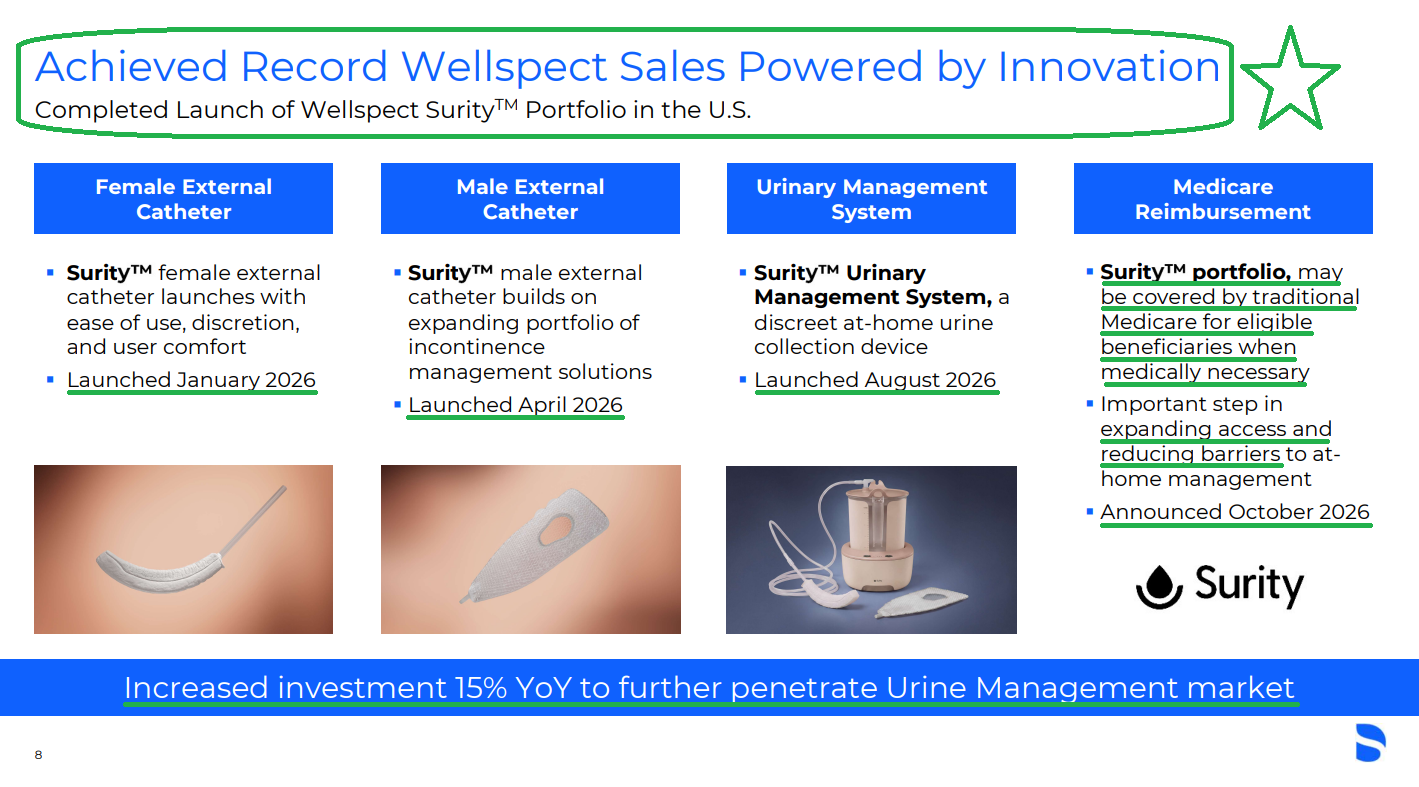
Completed the U.S. Surity portfolio in 2026: female external catheter (January), male external catheter (April), at-home Urinary Management System (August); Americas +78.6% cc in Q3
Investment up 15% Y/Y to further penetrate the ~$7B urinary management market; management expects strength to continue into 2027
Retained after a strategic review (considered for sale but kept for strong cash generation, untapped potential, and late-stage investments)
Key dry powder to fund the dental business recovery
Significant optionality: could be worth >half the current market cap if separated; reportedly attracted ~$1B bids in 2023, when the business generated $288M of revenue and $87M of segment profit
Surity portfolio qualified for traditional Medicare coverage for eligible beneficiaries (October 2026)
Newly established Medicare coding may help reduce barriers to care while expanding access to at-home management for people with severe urinary incontinence
Financials + Valuation
FY2025: gross margin 50.0% (-160 bps, including ~$23M tariff headwind); adj. EBITDA margin 18.1% (+150 bps); adj. EPS $1.60 (-4.6% Y/Y); FCF $104M (-63% Y/Y vs. $281M)
Q3 revenue $836M (-7.6% reported, -7.0% cc), missing consensus ~$861M; excluding Byte, ~$10M of planned dealer inventory reductions, and other one-time items, -3.8% cc
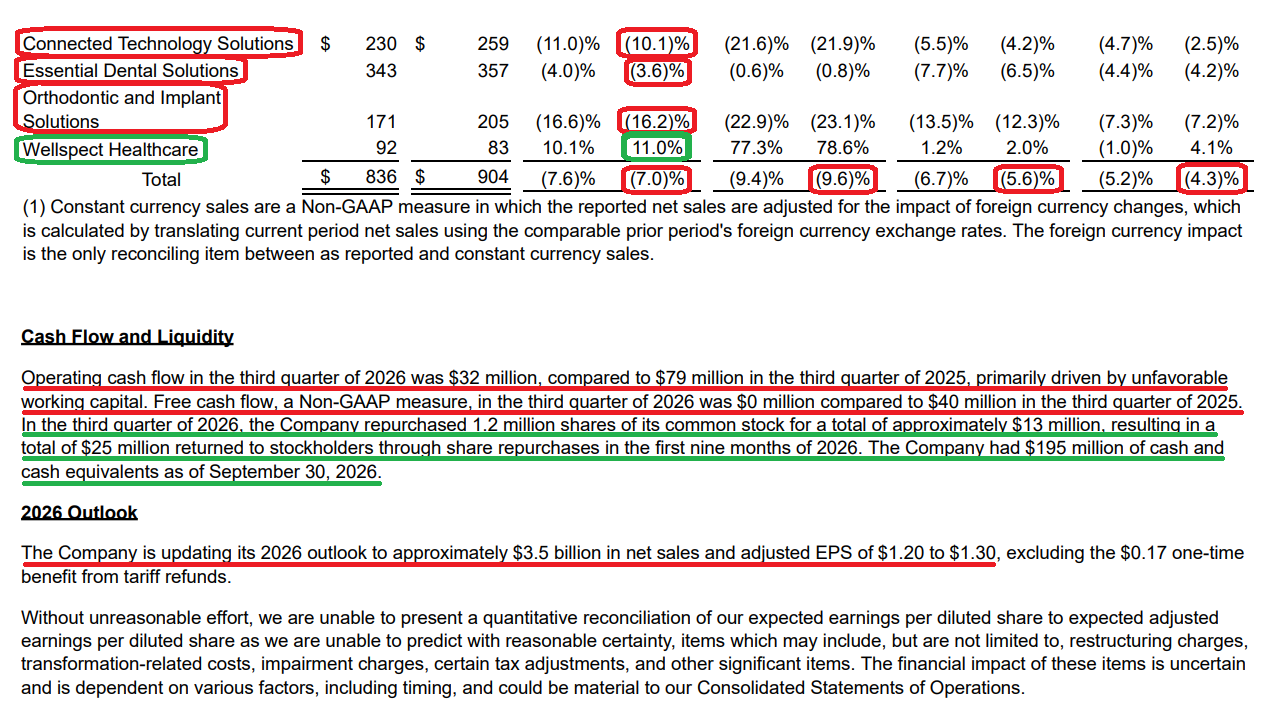
Q3 segments (cc): CTS -10.1% (Americas -21.9%), EDS -3.6% (best of the year), OIS -16.2% (Byte ~6 pts), Wellspect +11.0%
YTD operating cash flow $171M (+27.6% Y/Y), YTD FCF $43M vs. $44M
FY2026 guidance cut: net sales ~$3.5B (from $3.5-3.6B); adj. EPS $1.20-1.30 (from $1.40-1.50), excluding the $0.17 tariff refund but including the ~$0.15 inventory benefit – implies ~$1.10 of operational EPS at the midpoint
EMEA underperformance (Western European dealer destocking) and the Middle East conflict drove ~3/4 of the EPS cut, with an unfavorable tax rate and strategic investments the balance; implied Q4 adj. EPS ~$0.29-0.39 vs. $0.27 last year
FCF recovery expected in FY2026, supported by working capital improvement and a targeted 20% inventory reduction; goal of returning to historical “cash engine” status
Dividend eliminated (~$128M annual cash freed); capital redeployed toward debt repayment and opportunistic buybacks – management calls current prices a “bargain.”
Q3 marked the second consecutive quarter of buybacks – 1.2M shares for ~$13M ($25M YTD), with deleveraging remaining the priority. CEO Dan Scavilla on buybacks: “at this price, I’m anxious to do it because I think it’s going to be a great one to remove.”
Investor Day expected in 2027, to be paired with the strategic plan and the path back to at or above market growth
Trading at ~7.7x forward earnings at the $1.25 guidance midpoint (~8.8x on ~$1.10 operational EPS) and ~0.55x price/sales (cheapest valuation in decades)
Trading at roughly half of top competitor Envista’s ~15.5x forward multiple – a gap we expect to narrow
Cash $195M; total debt ~$2.2B (~$2.0B net); next major maturity not until 2030 ($831M); net leverage 3.4x; ~$1.2B share repurchase authorization remaining
0.3x relative to the S&P 500 (record low) against a long-term ~1.1x premium — more than two standard deviations below average
Record-high ~15.1% short interest
Q3 Commentary
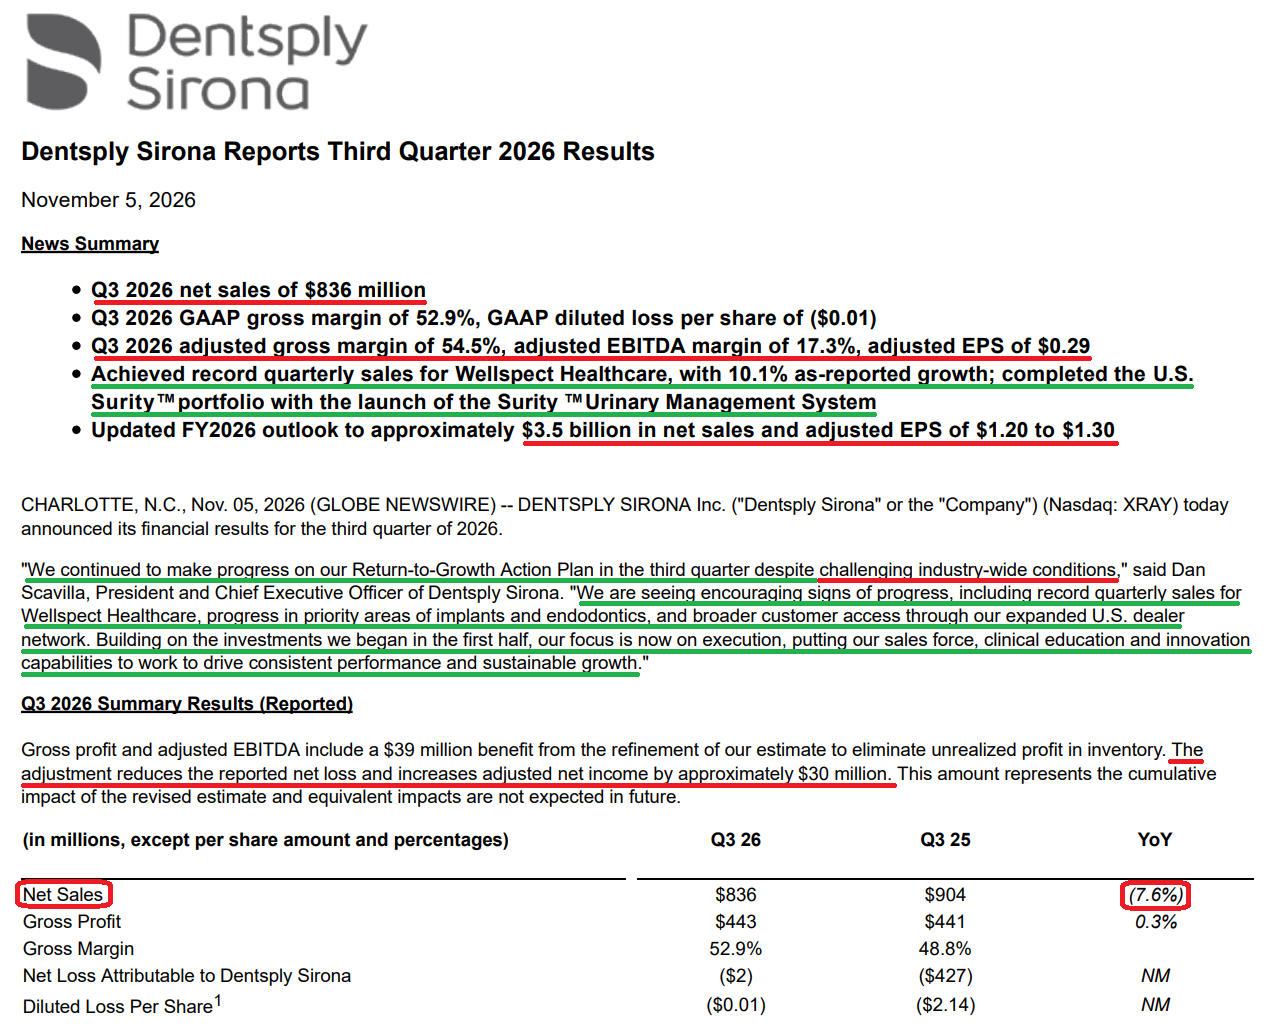
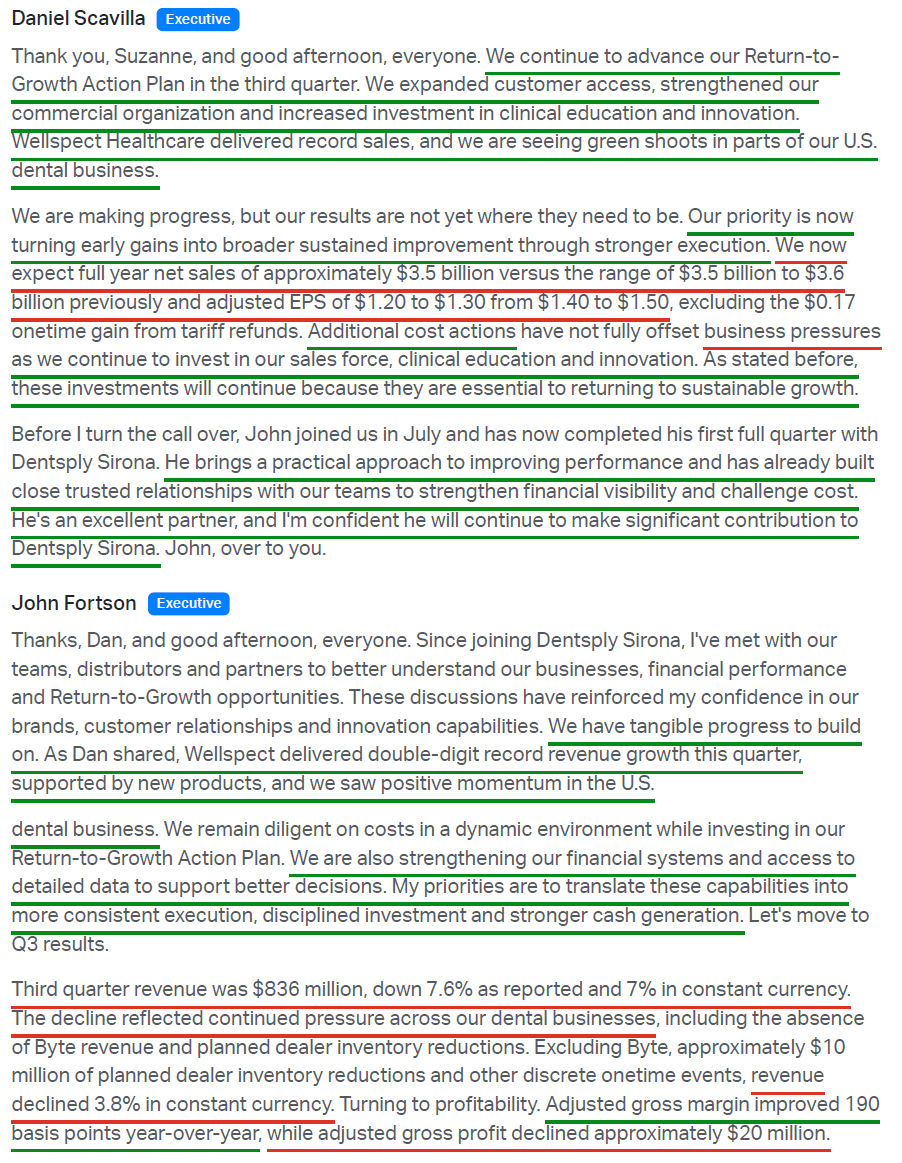
Turnarounds rarely follow a straight line, and Dentsply Sirona’s third quarter was another reminder of that. Revenue fell 7.0% Y/Y C$ to $836M, missing consensus by ~$25M. Adjusted EPS came in at $0.29 versus consensus of ~$0.31, though that figure included a one-time $39M pre-tax benefit (~$30M after tax, or ~$0.15 per share) from an inventory accounting adjustment tied to prior years. Backing out the benefit leaves adjusted EPS at just ~$0.14. The softer results led management to lower its full-year outlook, cutting adjusted EPS guidance to $1.20-1.30 from $1.40-1.50, or ~$1.10 at the midpoint on an operational basis.
Those are not the numbers anyone wanted to see, though a stock down ~84% from its prior highs was never priced for perfection to begin with. Roughly three-quarters of the guidance cut traced to EMEA underperformance and the impact of the conflict in the Middle East. In Western Europe, dealers have continued to destock, a trend Scavilla expects to reverse over time. Meanwhile, the Middle East conflict has driven higher freight costs and uncertainty, leading some practices to defer equipment purchases. An unfavorable tax rate and continued strategic investment made up the balance.
The reported 7.0% top-line decline was also weighed down by a handful of one-time headwinds. Byte, the DTC aligner business that XRAY suspended, still accounted for ~6 points of the decline in the OIS segment, a headwind that is finally set to lap by Q1 2027. The other came from one of Scavilla’s first moves as CEO: shifting to a drop-ship model in the U.S., under which XRAY ships equipment directly to practices rather than having dealers hold inventory. The new model simplifies the relationship for distributors while giving XRAY better visibility into true end market demand, though the transition temporarily weighs on results as dealers sell down existing inventory rather than reorder.
As a result, distributor-held CAD/CAM inventory fell ~$9M during the quarter, compared to a ~$20M build in the same period last year. With channel inventory now below historical averages and the transition set to wrap up in Q4, that drag is also nearly behind the company. Excluding the impact of Byte, ~$10M of planned dealer inventory reductions and other one-time items, the revenue decline narrows to 3.8% C$, roughly in line with the prior quarter.
Setting those one-off items aside, the turnaround ultimately comes down to getting the U.S. business back on track. Accounting for roughly a third of sales, the U.S. business declined 6.2% in FY24 and another 12.3% in FY25, with the Americas still down 10.6% YTD C$. Reversing that trend has been management’s top priority since day one, so the fact that U.S. performance landed in line with internal expectations this quarter was encouraging.
The broader market hasn’t made the job any easier. The ADA’s latest survey showed dentist confidence taking a dive in Q3 after improving through the first half of the year, with consumer dental spending down 2.4% YTD. Over the past decade, consumer spending on dental services has grown just 20%, compared to 43% for health care overall.
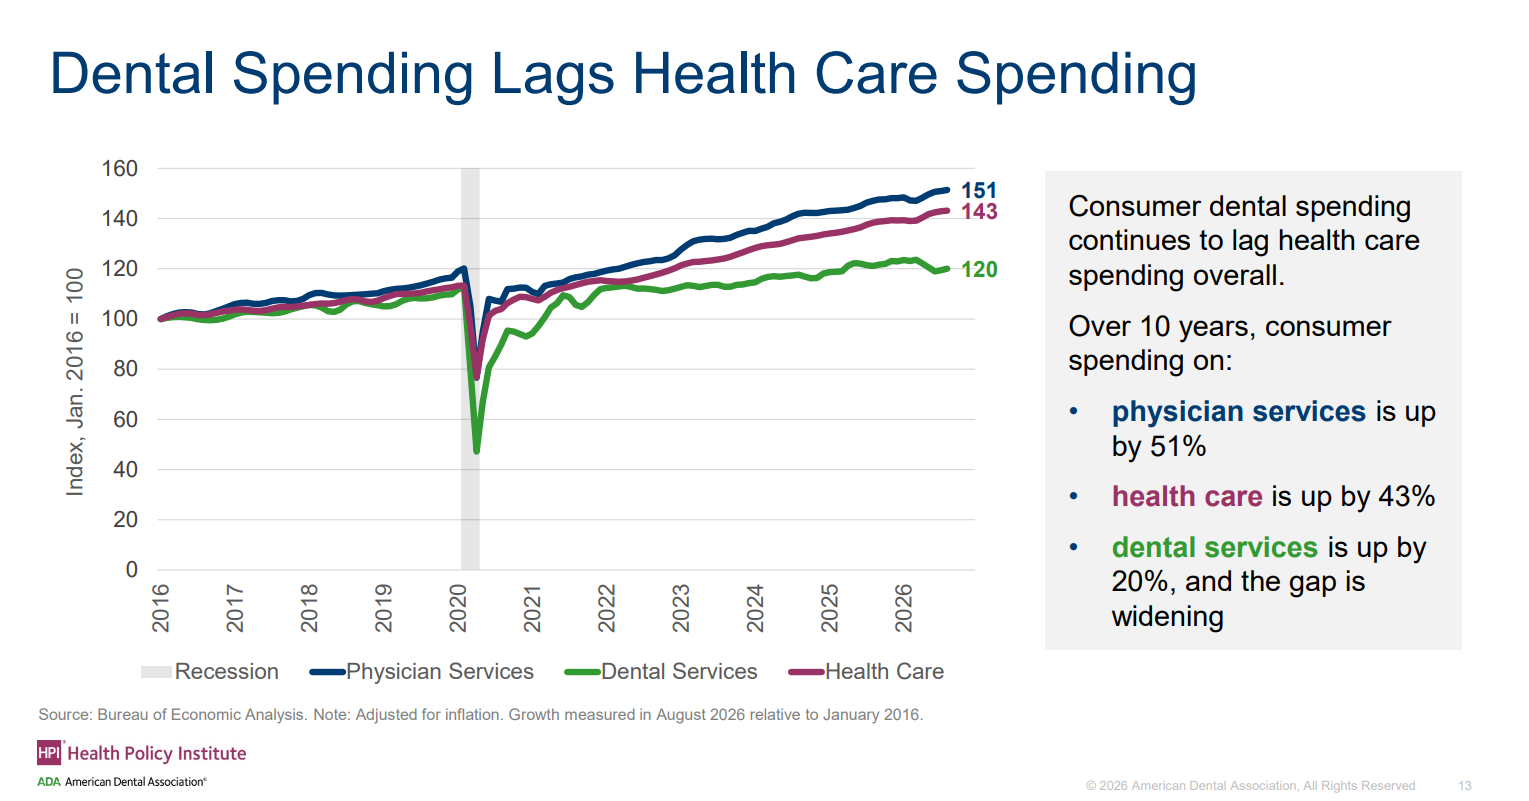
The good news is that deferred dental work doesn’t simply disappear. A skipped filling becomes a crown, which eventually becomes an implant, with the bill only getting larger the longer treatment is put off. That leaves a growing pool of pent-up demand in a market that has consistently outgrown the broader economy, supported by an aging population, rising aesthetic demand and a shift toward preventive care.
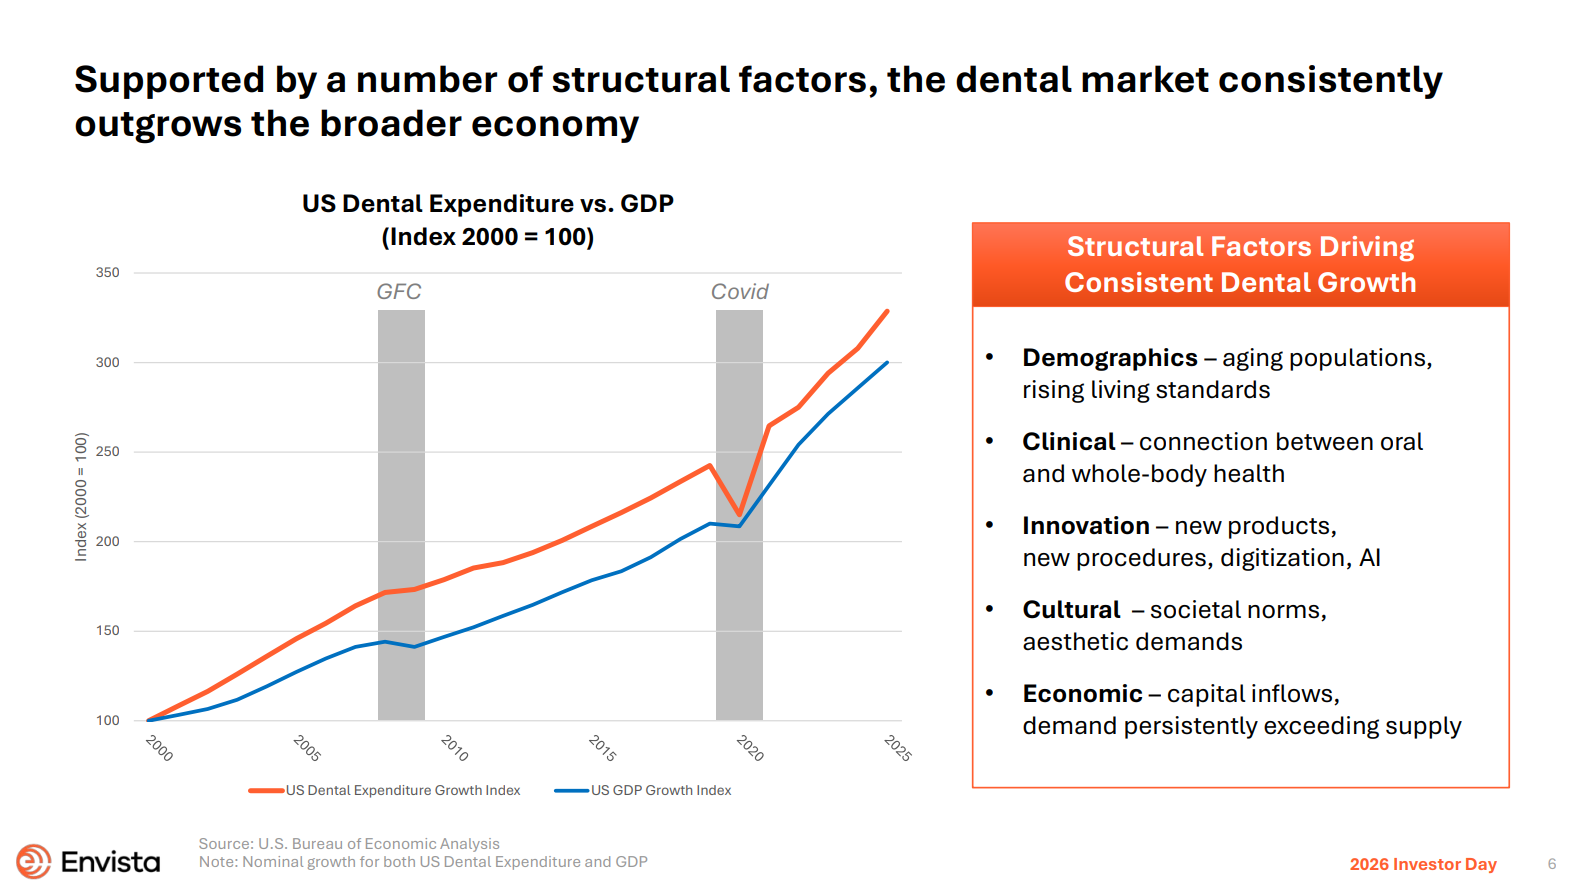
While a recovery in the broader market would certainly help, management has been clear that the plan doesn’t depend on one, with guidance assuming no improvement in underlying market conditions. The biggest opportunities sit within XRAY’s own control, many of them simply undoing missteps made under prior leadership. Against that backdrop, Scavilla is sticking with his target of a first positive U.S. print in Q4. While he acknowledged that it’s a stretch, he was equally clear that if it doesn’t happen in the fourth quarter, it will come in the first. The third quarter offered some early evidence to support that confidence, with green shoots beginning to emerge across the U.S. business.
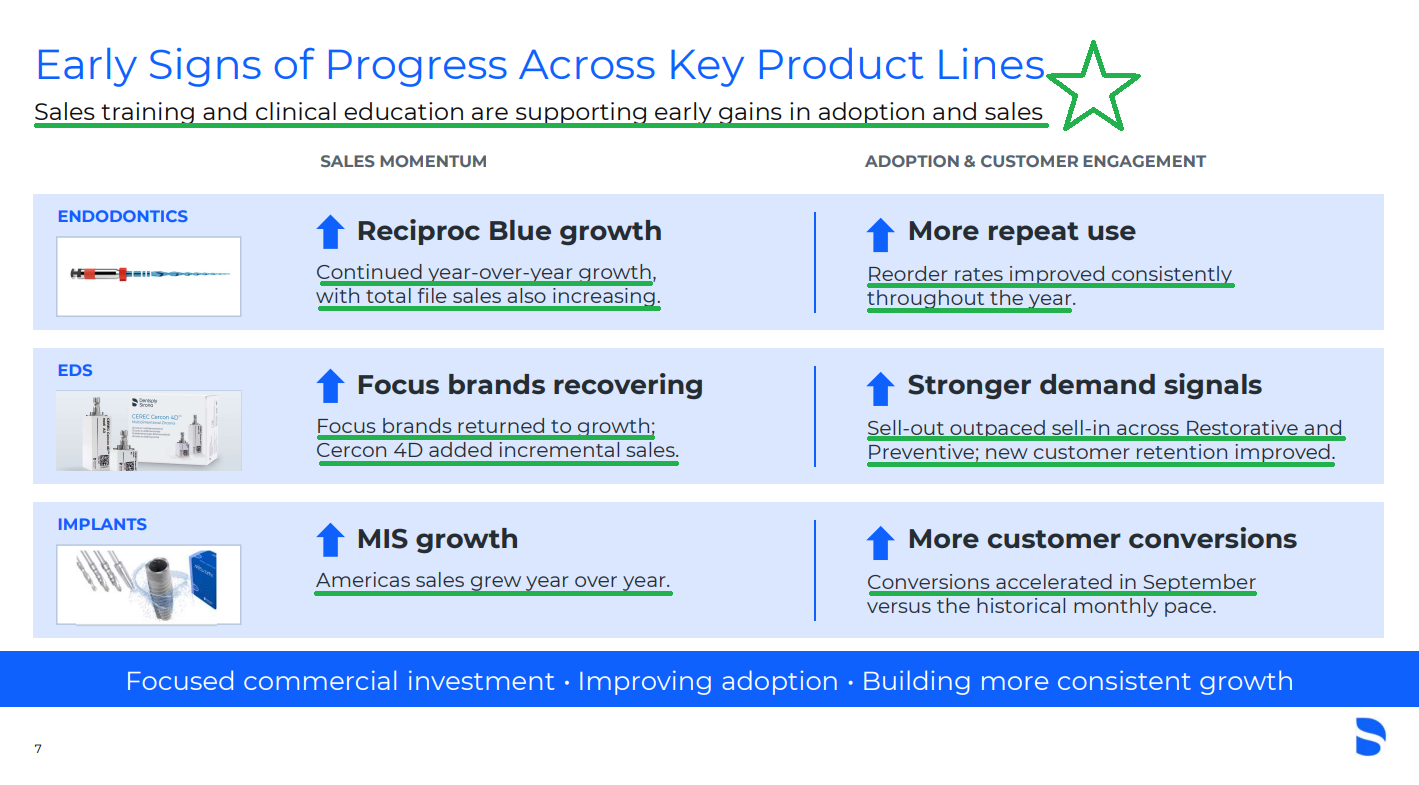
Those green shoots were most visible in Essential Dental Solutions, where Americas sales were nearly flat at -0.8% C$, a solid improvement from -3.0% in Q2. U.S. Endodontics returned to growth (+4%) for the first time since Q2 2025, driven by strong file and restorative block volumes. Meanwhile, dentist purchases of Restorative and Preventive products outpaced XRAY’s shipments to dealers, suggesting underlying demand is beginning to turn ahead of reported sales.
The timing is no coincidence. A key part of the turnaround has been restoring investment in clinical education after prior management cut back to protect margins, undercutting an important driver of product adoption in a business where dentists tend to stick with what they know. Scavilla has reversed course, increasing North American clinical education investment 6x Y/Y in the second half, including more than 160 hands-on Endo courses. That investment is being directed toward some of the strongest franchises in dentistry, with XRAY holding the #1 position in endodontics and preventive care and #2 in restorative.
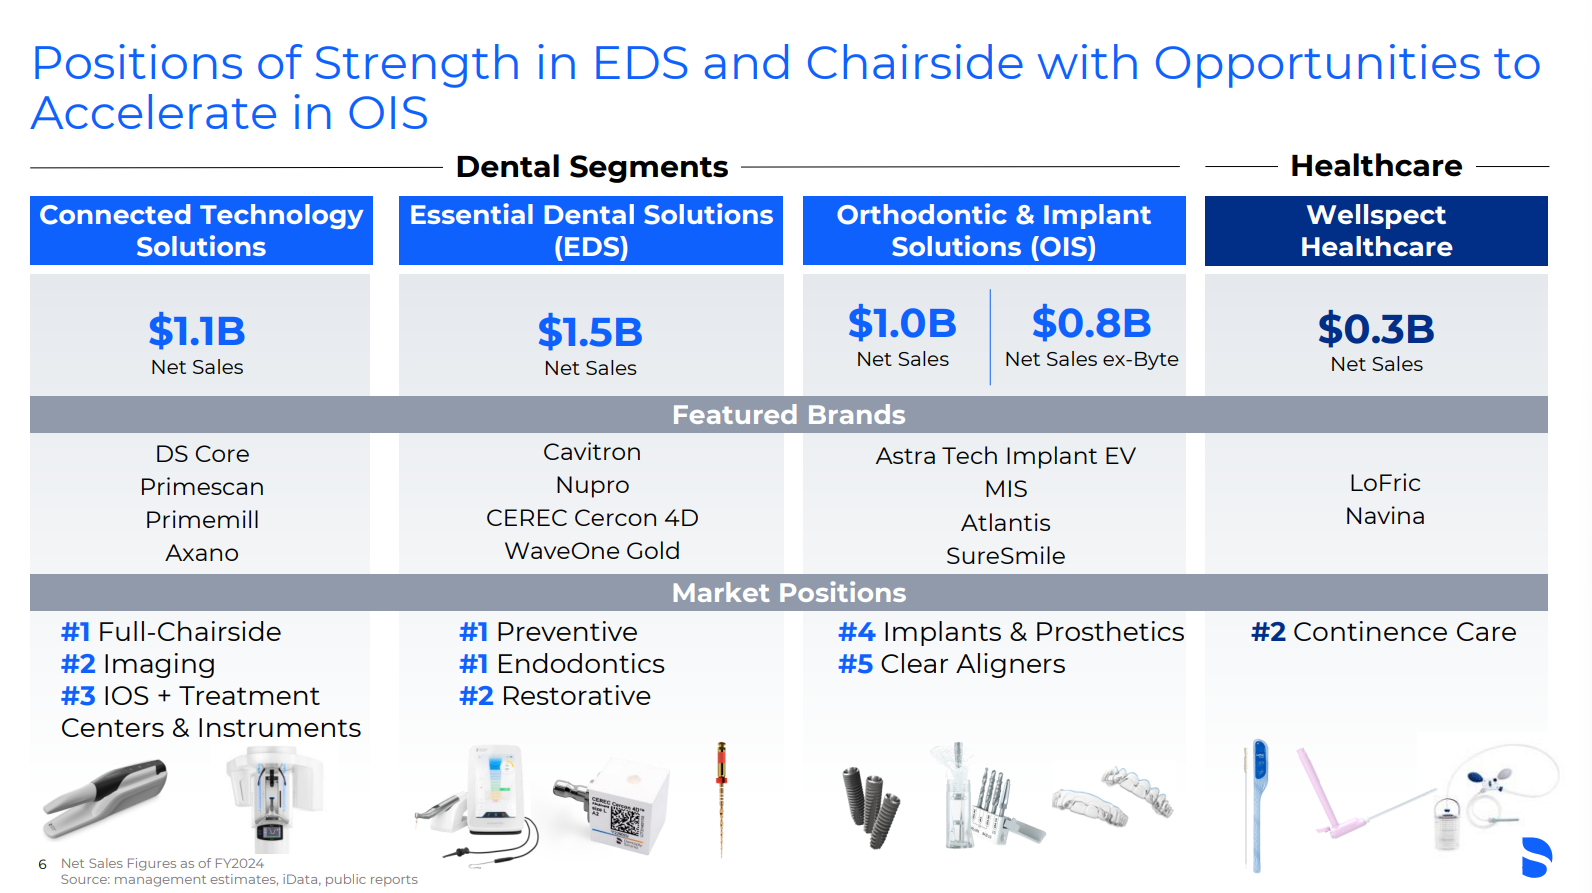
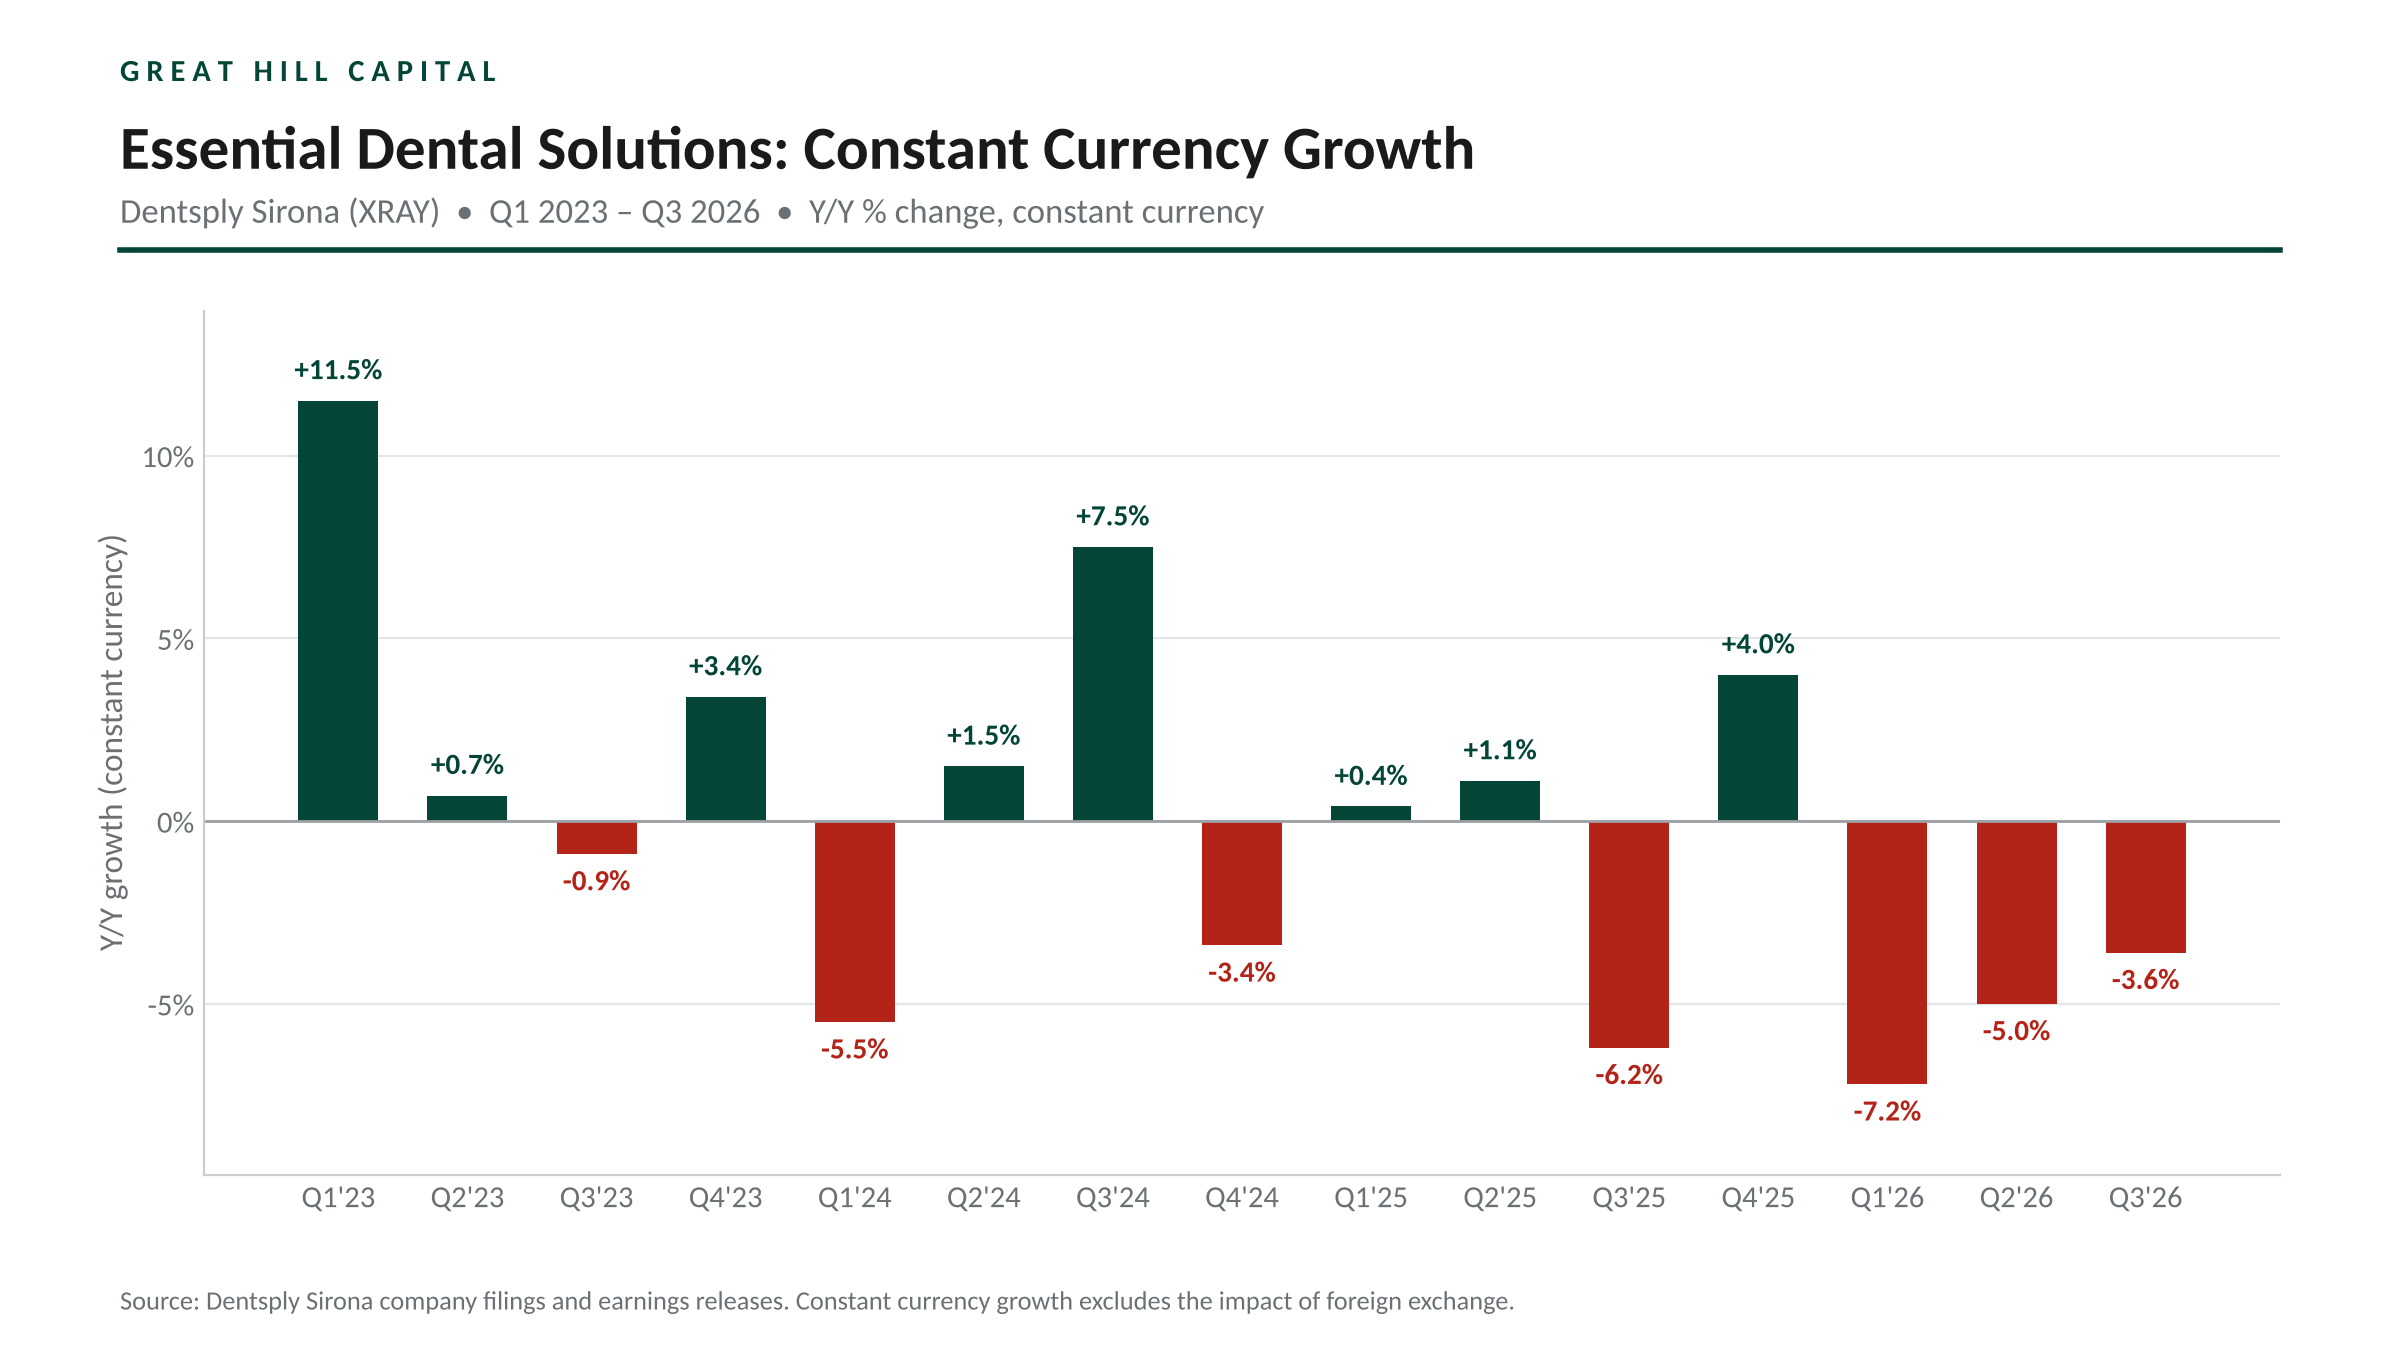
The focus on EDS is an obvious one, as it serves as the profit engine of the entire business, accounting for ~41% of sales and ~83% of segment adjusted operating income YTD. U.S. strength, alongside double-digit Preventive growth in EMEA and APAC, helped EDS post a 3.6% C$ decline, its second straight quarter of sequential improvement after declines of 7.2% in Q1 and 5.0% in Q2.
Connected Technology Solutions, home to XRAY’s highest-ticket equipment and ~27% of sales, is where the pressure was heaviest. Segment revenue declined 10.1% C$, with the Americas down 21.9%, as a good portion of the decline reflected dealer inventory reductions tied to the drop-ship transition. At the center of the segment is CEREC, XRAY’s flagship system for single-visit dentistry. XRAY is the #1 player in chairside dentistry and #2 in imaging, though that leadership comes with exposure to the most premium, elective and rate-sensitive corner of the market, as dentists typically finance purchases that can run well into six figures. Weakness in capital spending is being felt across the industry, with peers reporting similar softness, though XRAY has self-help levers of its own to pull here as well.
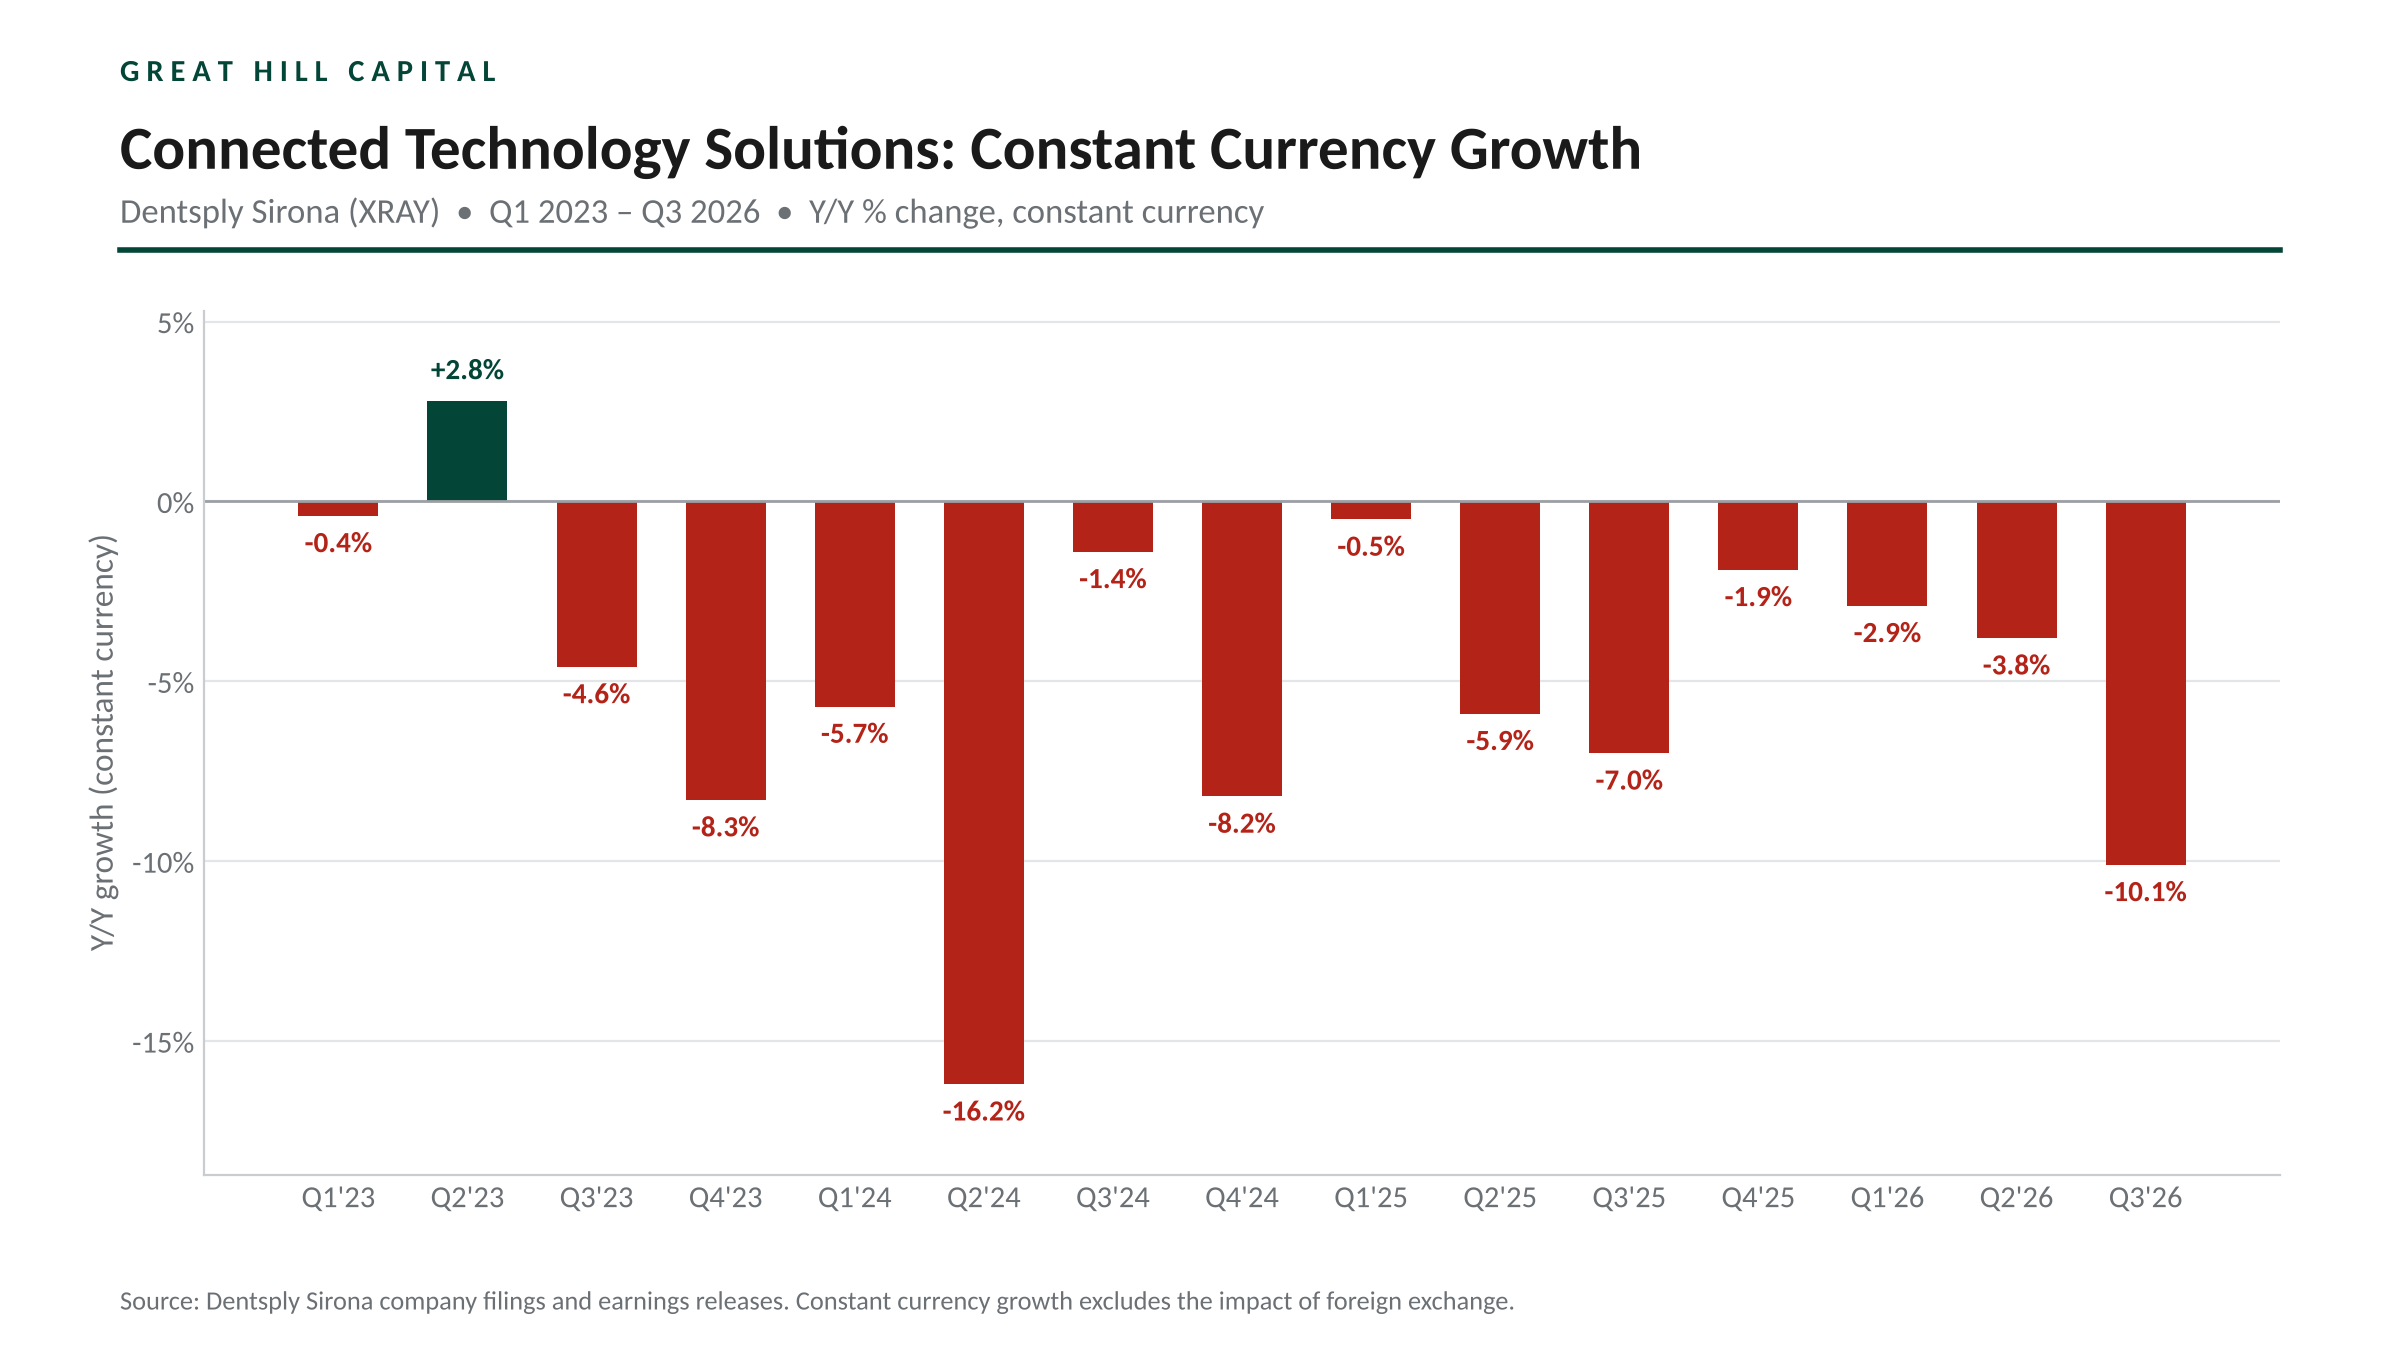
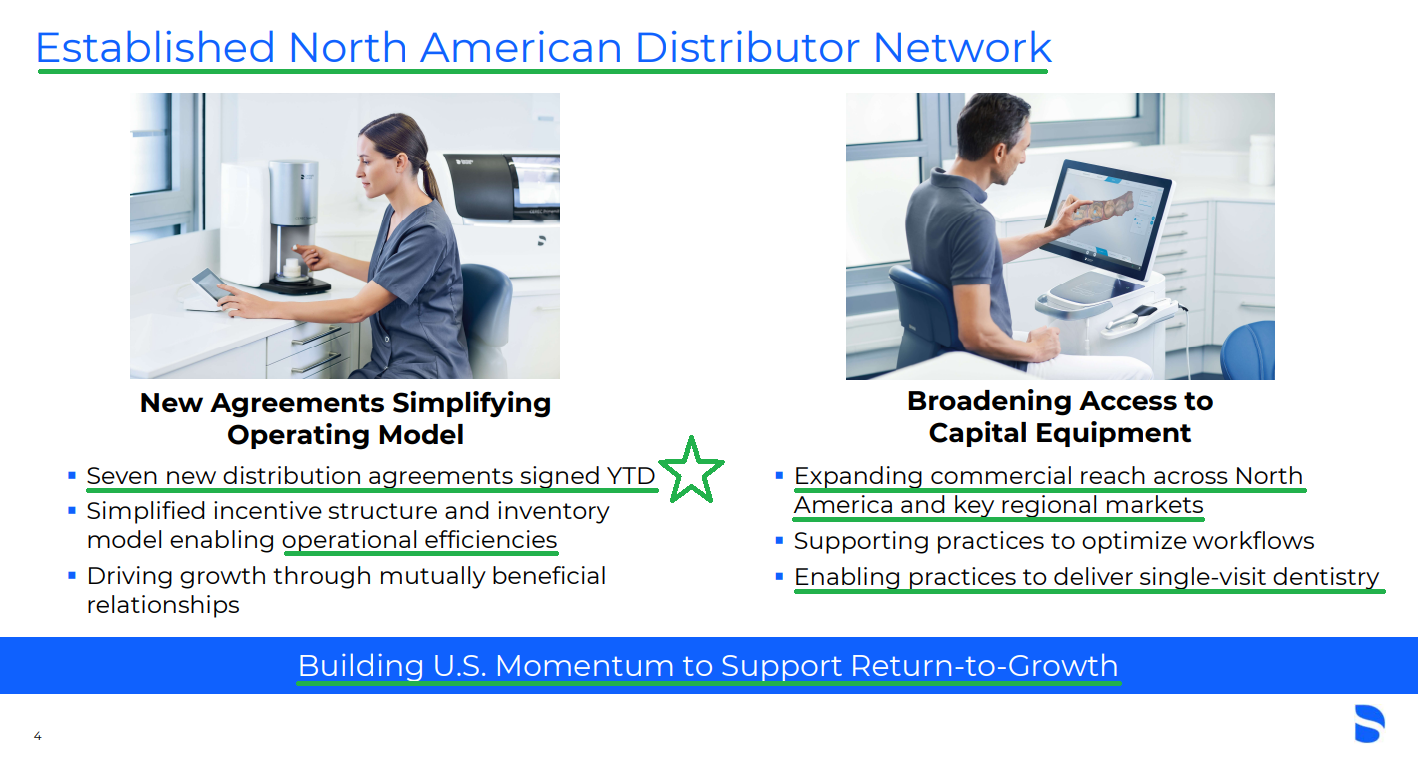
The most important of those is the distribution network. Chasing higher DTC margins, prior management made the costly decision to sever ties with key dealers, cutting XRAY off from one of its most important channels for driving equipment sales. Scavilla has spent the past year repairing that damage, with XRAY signing seven distribution agreements this year, most of which give dealers already carrying its consumables access to its full technology portfolio. With the North American expansion largely complete, the focus has shifted to activating the network through training, joint customer visits, demonstrations and installation support. Given that new dealers typically take ~9 months to begin driving capital sales, the bulk of the payoff should come through 2027.
Where CTS is largely a cyclical story with a channel transition layered on top, the implant business is all about winning back share. Implants and Prosthetics makes up the bulk of OIS, accounting for ~78% of segment sales YTD. Revenue fell 13.2% Y/Y (reported) to $132M in Q3, driven by lower premium implant volumes across all regions. XRAY ranks #4 in implants behind market leader Straumann (#1, with ~30% share), with premium products making up ~80% of its implant portfolio and representing the part of the business that has been losing ground. Scavilla has been candid about the cause, admitting that XRAY’s reps were under-invested and under-trained while pointing to Straumann as the standard he wants to match.
For a sense of what fixing that looks like, look no further than Envista (NVST), XRAY’s closest competitor. By 2023, NVST’s implant business had slipped into decline as its premium franchise lost share following years of underinvestment in sales coverage, clinical education and R&D in favor of protecting margins. New management took over in 2024 and committed ~$25M annually to improving sales coverage, clinical education and innovation, lifting R&D from ~3.7% of sales to ~4.2% while training 10x more clinicians in 2025 than in 2023. The payoff came within ~4-6 quarters, with implants returning to ~flat in 2024 before accelerating in 2025 to their fastest growth since 2022. That momentum has continued to build through 2026.
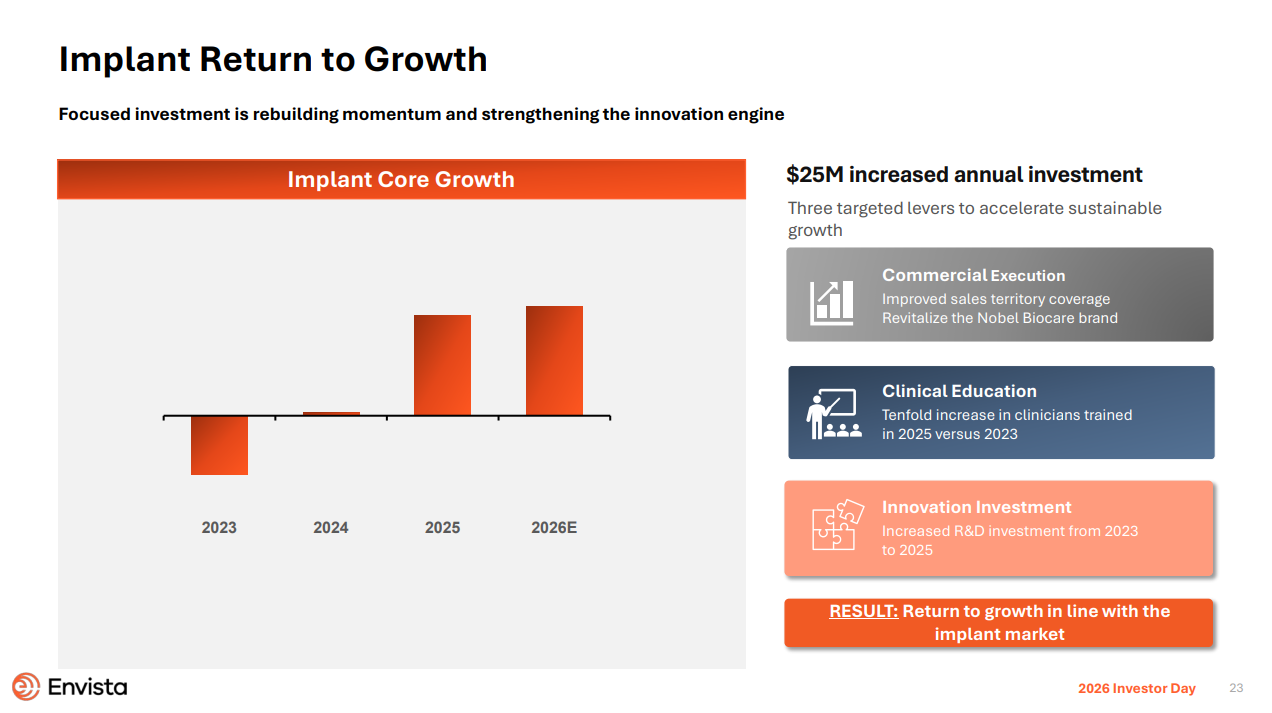
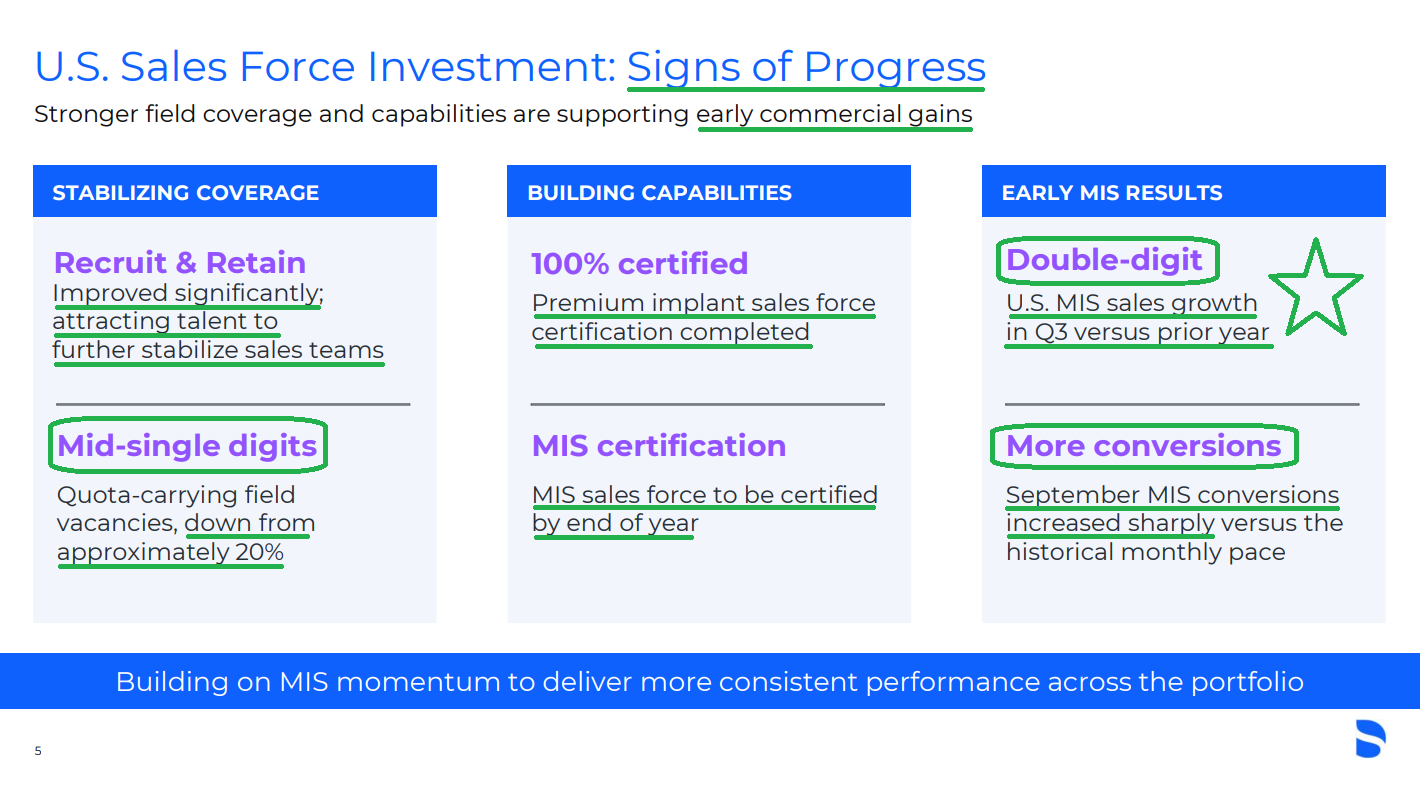
The parallels to what XRAY is doing are hard to miss. Management has increased R&D spending to $42M in Q3, or 5.0% of sales versus 4.1% in Q3 2025, with spending up ~20% YTD and targeted to reach 5-6% of sales over the course of the plan. On the sales coverage front, the share of U.S. territories without a rep has fallen to the mid-single digits from more than 20%, voluntary rep attrition is down substantially and every premium implant rep has completed certification, with the MIS team set to follow by year-end. XRAY is also leaning heavily into clinical education, with implant education engagement up more than 60%.
The strategy is already delivering in the faster-growing value segment. MIS, XRAY’s value implant brand, grew low double digits in the U.S. as customer conversions accelerated sharply in September, while overall U.S. value implant sales increased at a high-single-digit pace. Management is now nearly doubling the MIS sales force by year-end to build on that momentum. If XRAY follows a similar path to NVST, premium implants could stabilize around mid-to-late 2027, adding another leg to the U.S. recovery just as the distribution deals hit their stride.
All of this takes time, which is where Wellspect, XRAY’s wholly owned subsidiary and a leader in bladder and bowel management, comes in. While the dental business works through its recovery, Wellspect continues to fire on all cylinders, posting record Q3 revenue of $92M, up 11.0% C$, with growth in every region. The Americas jumped 78.6% following the completion of the U.S. rollout of Surity in August, which was granted traditional Medicare coverage in October. That coverage widens access just as the launch gains traction in a ~$7B urinary management market. Management increased investment in the business 15% Y/Y to capture that opportunity while still delivering healthy segment margins of ~27% in Q3.
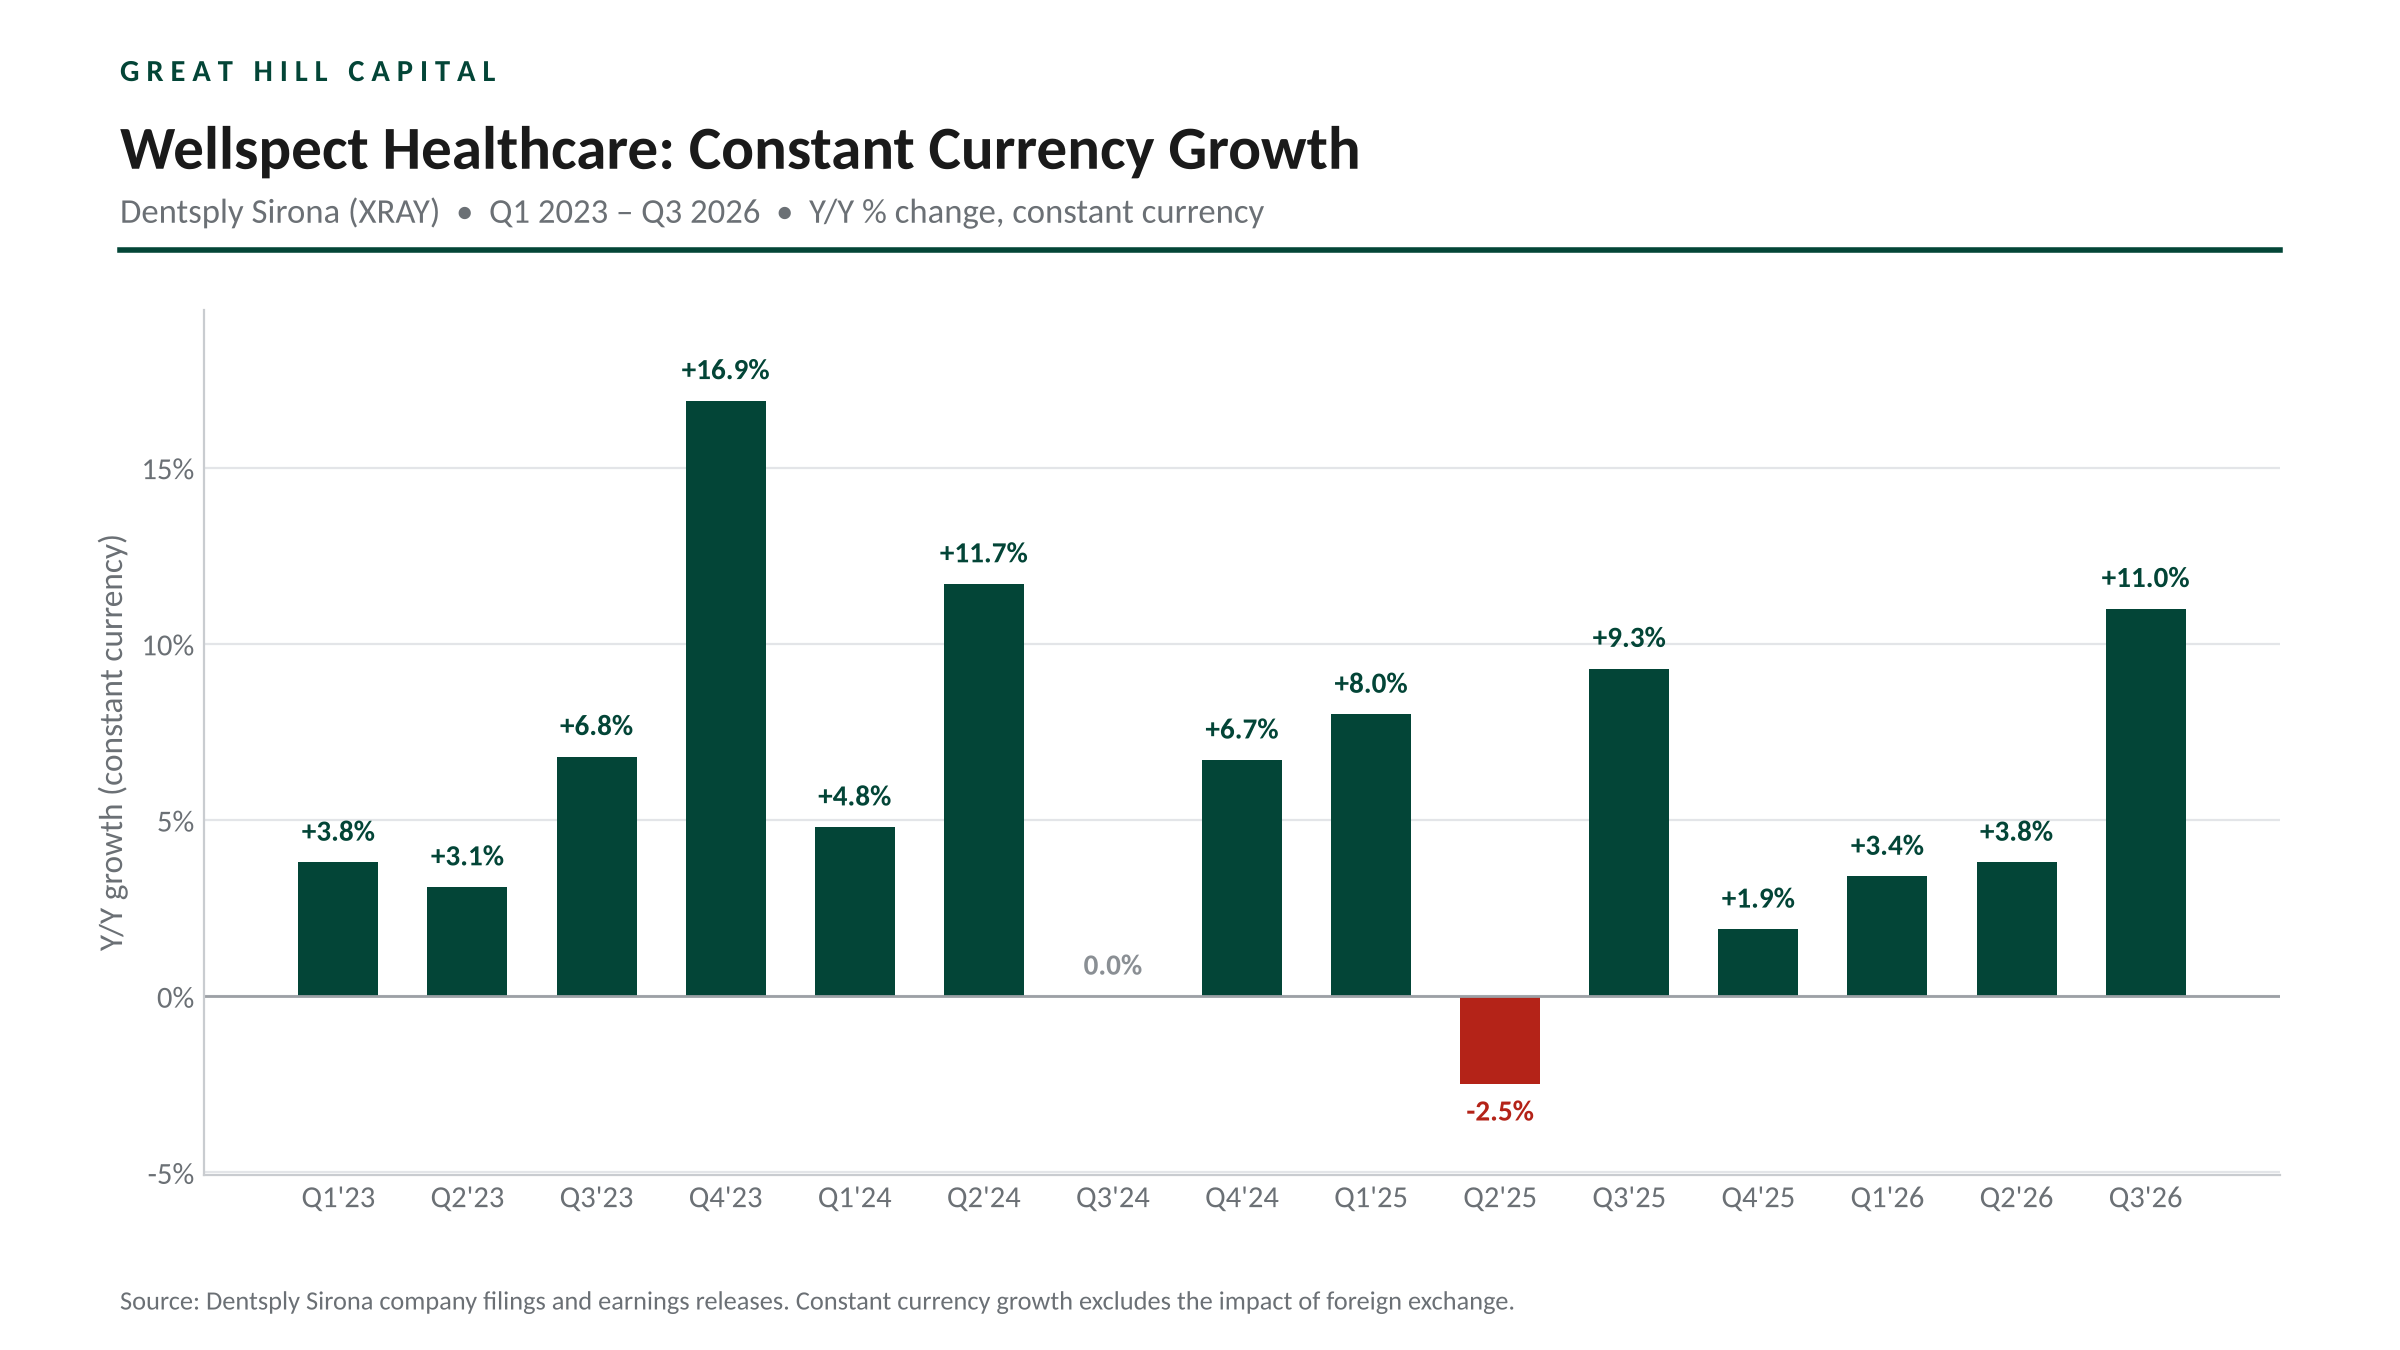
Wellspect today is a meaningfully larger, faster-growing business than the one that reportedly attracted ~$1B bids in 2023, when it generated $288M of revenue and $87M of segment profit. XRAY elected to hold onto the business following a strategic review, with management citing upcoming launches and untapped market opportunities. Surity is a case in point, with the U.S. rollout expected to drive further segment growth into 2027 as the launch scales. Today, that ~$1B figure alone equals more than half of XRAY’s ~$1.9B market cap. We have long said we love investments with multiple outs, and Wellspect is a prime example. It helps fund the dental turnaround and buys management time to stabilize the core, while preserving the option to monetize the business down the road should the right deal come along.
A potential Wellspect sale could provide another avenue to accelerate debt reduction, which remains XRAY’s top capital allocation priority. Net debt stands at ~$2.0B, with leverage at 3.4x, though the company is not boxed in by near-term maturities, with the next major maturity not arriving until 2030 at $831M. Debt reduction is being aided by the ~$128M in annual cash freed up by last year’s dividend elimination, while working capital improvements remain the key lever in restoring XRAY’s historical status as a cash engine.
Meanwhile, the market continues to price XRAY like it is being taken out on a stretcher. At ~7.7x the midpoint of its reduced guidance and ~8.8x on an operational basis, XRAY trades at roughly half of Envista’s ~15.5x forward multiple, while short interest has climbed to a record 15.1%.
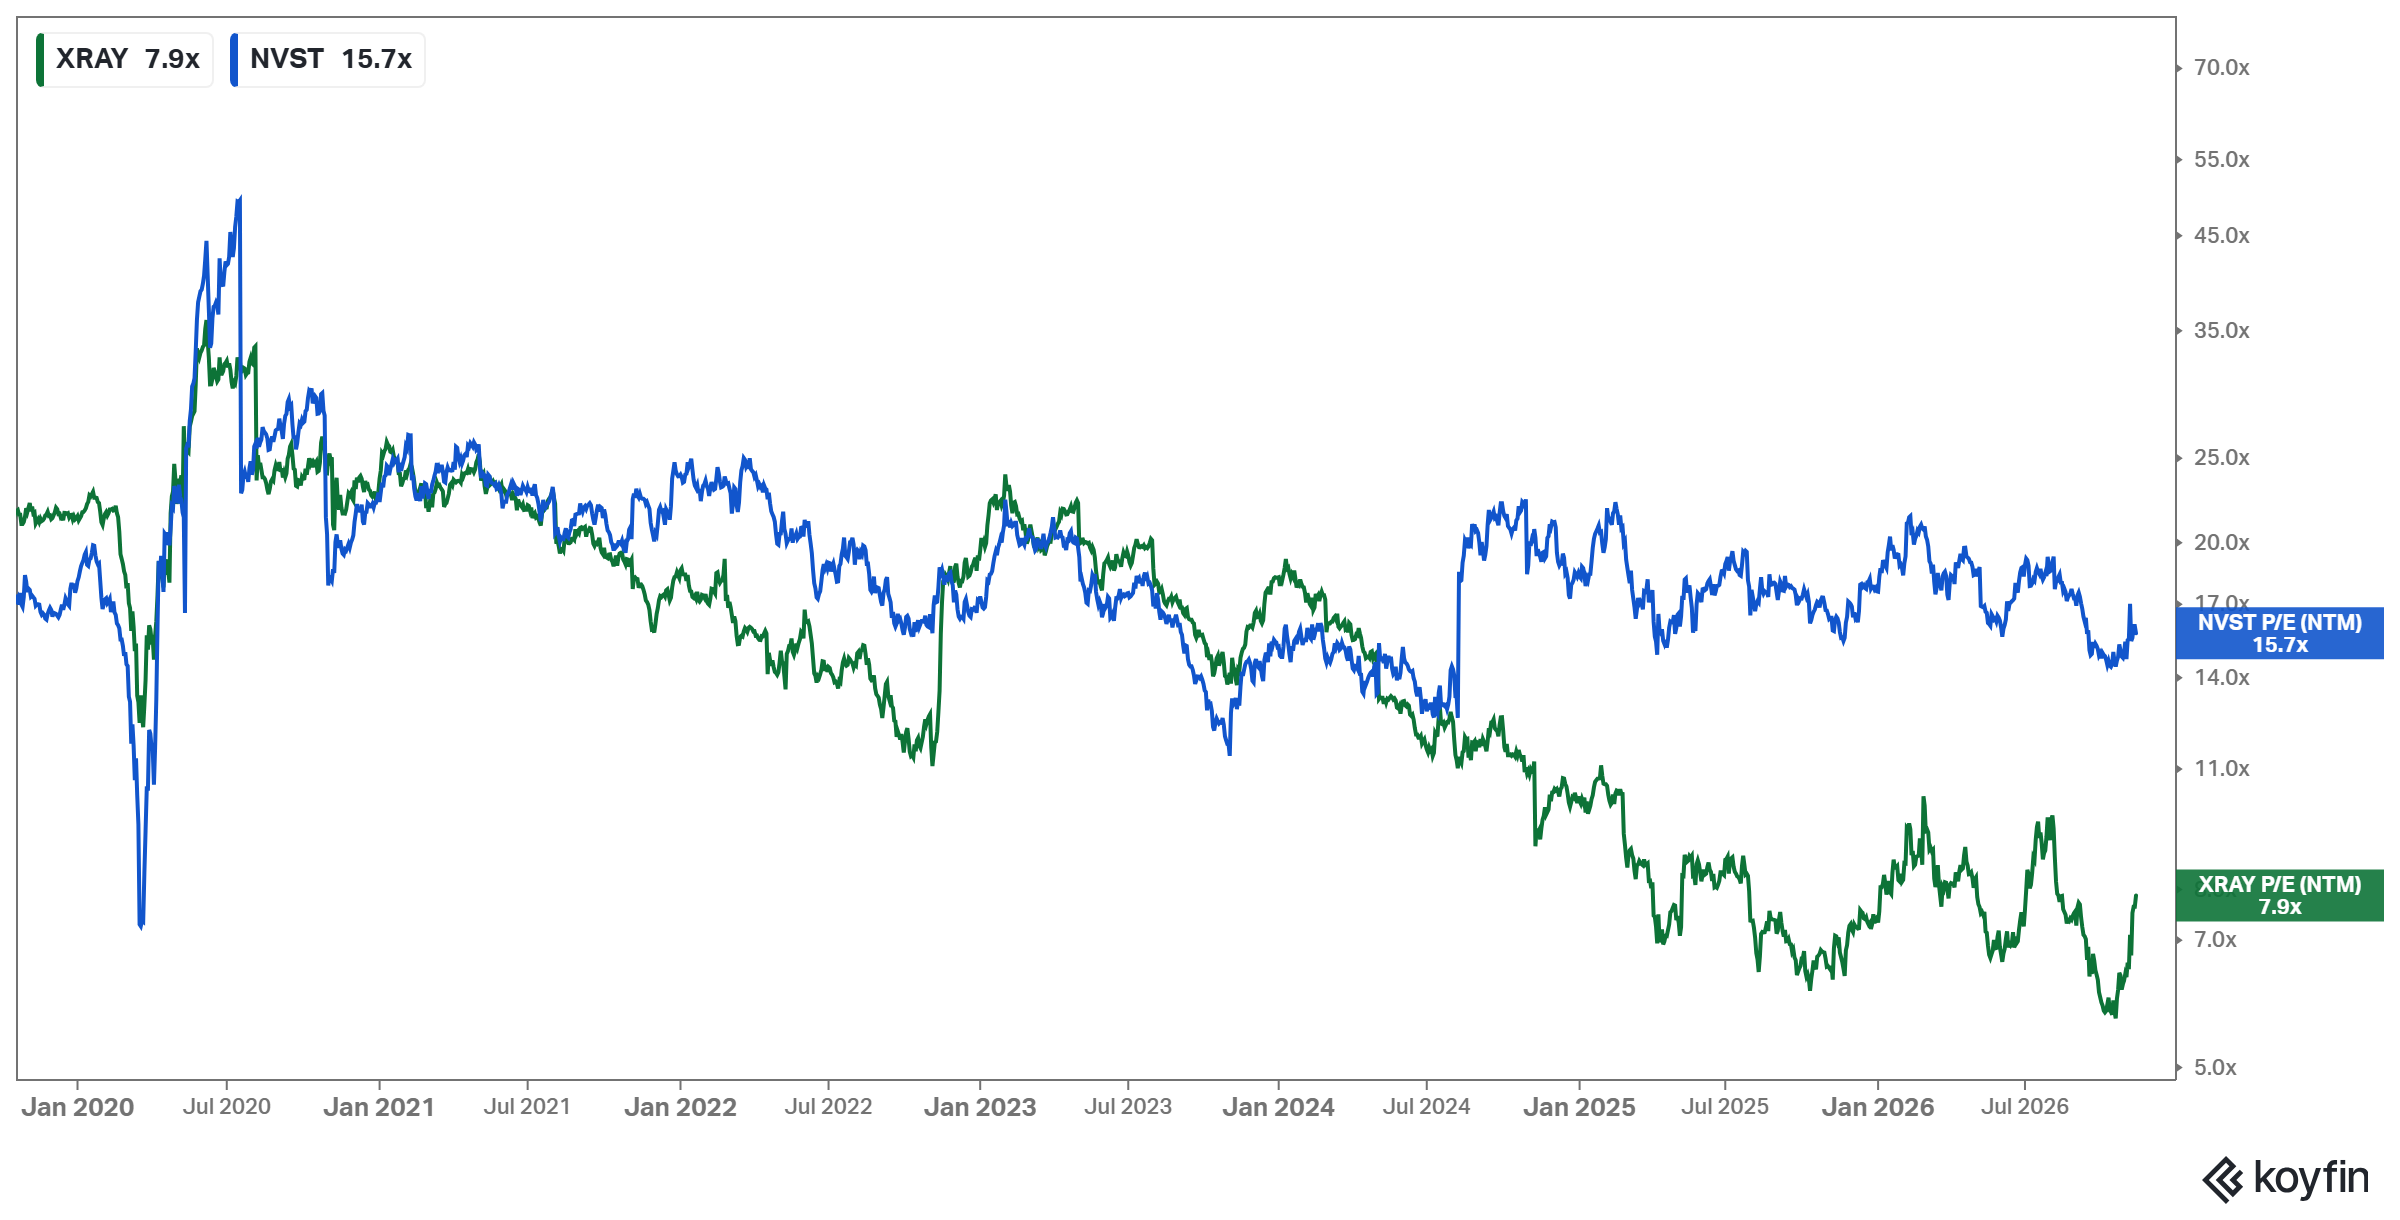
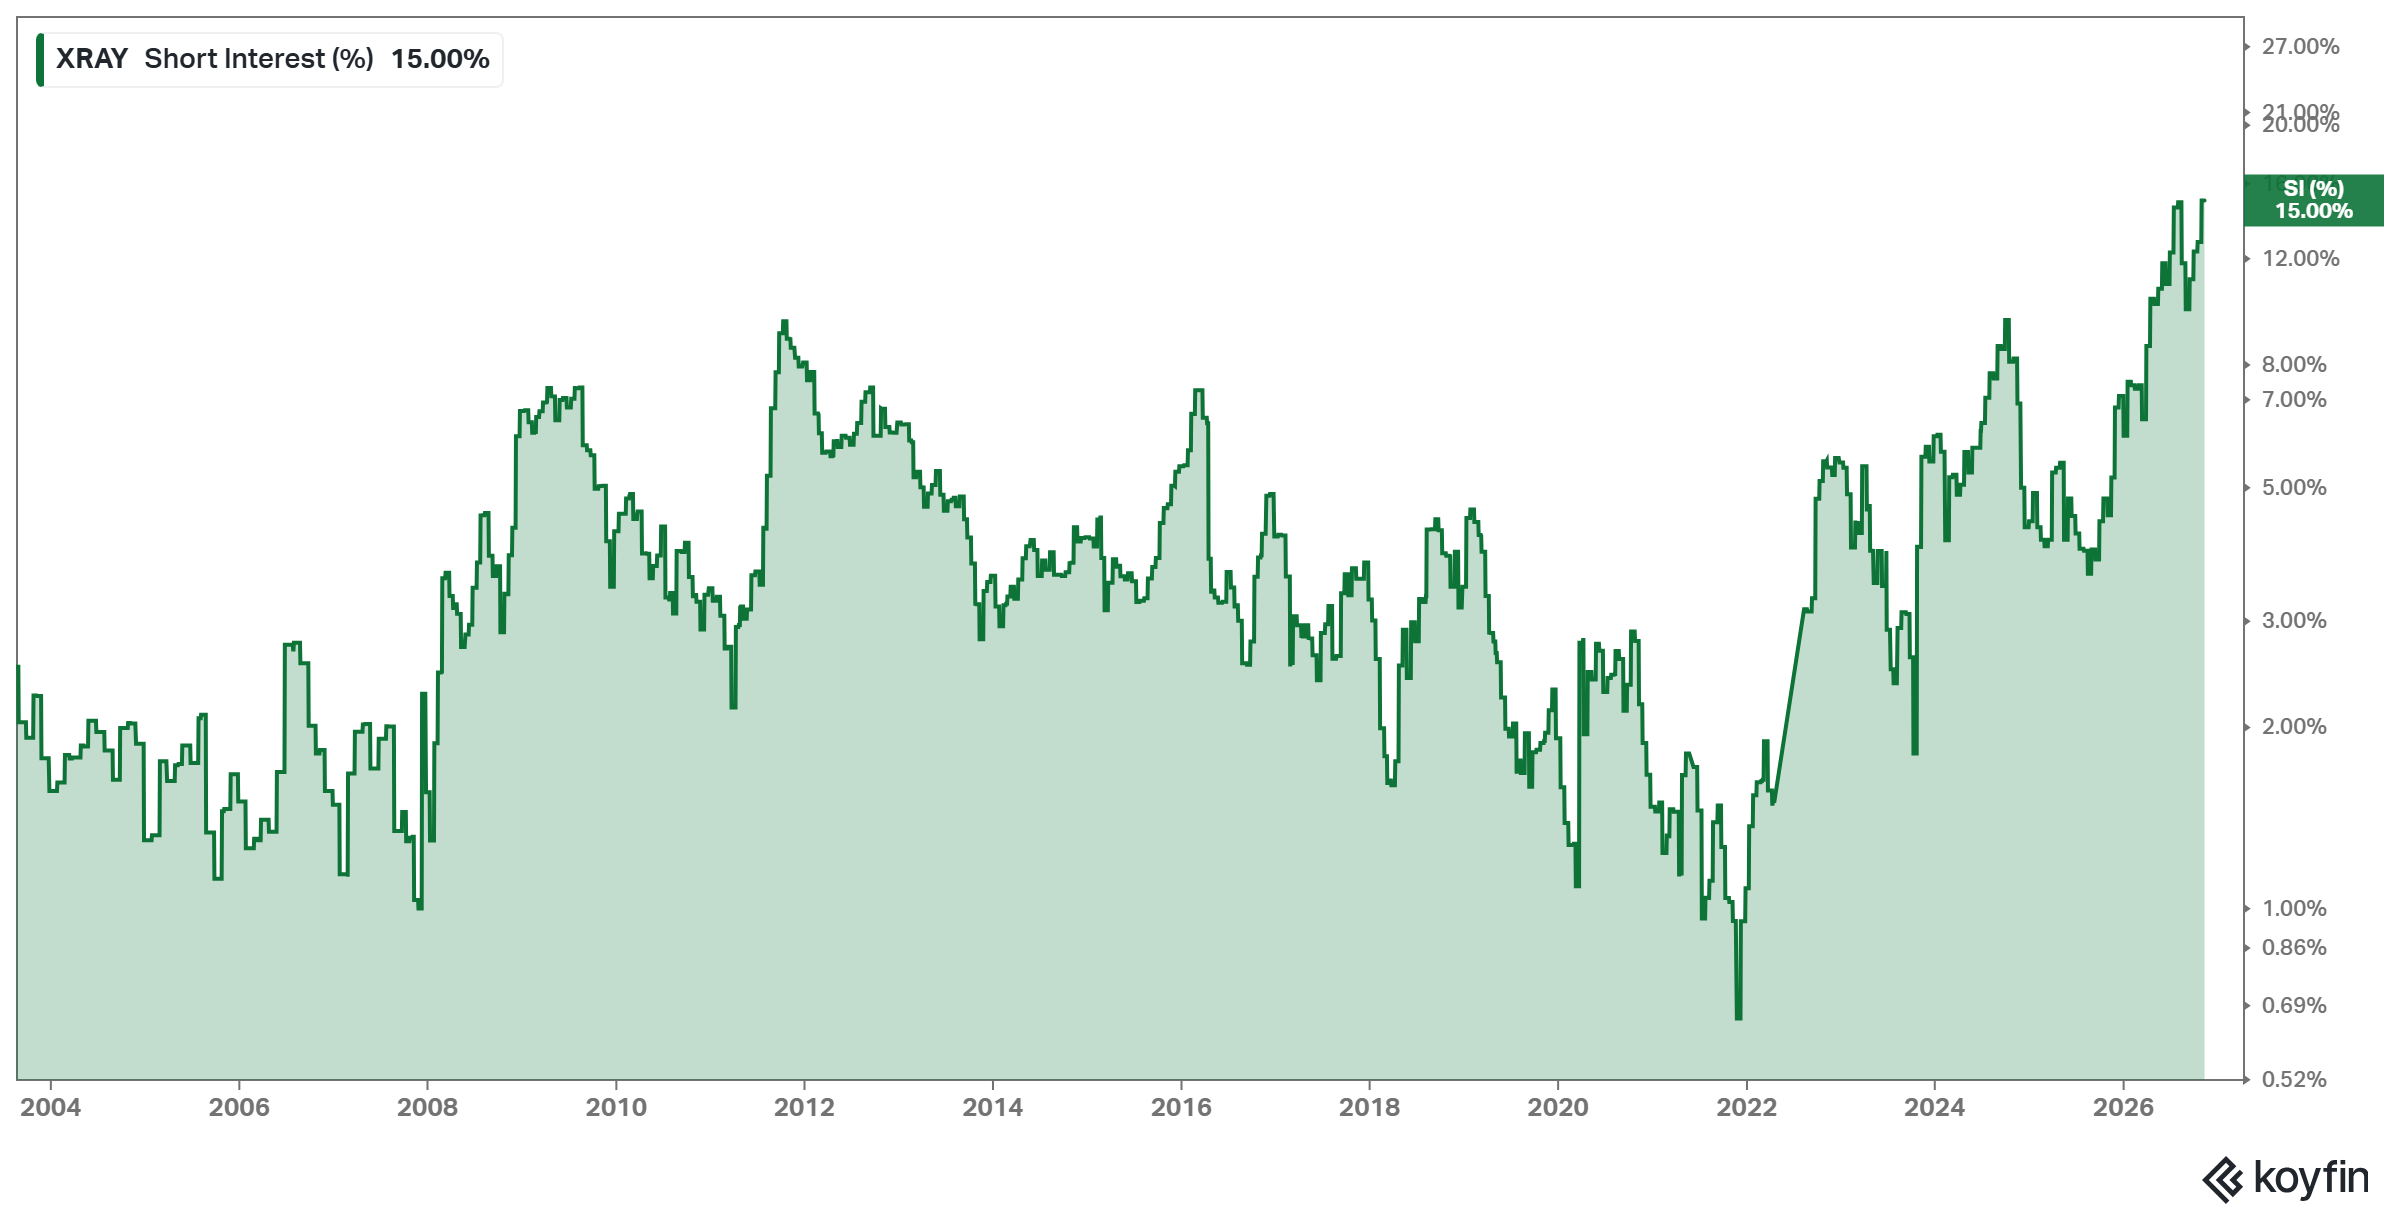
The reset to ~$1.10 of operational EPS sets a low bar, leaving plenty of room for upside surprises as the self-help levers begin to kick in. Looking ahead, Scavilla described the next chapters of the Return-to-Growth plan as “fairly significant in what we plan to do,” with an Investor Day likely in 2027. With a proven operator at the helm, multiple self-help levers to pull and Wellspect protecting the downside, we believe the best is still ahead for XRAY.
Q3 Earnings Breakdown
10 Key Points
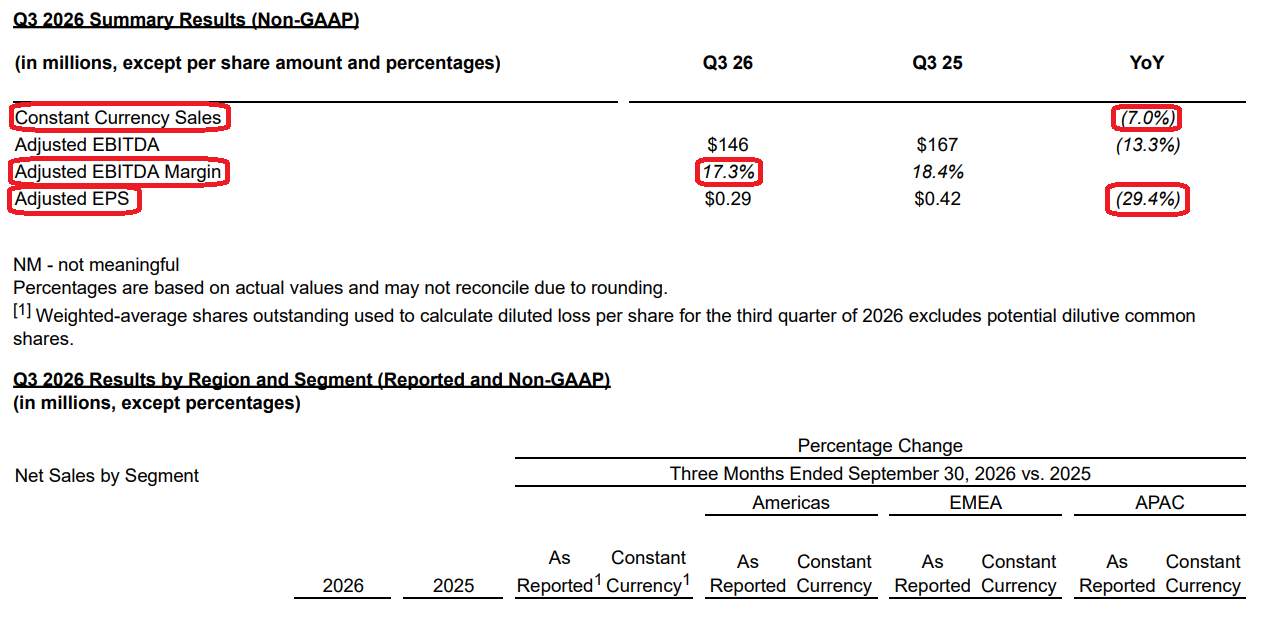
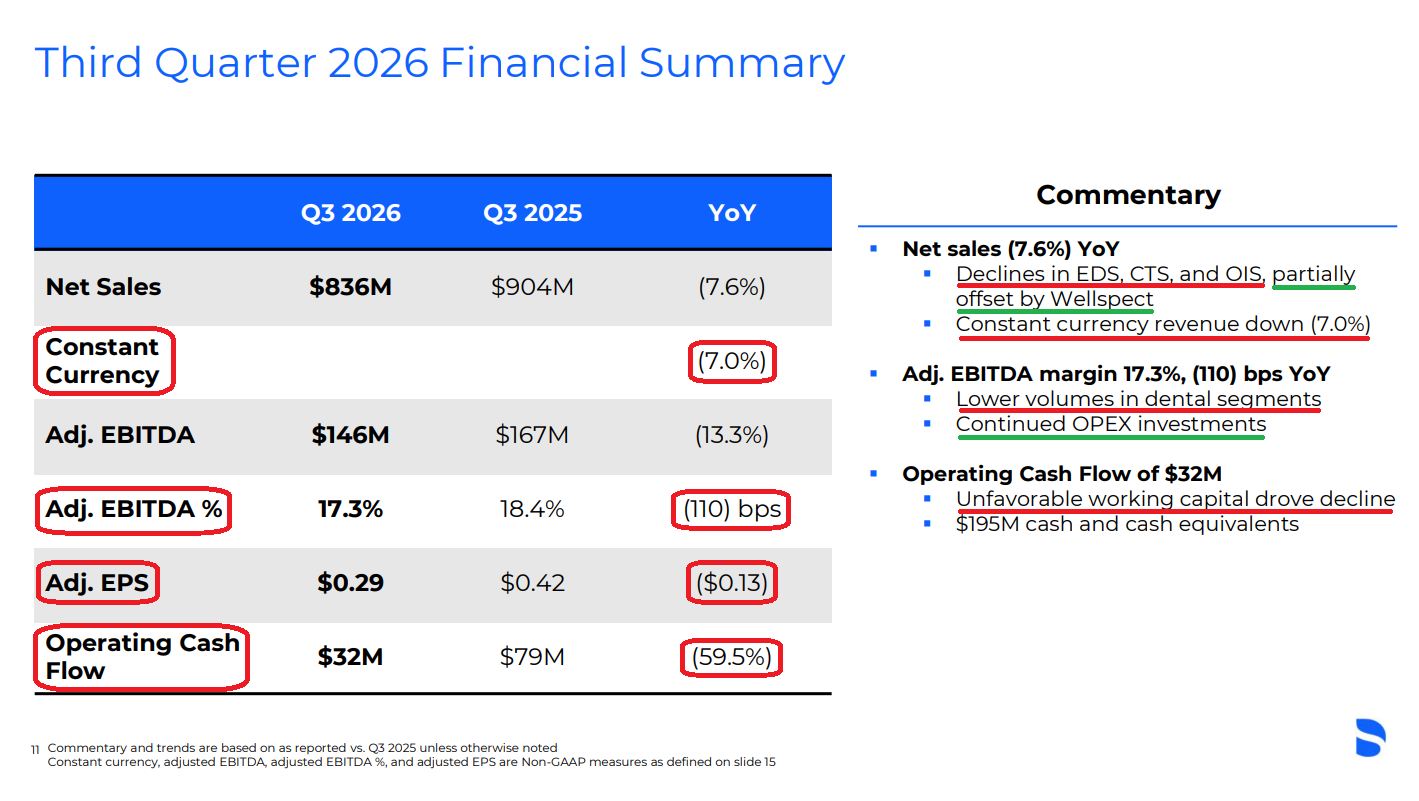
1) XRAY posted Q3 revenue of $836M (-7.6% reported, -7.0% C$), missing consensus of ~$861M. The C$ decline includes the absence of Byte (~$12M), ~$10M of planned dealer inventory reductions and other one-time items, with underlying sales down 3.8% after adjusting for these factors, in line with the ~3.6% adjusted decline in Q2. By region, the Americas declined 9.6% C$, followed by EMEA (-5.6%) and APAC (-4.3%), with management citing EMEA dealer destocking, the Middle East conflict and higher freight costs as the main pressures. U.S. performance met internal expectations, with the miss concentrated overseas.
2) Adjusted EPS of $0.29 (-29.4% Y/Y from $0.42) came in below consensus of ~$0.31. The figure includes a one-time $39M pre-tax accounting benefit (~$30M after tax, or ~$0.15 per share) from correcting how XRAY values inventory moving between its own businesses, relating to prior years rather than Q3 operations. Excluding this benefit, adjusted EPS was ~$0.14. Management said other unquantified one-time items booked this year largely offset the benefit.
3) Adjusted gross margin came in at 54.5%, up 190 bps Y/Y from 52.6%, though adjusted gross profit declined ~$20M to $456M. Excluding the inventory benefit, adjusted gross margin was ~49.9% (-270 bps Y/Y), ~150 bps below Q2’s ~51.4% excluding the tariff refund. Lower dental volumes and higher distribution costs weighed on the line, partially offset by cost management initiatives and favorable manufacturing absorption.
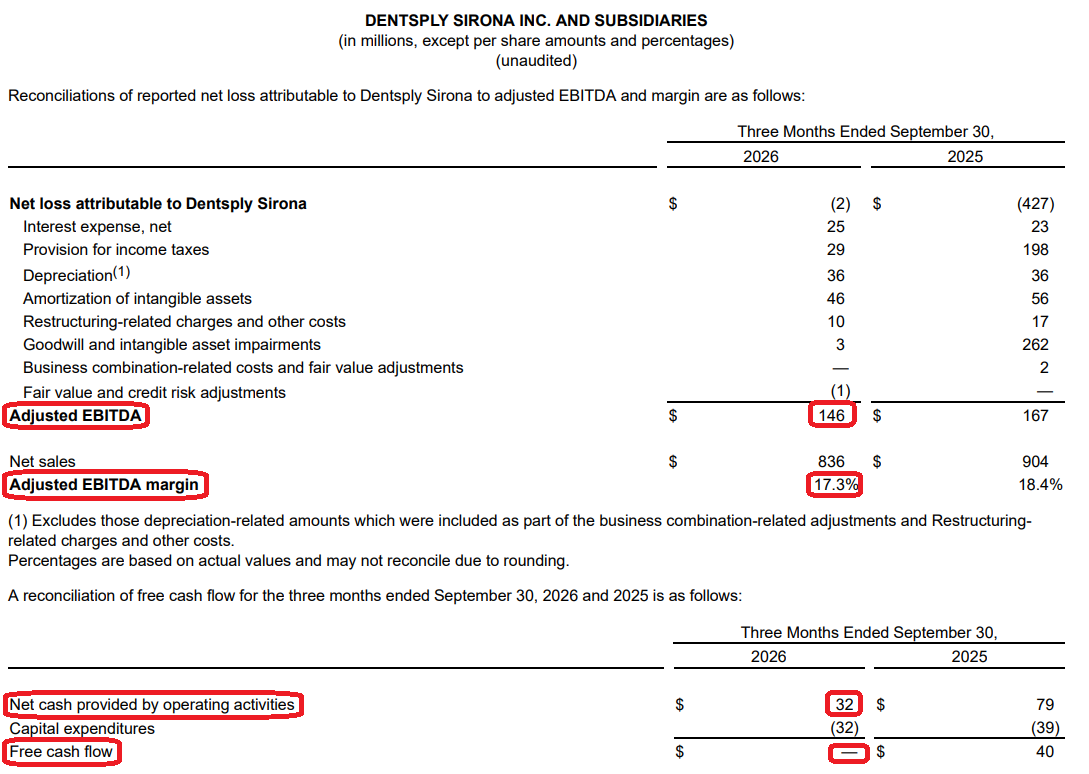
4) Adjusted EBITDA of $146M (-13.3% Y/Y from $167M) carried a margin of 17.3%, down 110 bps Y/Y from 18.4%. Excluding the inventory benefit, adjusted EBITDA was ~$107M at a ~12.8% margin, below Q2’s ~16.3% excluding the tariff refund, as seasonally lower Q3 revenue deleveraged a cost base still carrying planned investments. Adjusted OpEx rose just $3M Y/Y, with savings from the ~$120M 2026 cost program funding sales, clinical education and R&D. R&D stepped up to $42M (5.0% of sales vs. 4.1% last year) and is up ~20% YTD, keeping the innovation ramp on schedule.
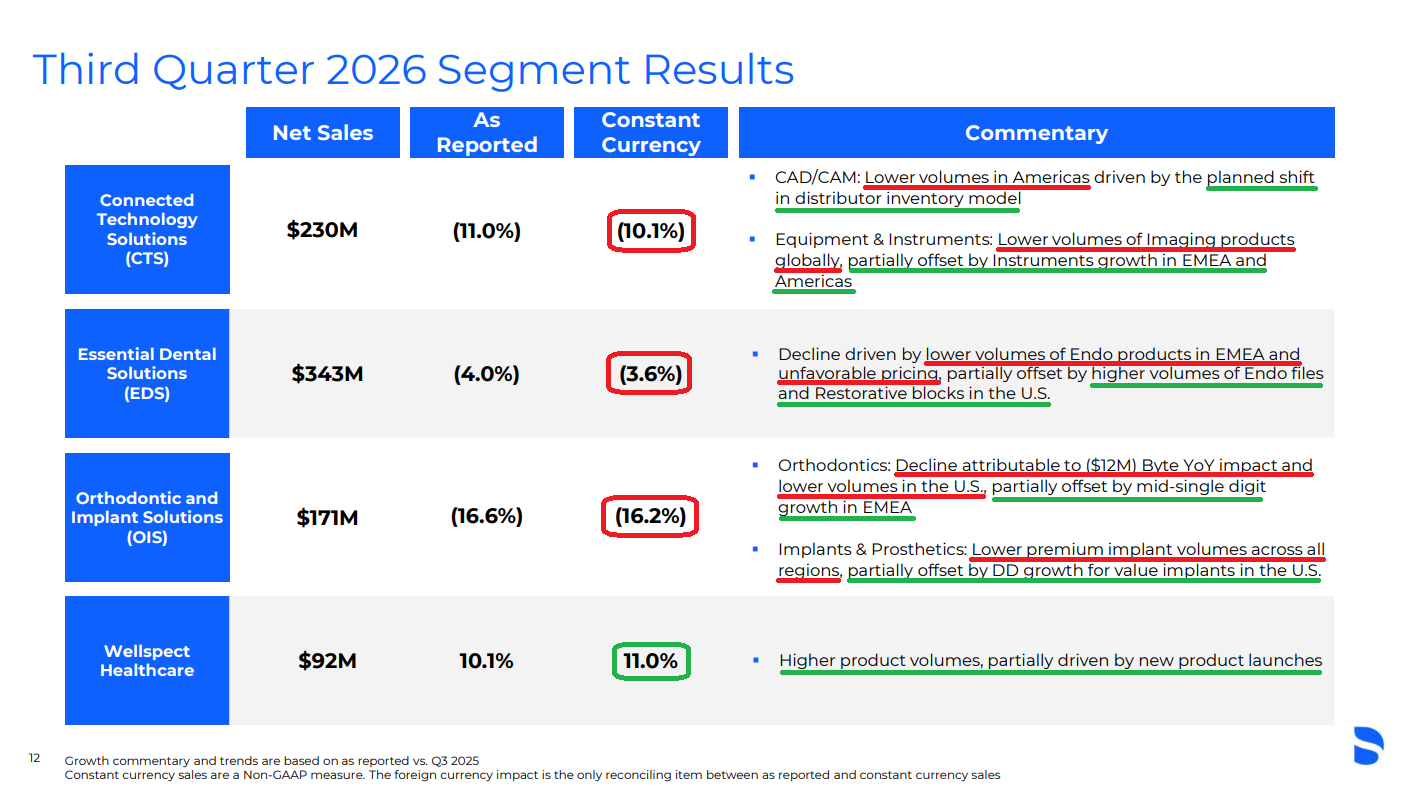
5) Connected Technology Solutions revenue was $230M (-11.0% reported, -10.1% C$), slowing from -3.8% in Q2. The Americas fell 21.9% as dealers sold down existing inventory during the planned shift to a drop-ship model, accounting for part of the ~$10M in planned dealer inventory reductions company-wide. CAD/CAM revenue was $93M, with strong scanner and mill performance in Japan partially offsetting EMEA pricing pressure and Middle East capital deferrals. Equipment & Instruments revenue was $137M (down high single digits), as low-single-digit Instruments growth was offset by lower global imaging volumes. XRAY also launched PrimeScan Connect, its most affordable scanner and a lower-cost entry point into digital dentistry. With seven distribution agreements signed this year that largely add its full technology portfolio to dealers already carrying its consumables, management considers the North American dealer expansion largely complete. Given the ~9-month lag before new dealers drive capital sales, the focus now shifts to activating that network through training, joint customer visits, demonstrations and installation support.
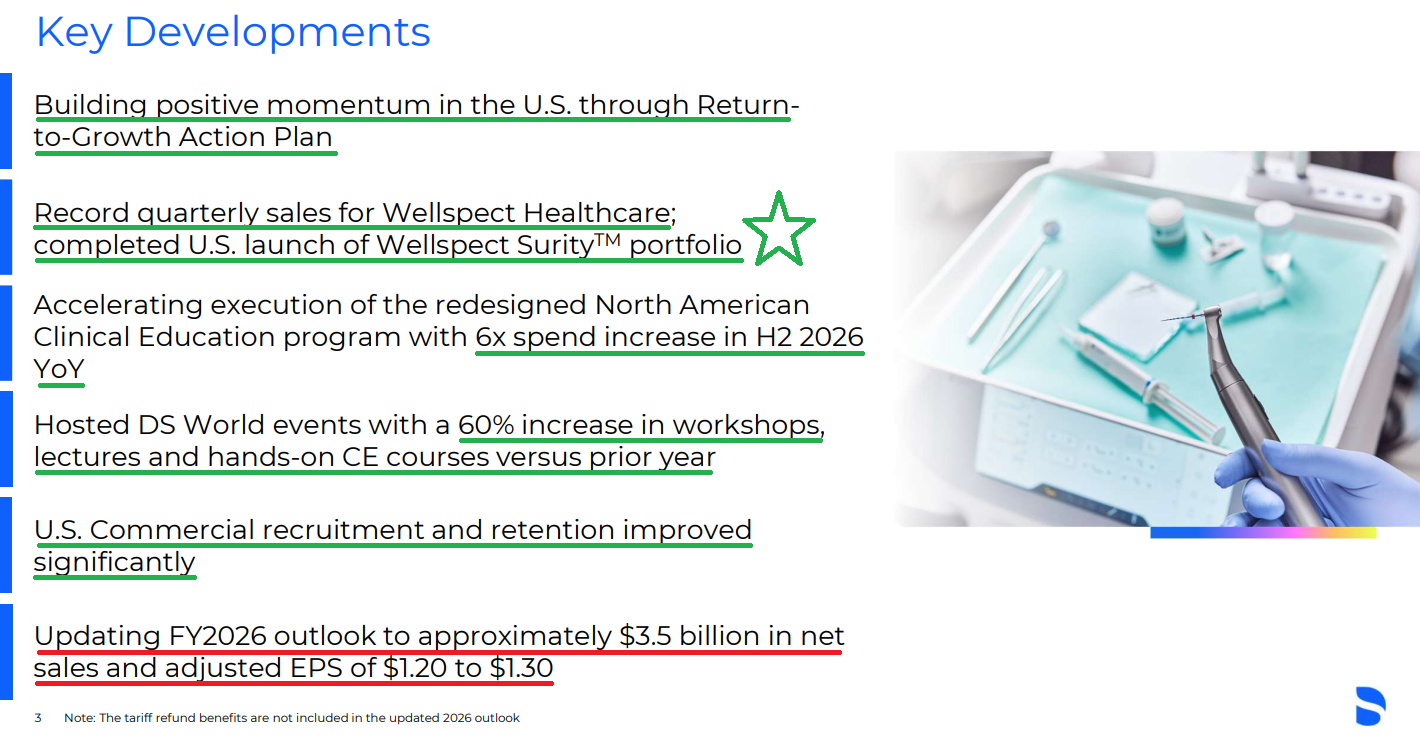
6) Essential Dental Solutions revenue was $343M (-4.0% reported, -3.6% C$), the segment’s best C$ result of the year following declines of 7.2% in Q1 and 5.0% in Q2. The Americas were nearly flat at -0.8%, led by U.S. Endo returning to growth (+4%) for the first time since Q2 2025 on strong file and restorative block volumes. That improvement lines up with XRAY’s push into clinical education, as North American spending is up 6x Y/Y in H2, including more than 160 hands-on Endo courses. Management credited the investment for a strong market response, with reorder rates on its Reciproc Blue files improving steadily through the year. EMEA declined 6.5% on lower Endo volumes and pricing, partially offset by double-digit Preventive growth in EMEA and APAC. Across Restorative and Preventive, dentist purchases outpaced XRAY’s shipments to dealers, with focus brands returning to growth.
7) Orthodontic & Implant Solutions revenue was $171M (-16.6% reported, -16.2% C$) vs. -14.9% in Q2, with Byte accounting for ~6 points of the decline. Implants & Prosthetics revenue was $132M, as lower premium implant volumes across all regions offset strength in value implants, which grew more than 7% globally. MIS, XRAY’s value implant brand, led the way with low-double-digit U.S. growth and a sharp acceleration in customer conversions in September, prompting plans to nearly double the MIS sales force by year-end. That progress reflects a stabilizing U.S. sales force, with territories lacking a rep down to the mid-single digits from more than 20%, voluntary rep attrition down substantially, premium implant reps fully certified and implant education engagement up more than 60%. SureSmile revenue was $39M, pressured by the absence of Byte and lower U.S. volumes, while EMEA grew 8%, marking its sixth quarter of mid-single-digit or better growth in the last seven.
8) Wellspect Healthcare delivered record revenue of $92M (+10.1% reported, +11.0% C$), accelerating from +3.8% in Q2 and +3.4% in Q1, with growth in every region. The Americas led the way at +78.6%, driven by the U.S. rollout of the Surity incontinence portfolio, which XRAY built through a planned sequence of launches: a female external catheter in January, a male external catheter in April and the at-home Urinary Management System in August. The portfolio then qualified for traditional Medicare coverage in October, widening access for eligible patients managing incontinence at home. Wellspect increased investment 15% Y/Y as it targets the ~$7B urinary management market. With the U.S. push still in its early innings, management expects the momentum to carry into 2027.
9) Operating cash flow was $32M vs. $79M last year, with free cash flow of $0M vs. $40M, driven by unfavorable working capital despite lower capital expenditures of $32M vs. $39M. YTD operating cash flow reached $171M (+27.6% Y/Y), with YTD free cash flow of $43M, essentially flat vs. $44M last year. XRAY repurchased 1.2M shares for ~$13M, marking its second consecutive quarter of buybacks and bringing the YTD total to $25M. The company ended the quarter with $195M of cash against ~$2.2B of total debt, with net debt-to-EBITDA rising to 3.4x from 3.2x as EBITDA declined, while debt reduction remains the core capital allocation priority.
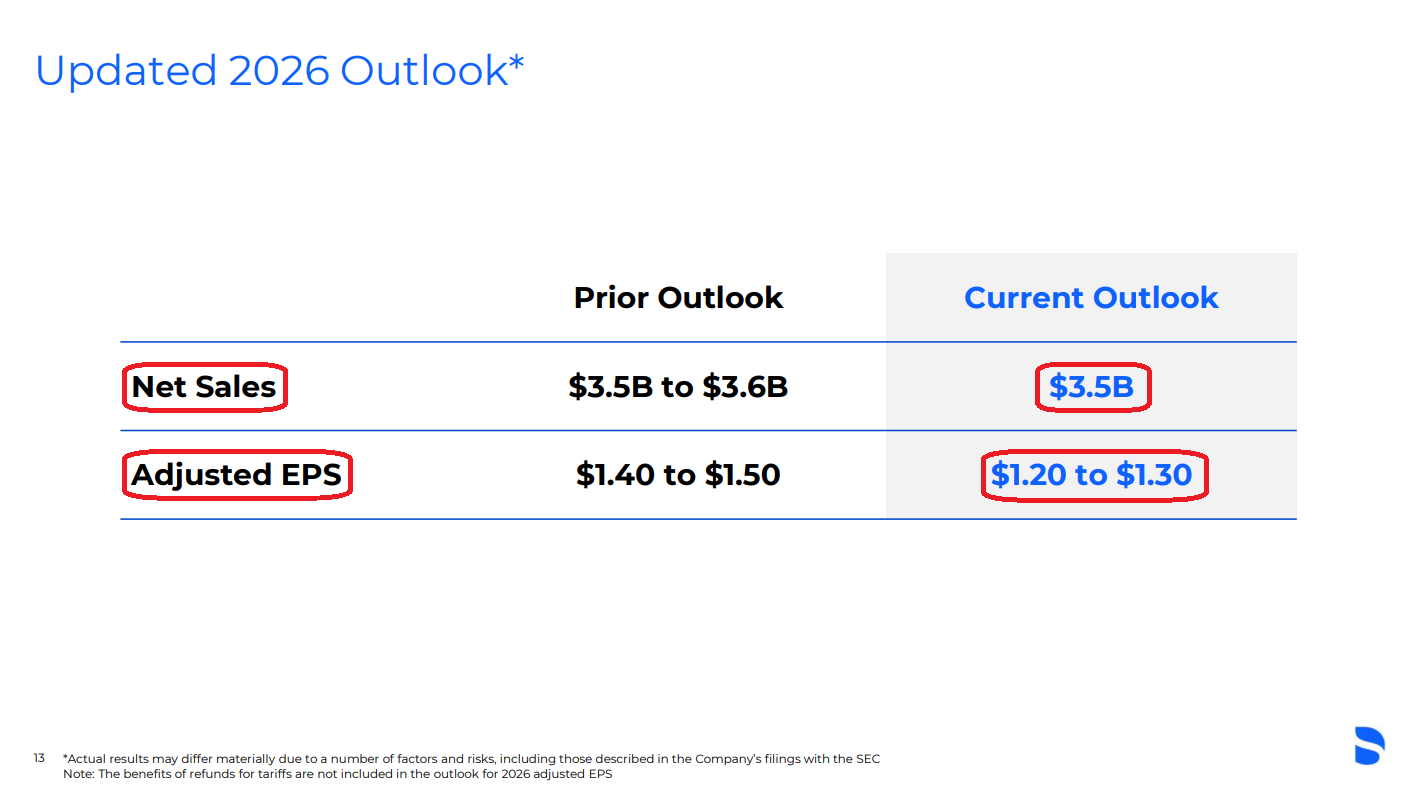
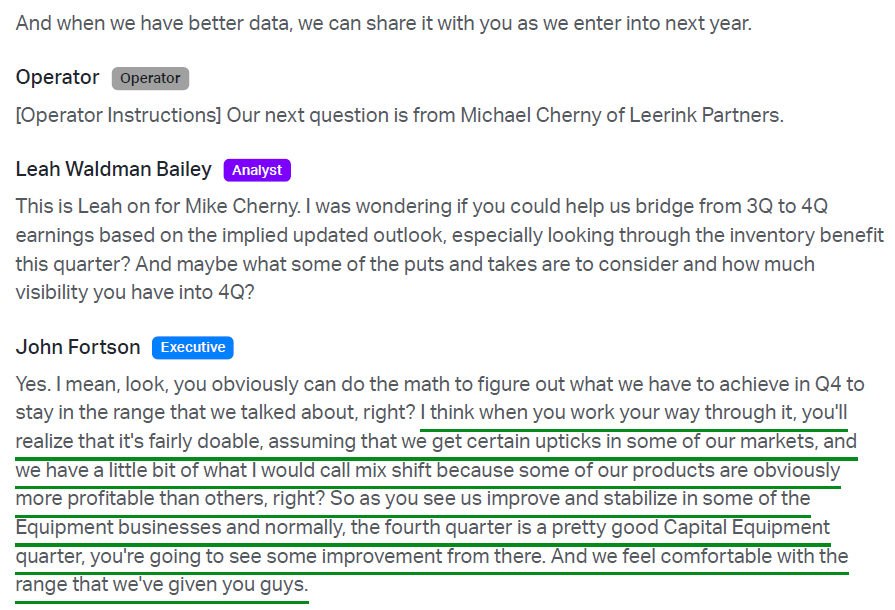
10) Management cut its FY26 outlook to ~$3.5B in net sales (from $3.5-3.6B) and adjusted EPS of $1.20-1.30 (from $1.40-1.50), excluding the $0.17 tariff refund but including the ~$0.15 inventory benefit, implying ~$1.10 of operational EPS at the midpoint. EMEA underperformance and the Middle East conflict drove ~3/4 of the reduction, with an unfavorable tax rate and strategic investments making up the balance. The range implies Q4 adjusted EPS of ~$0.29-0.39 vs. $0.27 last year, supported by a seasonally strong capital equipment quarter and favorable mix. Scavilla is still targeting a return to positive U.S. growth in Q4, calling it a stretch, with growth expected in Q1 if that target slips.
Earnings Call Highlights
General Market
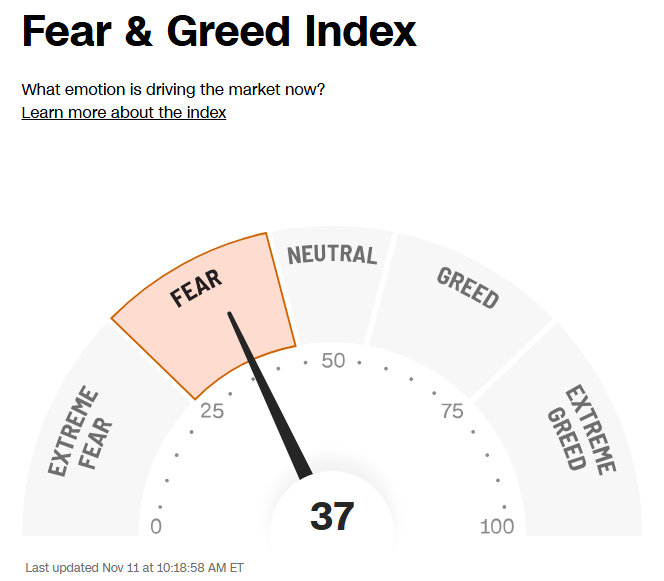
The CNN “Fear and Greed Index” ticked up to 37 this week from 26 last week. You can learn how this indicator is calculated and how it works here: (Video Explanation)
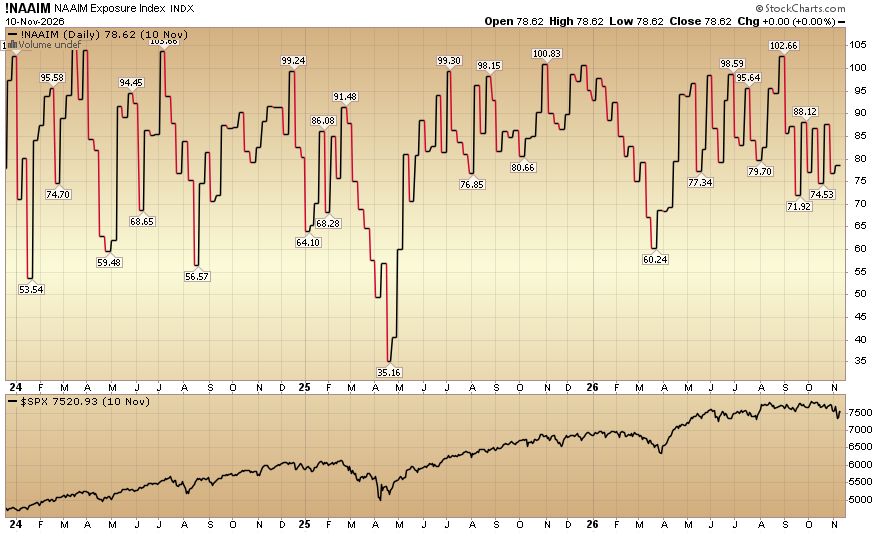
The NAAIM (National Association of Active Investment Managers Index) (Video Explanation) ticked up to 78.62% equity exposure this week from 76.84% last week.


Comments
Log in or sign up to join the conversation.