

Key Market Outlook(s) and Pick(s)
On Tuesday, I joined the great Stuart Varney on Fox Business’ Varney & Co. to discuss markets, AI, tech, defensives, Nvidia (NVDA), and more. Thanks to Stuart, Maggie Edwards, and Nick Palazzo for having me on. Link here.
On Tuesday, I joined Romaine Bostick on Bloomberg TV to discuss Nvidia (NVDA) earnings. Thanks to Romaine and Kayla (Arestivo) DeMarco for having me on. Link here.
On Monday, I joined Brent Slava on The Stock Trader Network to discuss markets, the economy, outlook, rotation, the consumer, tech, Nvidia (NVDA), Etsy (ETSY), Disney (DIS), Dentsply Sirona (XRAY), Anthropic (ANT), and the latest developments. Thanks to Brent and Zoltan Suranyi for having me on. Link here.
On Monday, I joined Sarah Al-Khaldi on Channel NewsAsia to discuss markets, the economy, outlook, rotation, Nvidia (NVDA), Anthropic (ANT), and more. Thanks to Sarah and Blanche Lim for having me on. Link here.
Bank of America Fund Manager Survey Update
On Tuesday, we put out a summary of the monthly Bank of America Global Fund Manager Survey. This month, they surveyed 169 institutional managers with ~$461B in AUM:
Here were the 5 key points:
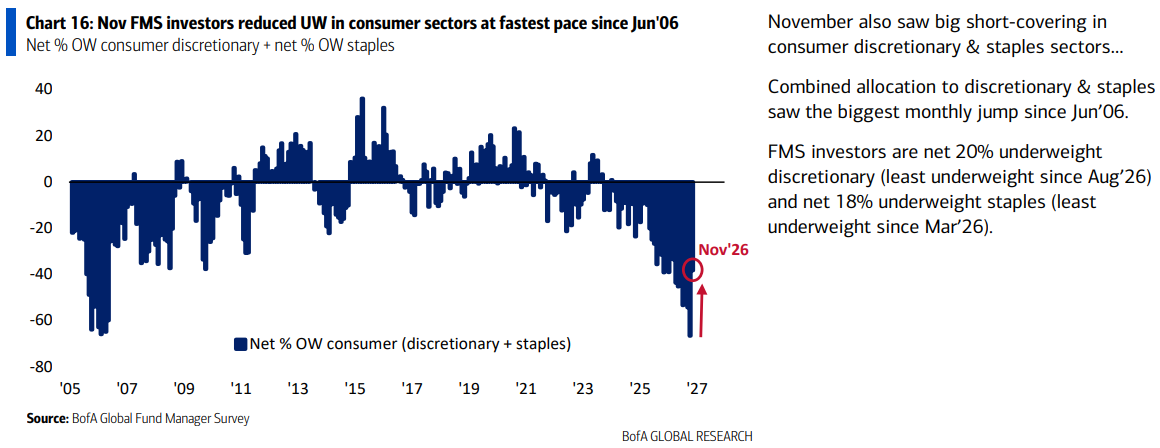
1) Fund managers piled back into the consumer in November, with combined allocation to discretionary + staples jumping 28 ppts to a net 38% underweight from a net 66% underweight last month, the biggest monthly increase since June 2006. Discretionary moved to a net 20% underweight from a net 34% underweight, while staples climbed to a net 18% underweight from a net 32% underweight. We have spent months pounding the table on buying anything with a fork or a sneaker (restaurants, apparel, footwear, etc.), with opinion now following trend. Even after the rotation, discretionary still sits 0.8 standard deviations below its long-term average and staples 1.0 standard deviations below, leaving plenty of room to work higher.
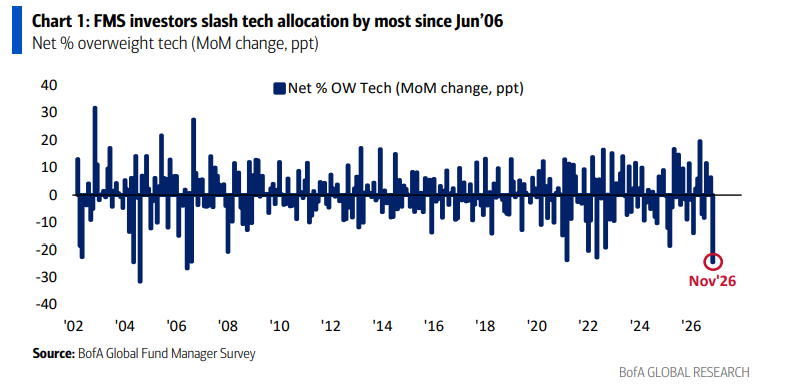
2) Fund managers cut their technology allocation by 25 ppts to a net 12% overweight from a net 37% overweight last month, the biggest monthly reduction since June 2006, leaving positioning 0.5 standard deviations below its long-term average. The cut comes just one month after managers piled into their most overweight tech position since August 2020, with everyone swept up in the AI trade just in time for it to roll over.
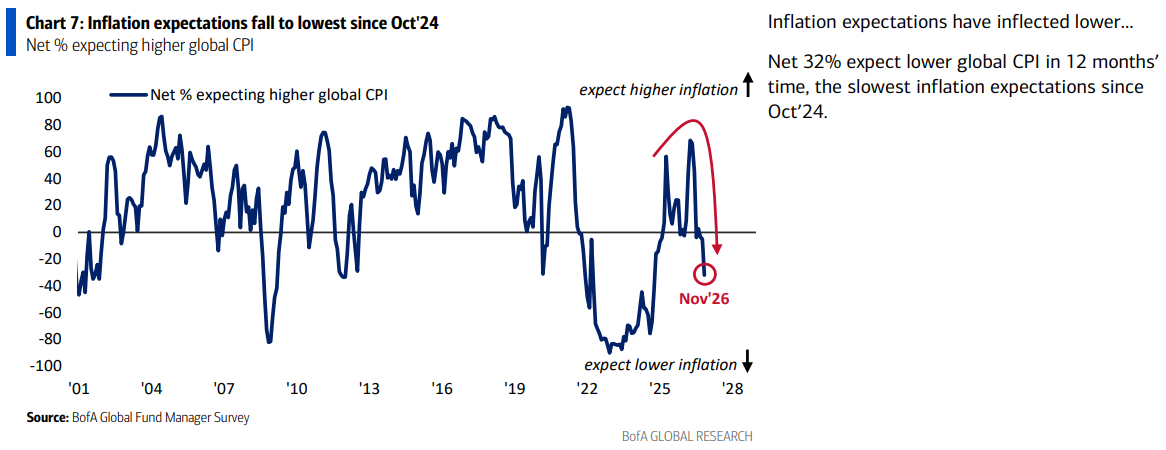
3) Inflation expectations have inflected lower, with a net 32% of fund managers now expecting lower global CPI in 12 months’ time (vs. net 5% last month), the lowest inflation expectations since October 2024. Fears of a second wave of inflation have faded along with them, slipping to just 14% as a tail risk.
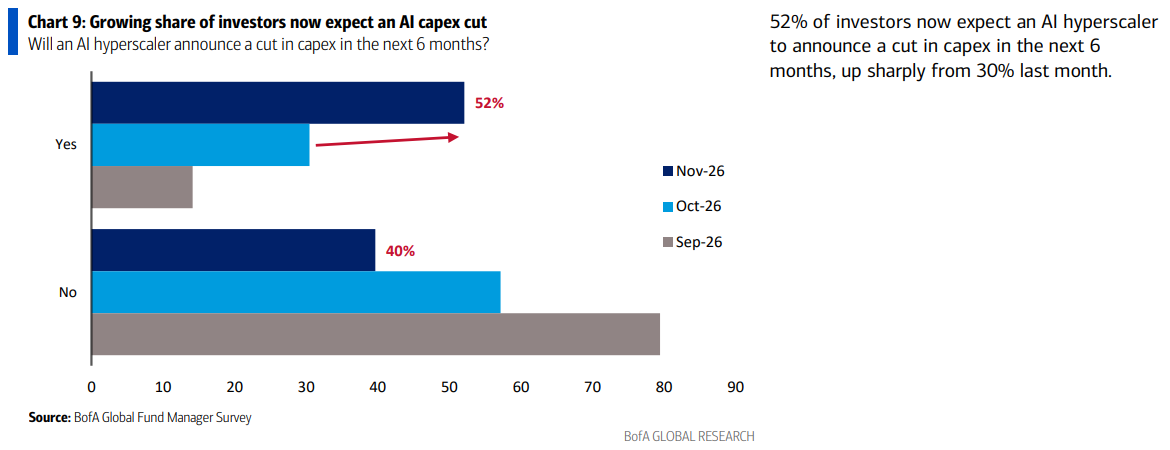
4) A majority of fund managers (52%) now expect an AI hyperscaler to announce a capex cut over the next six months, up from 30% last month and just 14% in September, while those expecting no cuts fell to 40%. The message to hyperscalers is clear, with a record net 38% saying companies are overinvesting and just 16% wanting them to boost capex (the lowest since May 2020), while AI hyperscaler bonds remain the most likely source of a systemic credit event (38%).
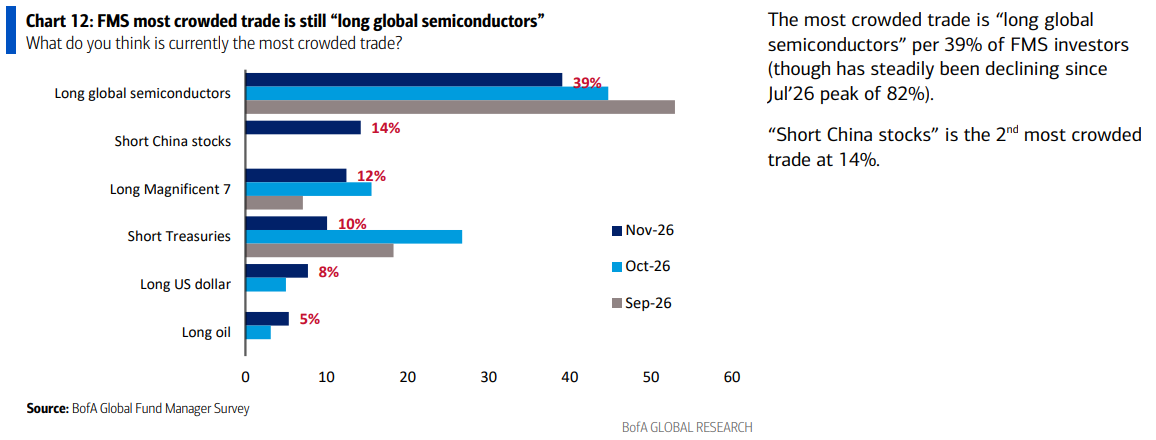
5) “Long global semiconductors” remains the most crowded trade at 39%, though that share has fallen steadily from a record 82% in July 2026. Behind it, “short China stocks” has popped up as the second most crowded trade at 14%, a consensus we are happy to take the other side of. We continue to see China as the cheapest way to play AI globally, with BABA effectively serving as a Chinese AI ETF while also acting as a toll taker on the Chinese consumer recovery.
Advance Auto Parts Update
For newer readers, here’s a quick overview of the key drivers behind our thesis on Advance Auto Parts, the long-neglected auto parts retailer undergoing a back-to-basics turnaround with substantial margin recovery still ahead:
Company Overview
Leading automotive aftermarket parts retailer founded in 1929; headquartered in Raleigh, NC
Blended-box model serving Pro (~50% of sales) and DIY (~50%) from the same locations
4,087 Advance Auto Parts stores + 238 Carquest stores as of Q3 2026 (4,325 total); #3 U.S. player behind O’Reilly and AutoZone
Also services 787 independently owned Carquest branded stores across the US, Canada, Puerto Rico, the US Virgin Islands, and various Caribbean islands
90% of sales from maintenance and break-fix categories
Net sales from continuing operations ~$8.6B in FY2025
Revenue mix: parts and batteries 63%, accessories and chemicals 22%, engine maintenance 14%
Structural tailwinds: average U.S. vehicle age at a record 12.8 years in 2025 (estimated 13.0 years in 2026), growing vehicle base, and rising miles traveled supporting steady 3.5%+ industry growth (DIFM outpacing DIY)
U.S. light-duty vehicle parc of 289M today, up from 263M in 2016 and projected to exceed 301M by 2029
More than 110M vehicles now sit in the prime aftermarket service window of 6 to 14 years, nearly 38% of the fleet, with S&P Global expecting that share to reach ~40% by 2028
Total vehicle miles traveled rebounded to 3.34T after troughing in 2021
$160B TAM with AAP holding just over 5% share; the big 3 hold under 30% of the industry, leaving plenty of share to be gained
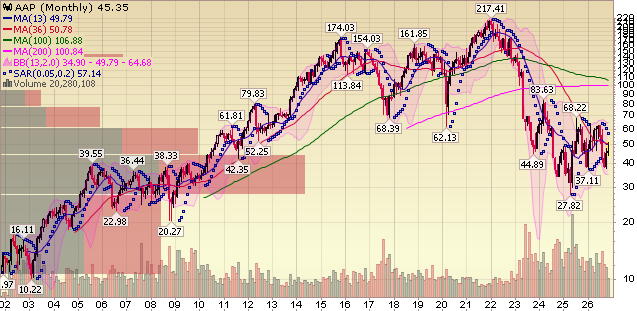
Shares still down >80% from 2022 highs (~$240), trading at 2010 levels
Management
CEO Shane O’Kelly (since August 2023): proven supply chain and operations leader with 30+ years in distribution and logistics
Former CEO of HD Supply ($8B+ business sold to Home Depot), CEO of PetroChoice (world’s largest lubricant distributor), and 7-year U.S. Army officer
CFO Ryan Grimsland (late 2023): ~17 years at Lowe’s
Board additions: Tom Seboldt (30+ years at O’Reilly), Gregory Smith (Goodyear operations, Walmart supply chain), Brett Windom (former Pep Boys CEO)
WorldPac Sale
Sold WorldPac wholesale/import parts business to Carlyle for $1.5B cash (announced August 2024, closed November 2024)
Net proceeds ~$1.45B after taxes and fees; tax liability came in ~$200M lower than expected
Proceeds used for debt reduction: transformed $1.3B net debt (end-2023) into ~$80M net cash by end-2024
Leverage taken down from >4x to 2.2x at end of Q3 2026 (within target range of 2x to 2.5x), vs. 2.1x in Q2 2026
$3.1B of cash on the balance sheet against $3.4B of debt at end of Q3 2026 ($349M of 1.75% notes due October 2027 now current)
Repurchased and retired ~$30M of principal on the 2028 senior notes in Q2 2026, the first debt reduction since the WorldPac paydown; Moody’s and S&P both moved to a stable outlook during the quarter (investment grade remains 3 notches away at Moody’s, 2 at S&P)
Removes lower-margin wholesale drag; simplifies focus on core retail/Pro blended-box model with solvency risk off the table
Margin Expansion
Operating margins bottomed in FY2024 at just 0.4% of net sales, the weakest in 20+ years due to prior expansion missteps, supply chain inefficiencies, and under-investment in core operations
Trailing peers dramatically: AutoZone/O’Reilly at ~19-20%; AAP historically maintained 9-11% before missteps
Productivity review identifies >500 bps of margin opportunity
FY2025 adjusted operating margin of 2.5% (+213 bps Y/Y from near-breakeven)
Q3 2026 adjusted operating margin of 4.5% (+10 bps Y/Y) on a negative comp, with adjusted operating income of $91M ahead of consensus $88.4M; excluding Q2 tariff refunds, one of the strongest margin quarters since the strategic plan began; YTD adjusted operating margin of 4.6% vs. 2.2% last year
Q3 2026 adjusted gross margin of 44.7% (-16 bps Y/Y) on ~40 bps of DIY mix, fuel, and supply chain deleverage plus ~20 bps of product mix into motor oil, partially offset by ~40 bps of net LIFO benefit; YTD 45.3% (+150 bps Y/Y), with merchandising initiatives contributing ~100 bps of gross margin expansion YTD
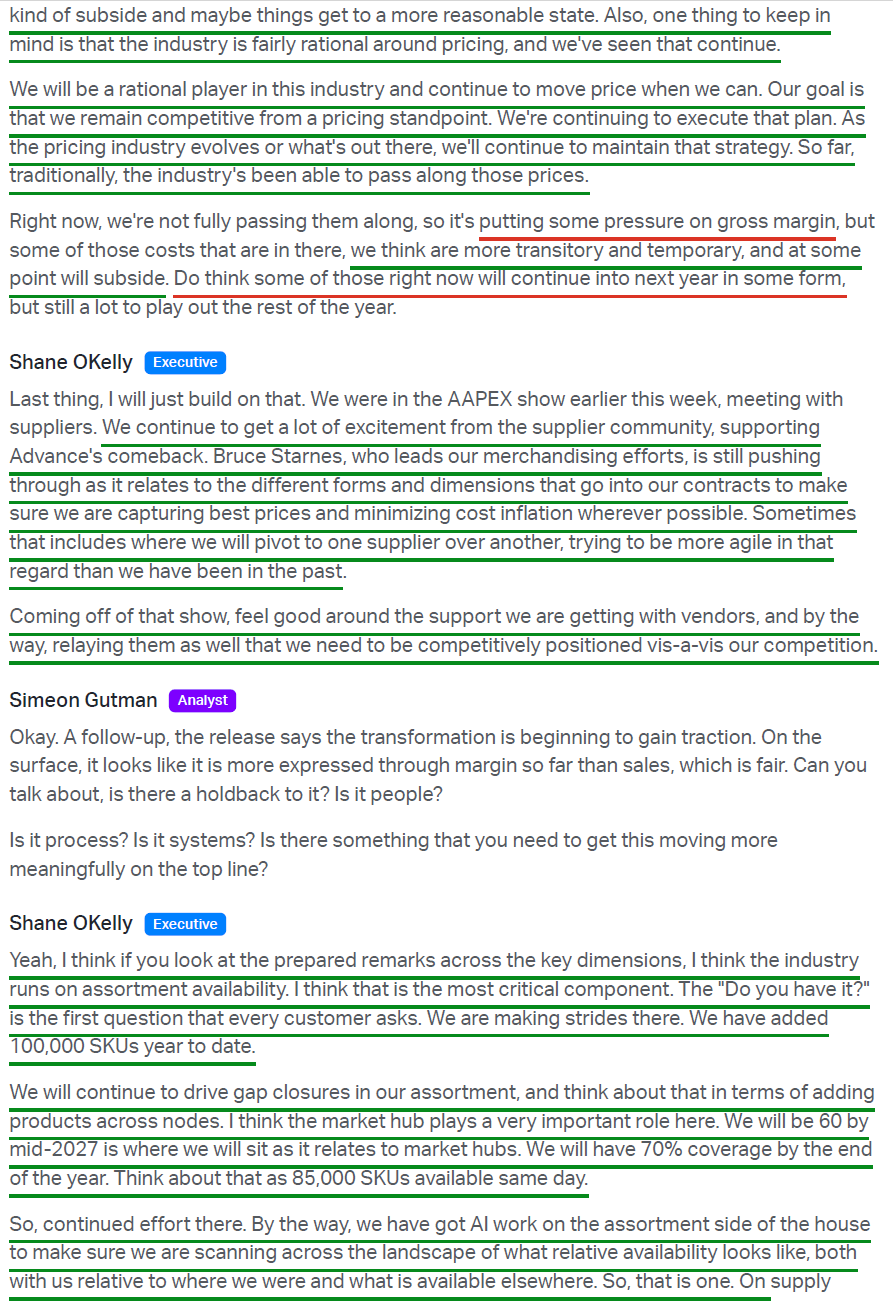
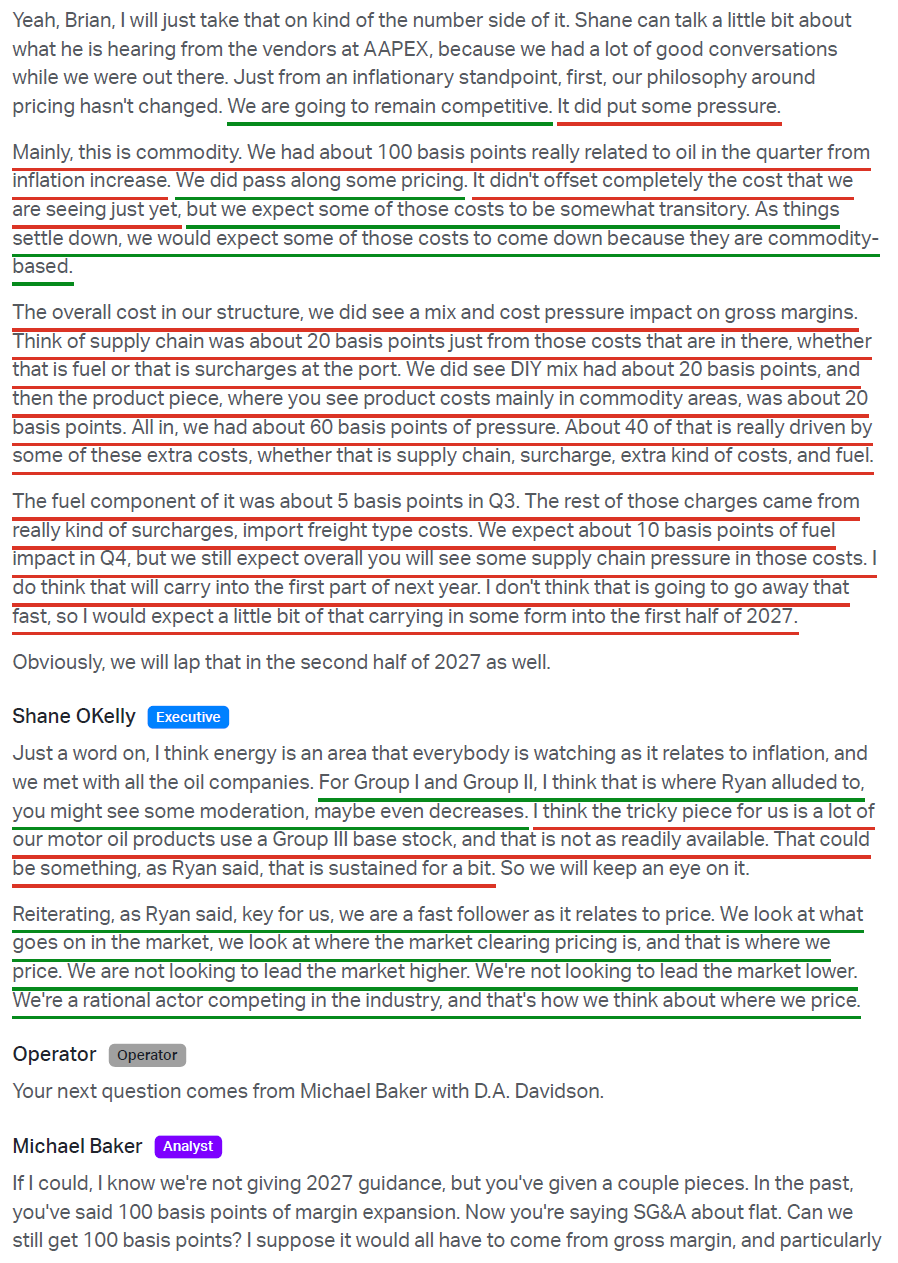
Not yet fully passing commodity cost inflation through to customers, viewing much of the pressure as transitory; rational fast follower on pricing, not leading the market higher or lower
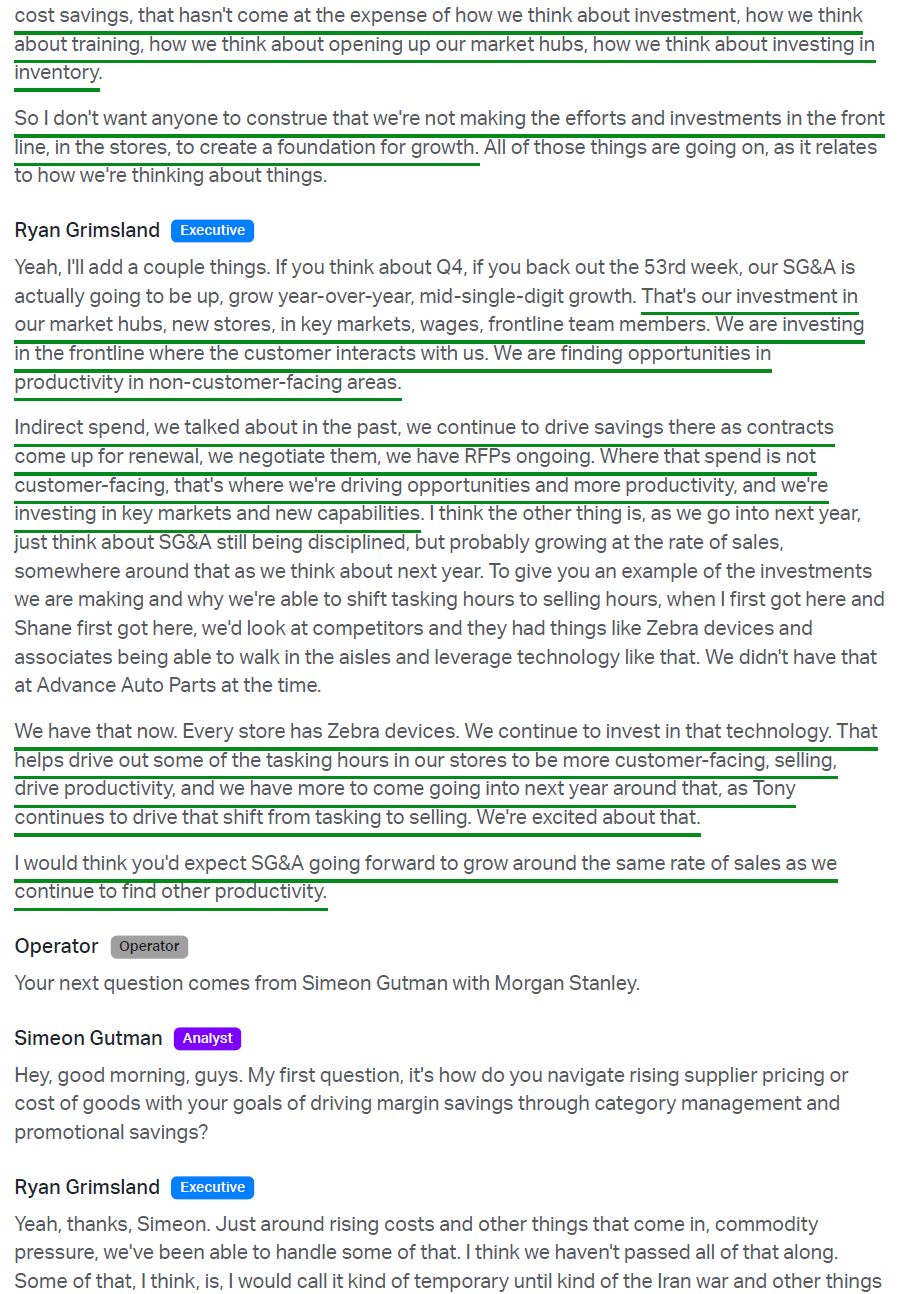
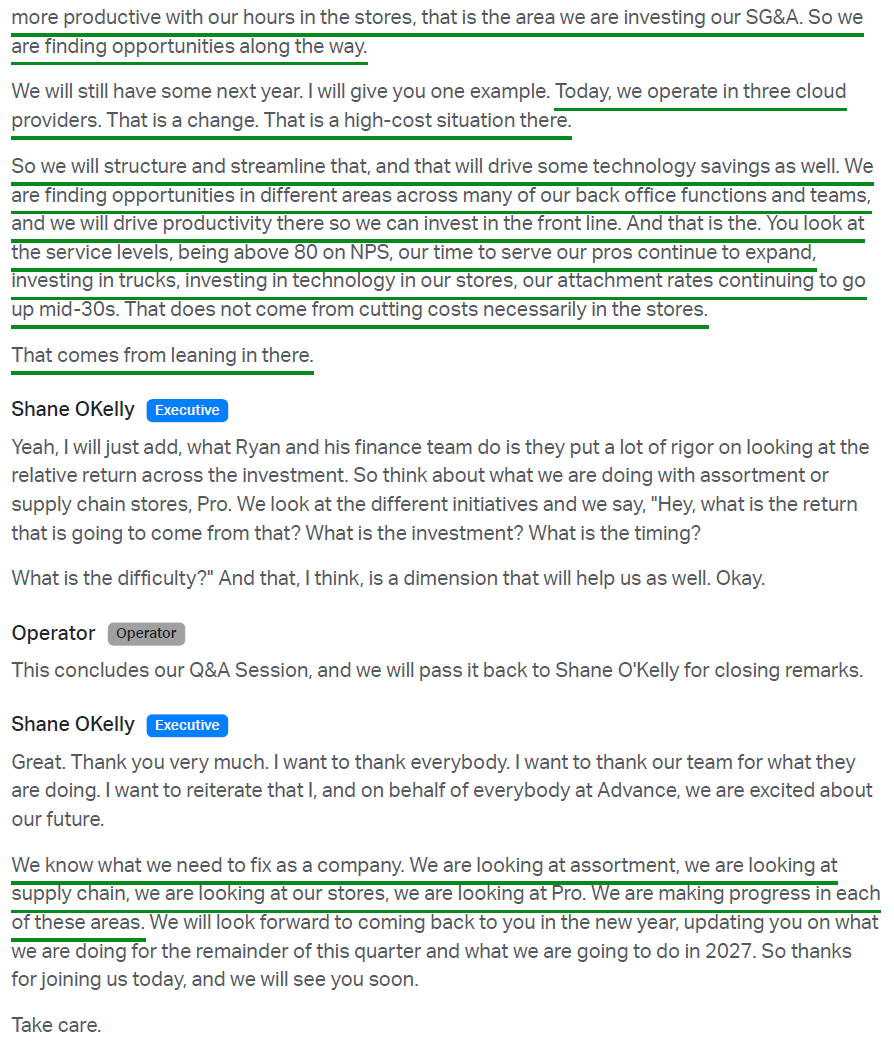
Q3 2026 adjusted SG&A of 40.2% of net sales, 26 bps of leverage Y/Y with dollars down ~2%; productivity found in non-customer-facing areas (indirect spend, cloud consolidation) reinvested in the frontline
FY2026 guidance: adjusted operating margin narrowed to 4.0-4.3% from 3.8-4.5% (4.15% midpoint reaffirmed, +150+ bps)
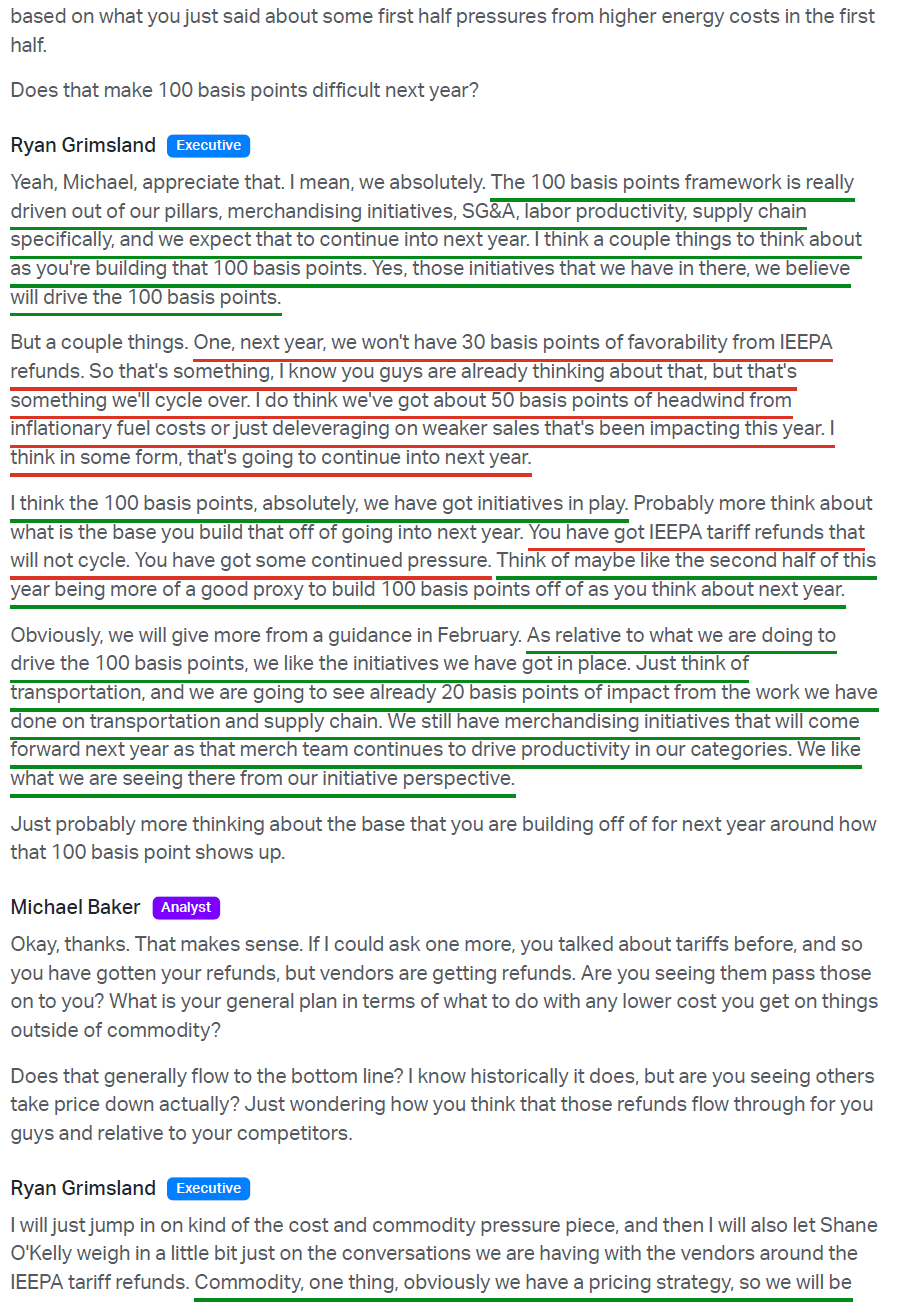
Management expects at least another 100+ bps expansion in FY2027, a third straight year of 100+ bps expansion, driven by merchandising, labor productivity, and supply chain (incl. 20+ bps from transportation); built off the H2 2026 base (~3.65%) rather than the full year given ~30 bps of non-repeating tariff refunds and ~50 bps of fuel/deleverage pressure lingering into H1 2027, implying ~4.7%
SG&A expected to grow roughly in line with sales in FY2027 as productivity savings are reinvested in stores, hubs, and frontline labor, leaving gross margin as the main driver of incremental expansion
Medium-term target: 7% adjusted operating margin still viewed as appropriate, though pushed out as the original plan assumed steady low-single-digit comps; implies ~$630M operating income on $9B sales
Last time AAP had operating income in the $600M range (2018-2022), EPS was $5.75-$7.70 and shares reached $182-$244 (with 10%+ higher share count)
Consensus cut post-print to ~4.53% for FY2027 and ~5.0% for FY2028, right around management’s framework; EPS of $3.47 in FY2027 (+20.1% Y/Y) and $4.14 in FY2028 (+19.1% Y/Y) on top-line growth of 2.1% and 2.4%
At 7% on ~$9B, ~$630M of operating income supports close to $7 per share of normalized earnings power, more than double the current run-rate
Supply Chain Overhaul
Prolonged underperformance stems from supply chain inefficiencies (failure to properly integrate after the Carquest and now-divested WorldPac acquisitions in 2014)
DC consolidation completed in Q2 2026: down to 15 DCs on a single unified warehouse management system, from nearly 40 of varying sizes and systems when the project began; 12-13 long-term
Market hubs rollout (hub-and-spoke network modeled after AutoZone and O’Reilly): 46 hubs at end of Q3 2026 (up from 0 at end-2023); opened 14 in 2025 vs. prior target of 10
FY2026 plan of 15-20 reaffirmed (13 opened through Q3), targeting ~50 by year-end and ~60 by mid-2027
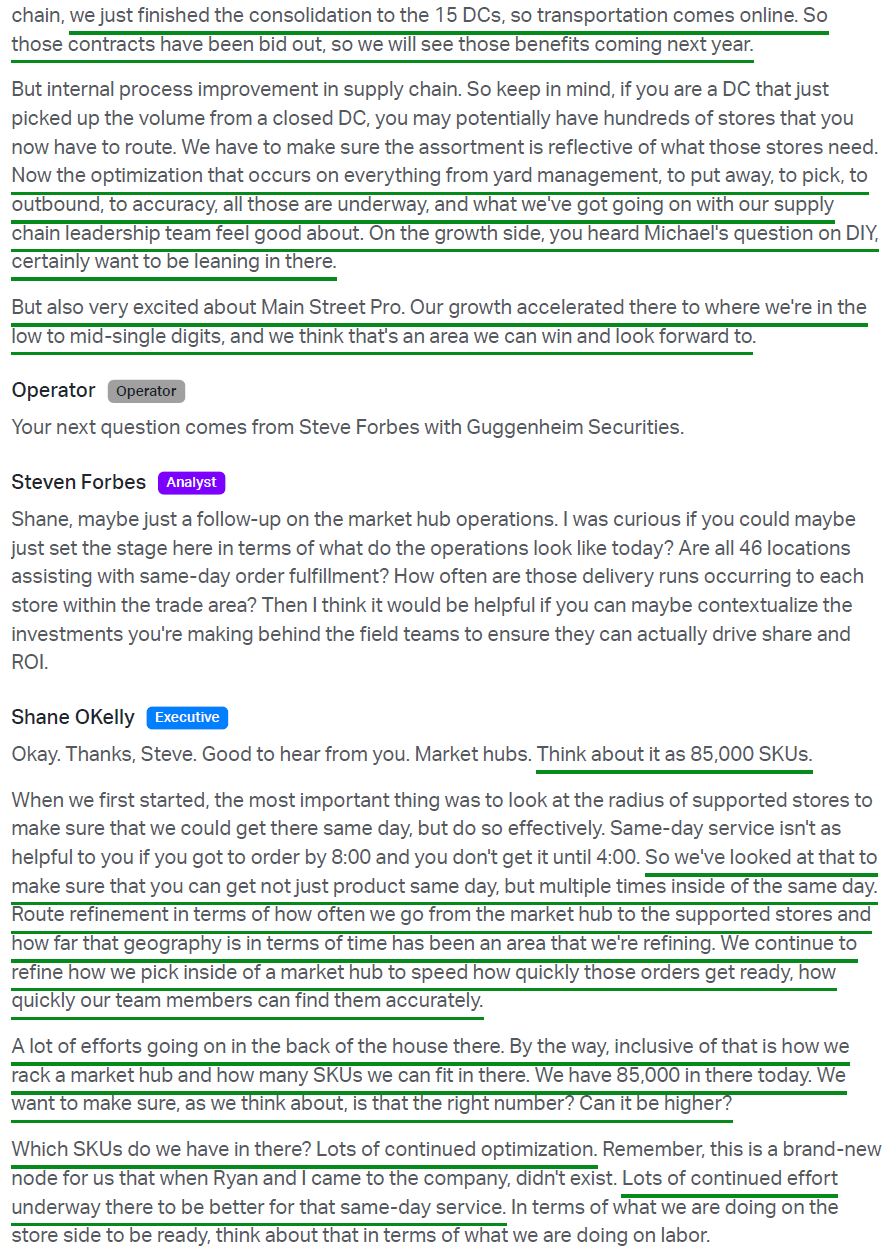
Hubs carry ~85K SKUs with 5x+ the backroom hard parts space of an average store and multiple same-day delivery runs to surrounding stores; ~100 bps comp uplift in served locations; 70%+ of stores inside a hub ecosystem by end-2026, majority of stores by mid-2027
Greenfield hubs outperforming the converted Carquest DC locations given better retail positioning
Parts availability up from low-90s% to 96-97% (target: high-90s%)
Delivery times to Pro customers down from 50+ minutes to consistently under 40 minutes (target: 30-40 minutes)
Unified warehouse management system delivering >50 bps of annualized cost savings from H2 2025 onward
Driving key DC process improvements (receiving, put-away, inbound/outbound) across all DCs in stages through mid-2027 to lower handling costs, improve shipment accuracy, and shorten lead times; productivity savings expected to drive gross margin expansion in FY2027 and beyond
Carrier contracts bid with volume consolidating into 70% fewer carriers, expected to generate 20+ bps of cost savings even in a flattish sales environment, supporting FY2027 margins; first phase of a broader transportation opportunity
Formed a dedicated team in Q3 2026 to build a multi-year inventory planning and allocation roadmap targeting working capital efficiency
Improved Store Operations
Closed >700 underperforming stores (523 corporate + 204 independent) in 2025, representing a 10% reduction in corporate stores and a 20% cut in U.S. independent locations; saved ~$70M in operating costs
75% of the footprint now in #1 or #2 density markets
Upgraded >1,600 stores in FY2025 (paint, HVAC, signage, racking) vs. 440 in FY2024; plan 1,000+ in FY2026
New assortment framework rolled out to top 50 DMAs (~70% of sales); initial ~50 bps comp uplift with expanded assortment of +100K SKUs in FY2025 and ~100K added YTD in FY2026, with AI-enabled tools aligning inventory to local demand
On schedule to fully deploy the new pricing framework across both DIY and Pro by year-end 2026, improving visibility into competitive pricing actions and enabling precise market-based pricing, alongside tighter discipline around store-level promotions
Opened 35 new stores in FY2025; FY2026 plan cut to 30-35 from 40-45 as capital shifts toward market hubs (26 opened and 6 closed through Q3)
Newly launched ARGOS owned brand (motor oil, expanded into hydraulic oils, antifreeze, performance chemicals, washer fluid) now AAP’s highest unit-selling motor oil, with further category expansion underway as the DIY consumer trades toward value
Modernized DIY loyalty program “Advance Rewards” launched in Q1 2026 (replacing Speed Perks), driving higher new member sign-ups, program penetration, and total transactions from loyalty members
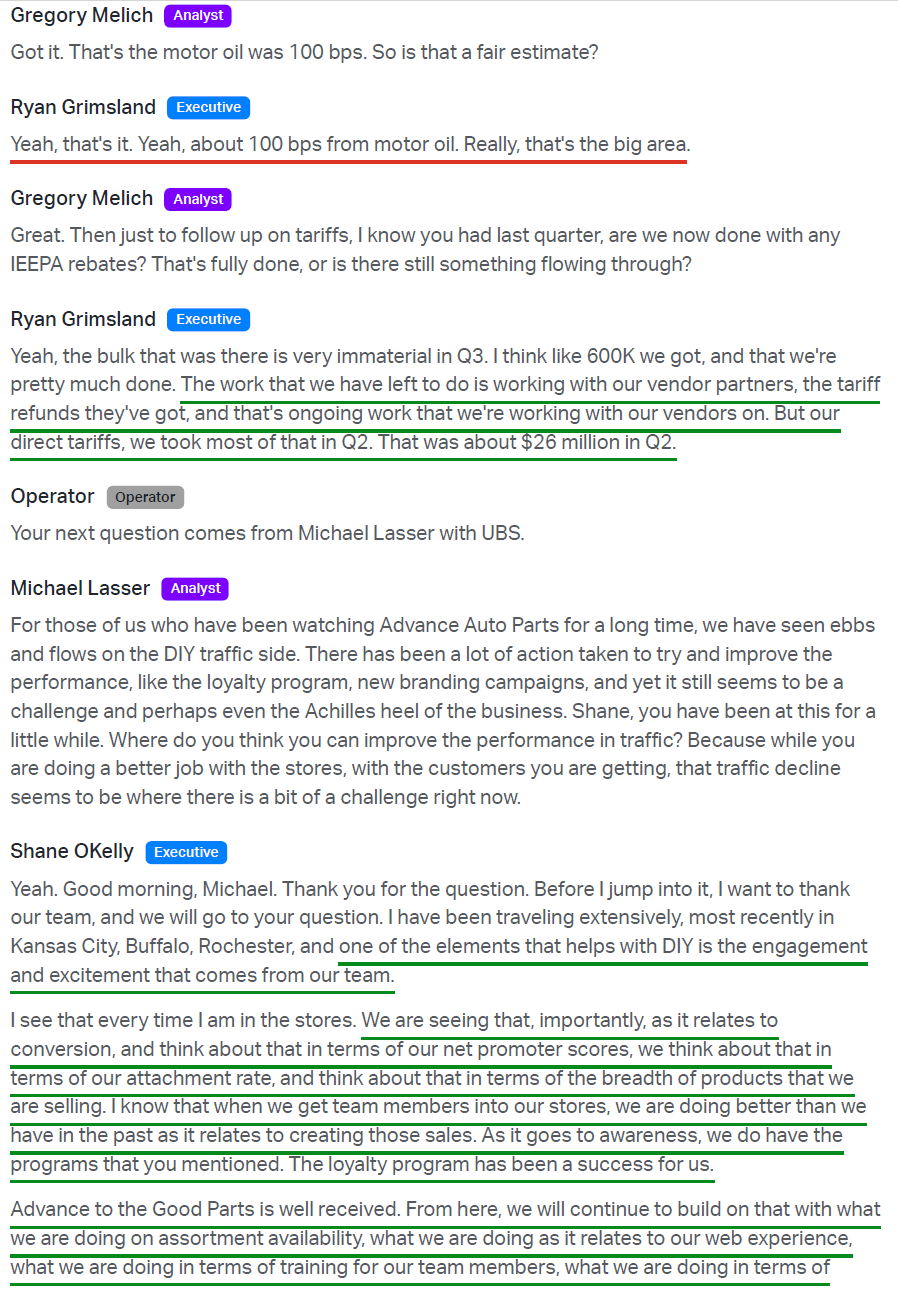
Focus on better training, frontline workers who know auto parts, and improved customer service; NPS above 80 in Q3 2026 vs. the high 70s in Q2 and high 60s last year, with in-store attachment rates in the mid-30s from ~30%
Completed an independent study of store task execution in Q2 2026 to update labor standards left unchanged for over a decade, now modernizing workforce management tools to shift task hours to selling hours
Zebra devices now in every store; ReliaScan check-engine diagnostic tool (free customer service) deployed across most stores in Q3 2026
Return to Growth
FY2025 comp sales +0.8%, the first positive comp after 3 straight years of declines; FY2026 on track for back-to-back years of positive comps (YTD +0.8%)
Q3 2026 comp sales -1.2% vs. consensus +0.4% and -0.5% in Q2, but trends improved through the quarter off the late-Q2 trough (~-3%): ~-2% in the first 8 weeks before turning positive in the final 4, driven by transactions as store service execution and value messaging improved
Pro led the quarter at +low-single digits, positive every month and accelerating to ~+3% in the final 4 weeks
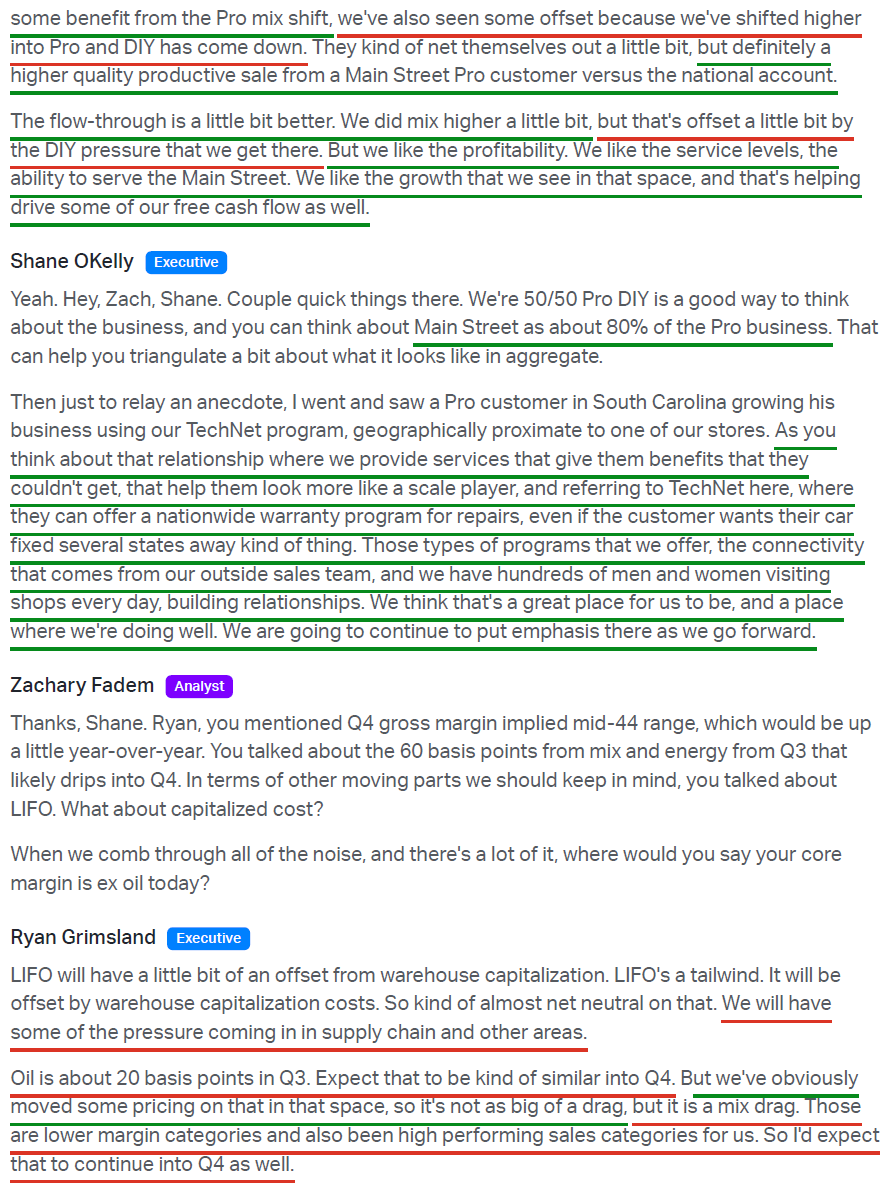
Deliberate pivot toward Main Street Pro (small independent repair shops), the largest Pro segment at ~80% of Pro sales, which ran ~100 bps ahead of overall Pro on new customer acquisition and existing customers moving into higher weekly spending tiers
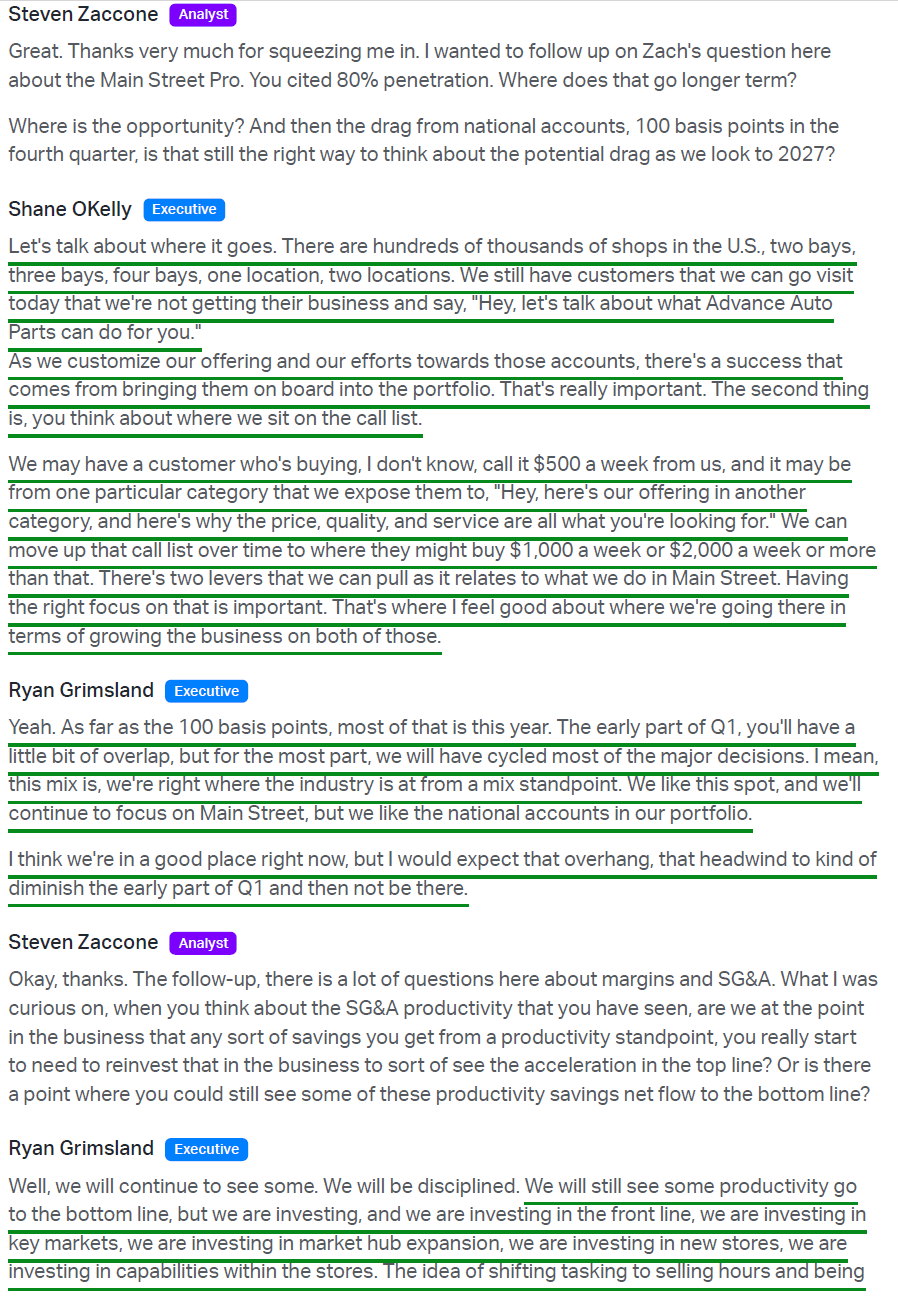
Main Street is a higher-quality, more productive sale than national accounts, with better flow-through supporting margins and FCF; rationalization of lower-margin national accounts (~100 bps Pro headwind, ~50 bps to total sales) largely cycled by early Q1 2027, with mix now in line with the industry
Two levers for Main Street growth: winning new shops from the hundreds of thousands of 1-4 bay independents nationwide, and moving existing customers up the call list (e.g. $500/week to $1,000-$2,000+) by cross-selling categories
Main Street push supported by improved parts availability, sub-40-minute delivery, hundreds of outside sales reps visiting shops daily, and the TechNet program (nationwide repair warranty that lets independents compete like scale players); account segmentation being enhanced and service territories reorganized to capture more growth
DIY declined low-single digits as low-to-middle income households stayed stretched by persistent inflation and higher gas prices, but recovered from ~-7% in late Q2 and -4%+ in the first 8 weeks of Q3 to low-single-digit declines in the final 4 weeks; units per transaction up low-single digits with average ticket growth above same-SKU inflation
DIY is AAP’s highest-margin channel, so any recovery brings a mix tailwind to margins
Maintenance and failure categories (motor oil, batteries, filters, wipers) led while hard parts lagged as value-conscious consumers deferred larger repairs; maintenance spending can only be put off so long
DIY action plan: sharper value messaging, Advance Rewards loyalty, paid search optimization, ReliaScan diagnostics, and ARGOS private label for the value-seeking customer
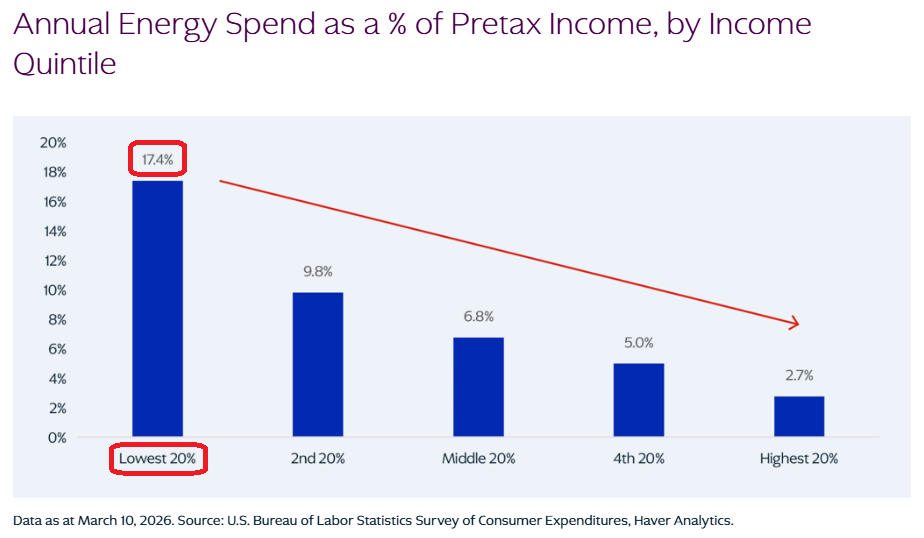
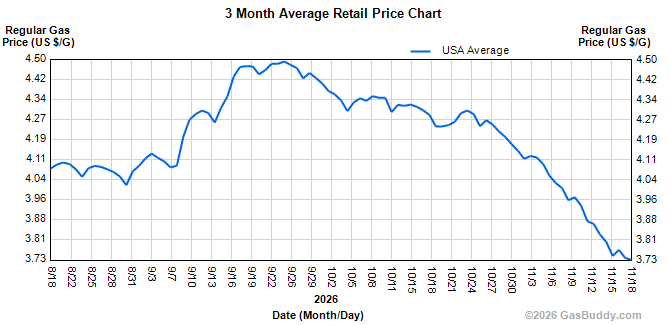
Macro turning: gas prices rolled over in late September, down ~$0.70/gallon from the peak to $3.78 (8-month low); energy eats up 17.4% of pre-tax income for the bottom quintile (bulk of it gasoline) vs. 2.7% for the top; lower-income households led October card spending growth (+5.9%, BofA) with holiday spending up ~9% Y/Y; October retail sales +6.8% Y/Y (strongest since October 2022)
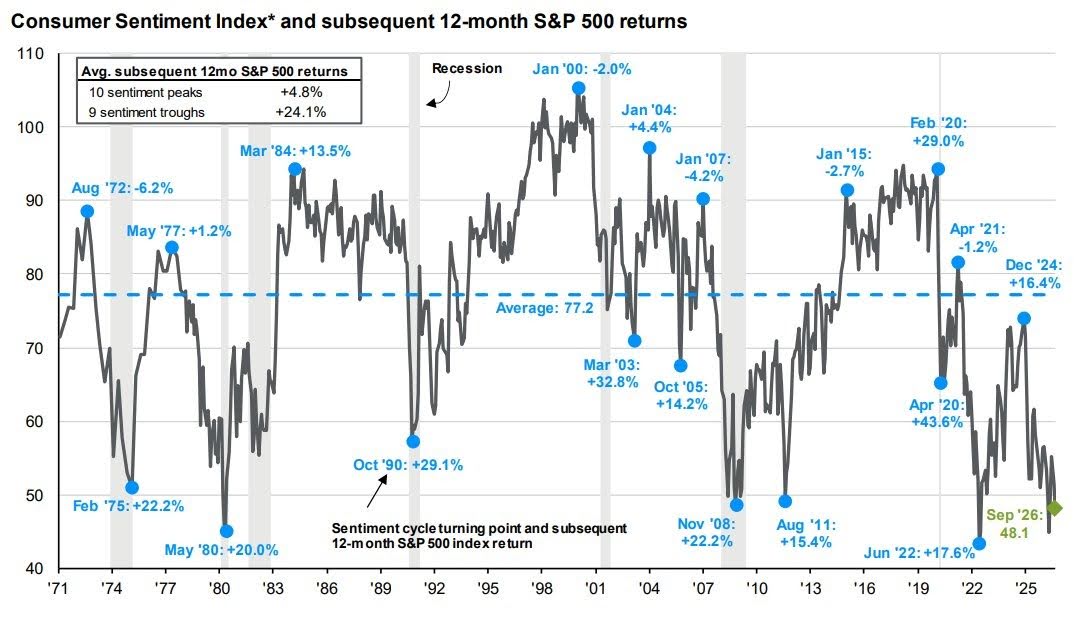
Consumer sentiment washed out at 48 in October vs. the 44.8 May low; last nine sentiment troughs averaged 24.1% S&P 500 returns over the following 12 months
Same-SKU inflation ~4% (motor oil ~100 bps), with AAP a rational fast follower on pricing, not leading the market higher or lower
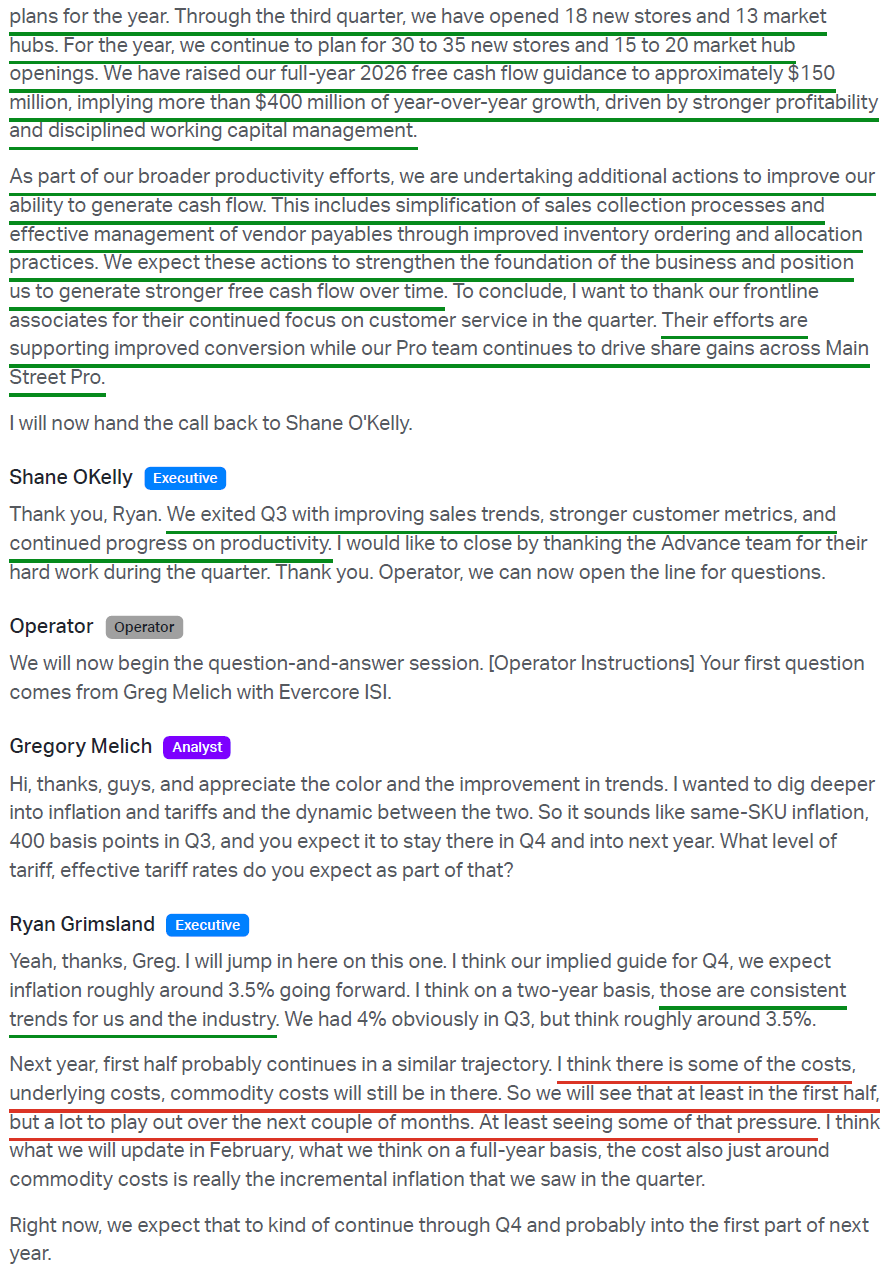
FY2026 guidance: comp sales lowered to ~+1% from +1-2%, implying accelerating comps in Q4; Q4 net sales ~+1% Y/Y ex-53rd week; early Q4 DIY flattish with Pro accelerating to low-to-mid single digits
Long-term: low-single-digit comps; target $9B net sales by FY2027
Key Financials + Valuation
FY2025 adjusted EPS: $2.26
Q3 2026 adjusted EPS: $0.79 vs. consensus $0.78 and $0.92 last year (higher adjusted tax rate); YTD adjusted EPS $2.59 vs. $1.40
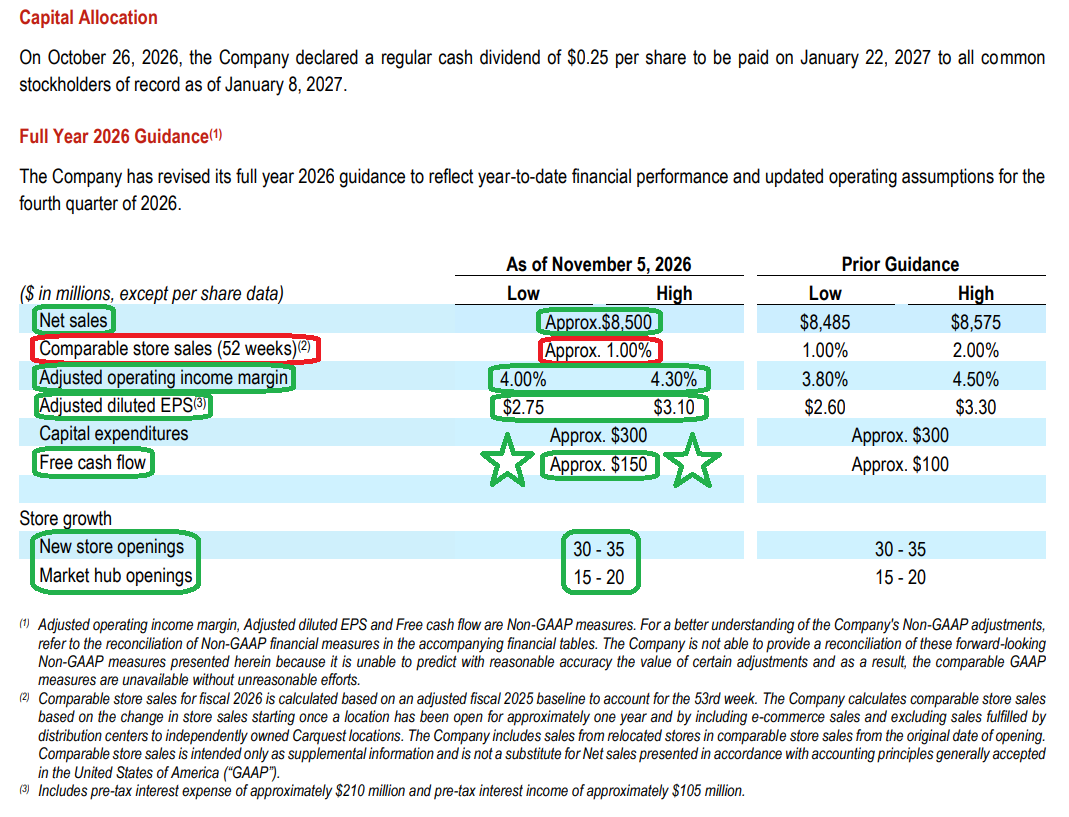
FY2026 guidance: net sales ~$8.50B (from $8.485-$8.575B), adjusted EPS narrowed to $2.75-$3.10 from $2.60-$3.30 (consensus $2.96), FCF raised to ~$150M from ~$100M, ~$105M of interest income (up $5M) against ~$210M of interest expense; capex ~$300M (up from $252M in FY2025) for new hubs, new stores, store upgrades, and in-store technology
YTD free cash flow of +$109M vs. an outflow of $277M last year, the first positive year-to-date FCF in two years; YTD operating cash flow of +$311M vs. -$118M, absorbing capex of $202M vs. $159M
FY2026 FCF target raised 50% to ~$150M (>$400M Y/Y improvement), which would mark the first full year of positive free cash flow since FY2022; mgmt does not expect FCF to go backwards in FY2027 despite capex at or above FY2026 levels
~$947M remaining on the share repurchase authorization (untouched in 2026), with buybacks a natural next step as cash generation builds
Net leverage 2.2x at end of Q3 2026; cash $3.09B, total debt $3.39B
Trading at ~12.7x forward earnings vs. AZO and ORLY at 15x and 24x, and vs. a 20-year average of ~18x
~6x normalized earnings power of close to $7/share
15.8% short interest
Share count down ~18.5% over the past 10 years
2.3% dividend yield
Q3 Commentary
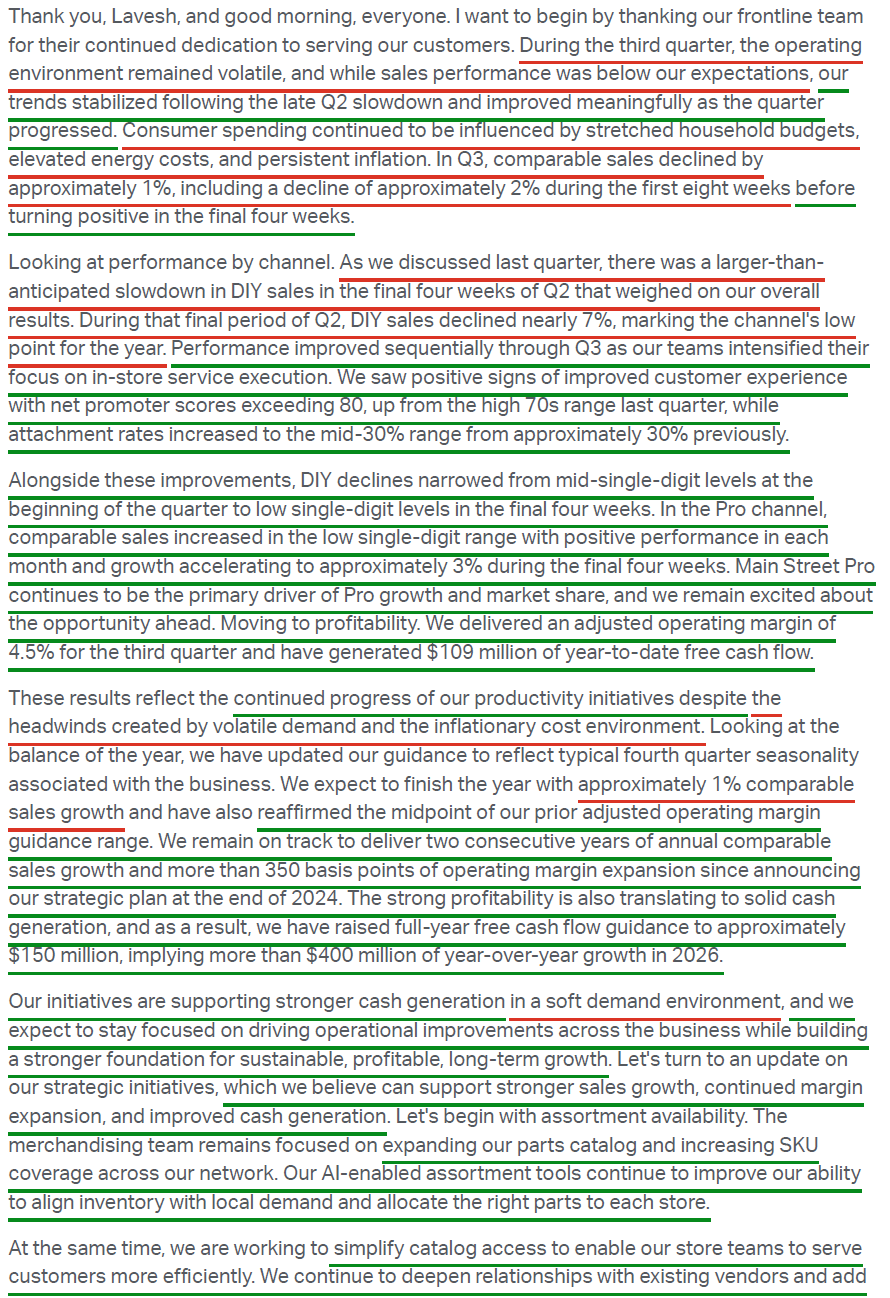
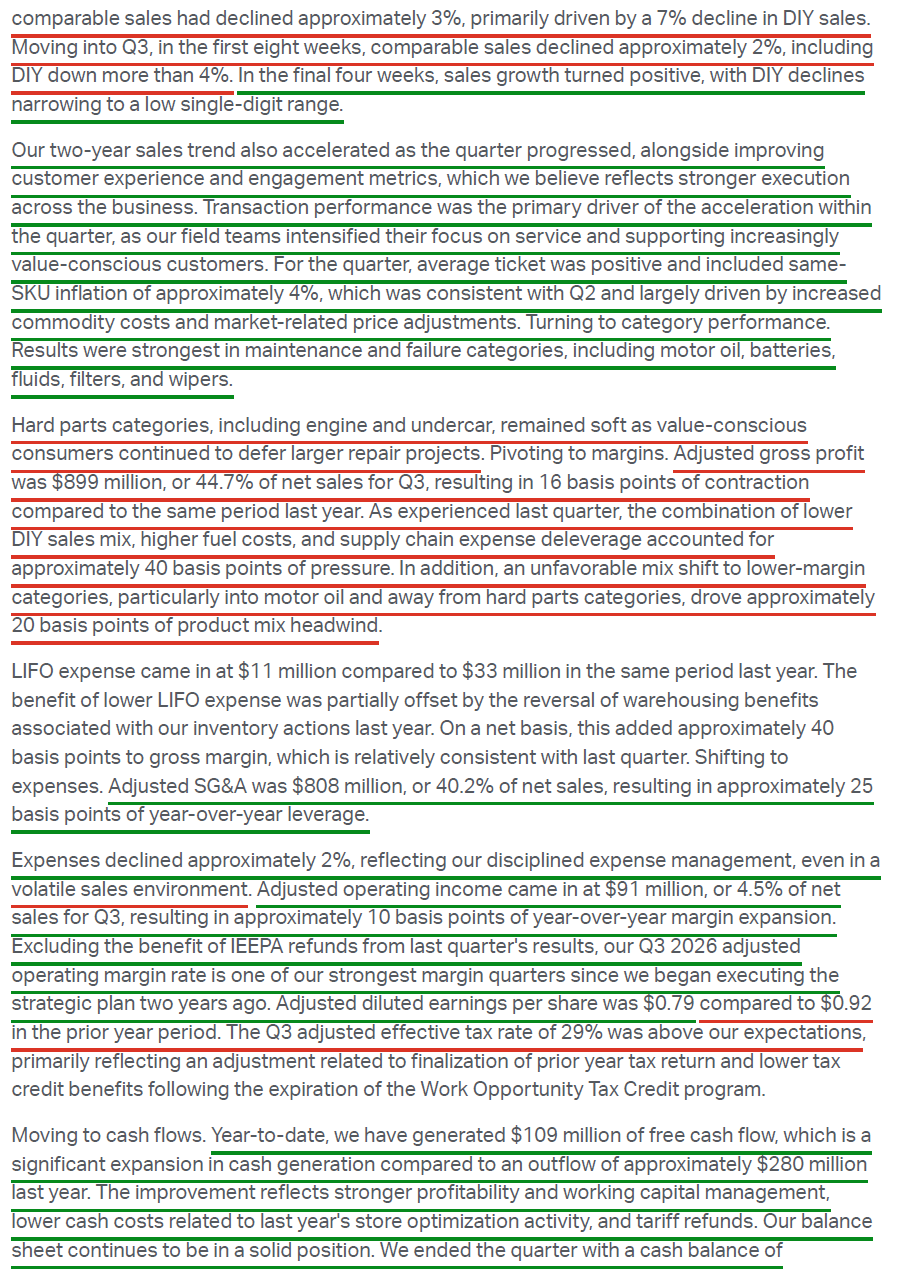
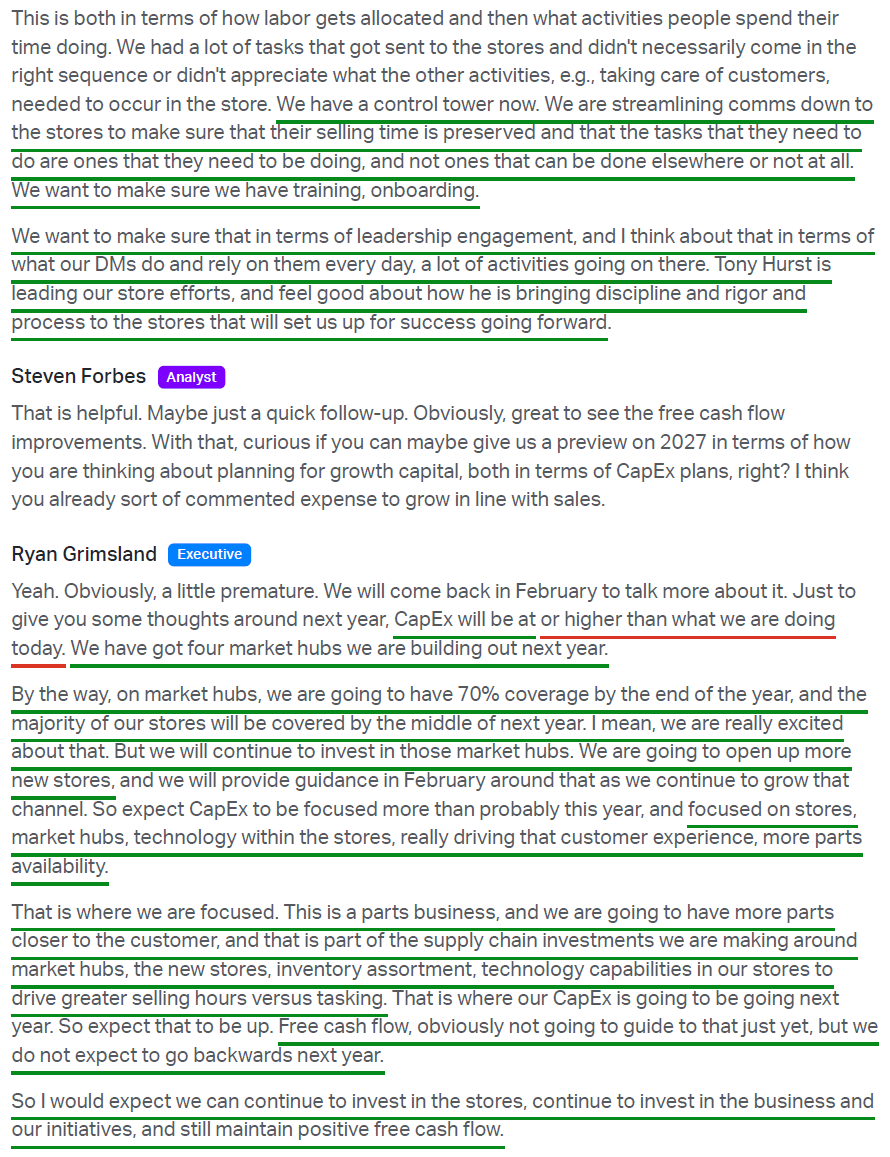
Advance’s third quarter was a tale of two halves, with a sluggish start giving way to improving trends and stronger execution across the business. Comp sales declined 1.2%, missing consensus expectations for a 0.4% increase and decelerating from Q2’s -0.5%, while revenue of $2.01B came in ~$30M below the Street. Profitability held up better, with adjusted operating income of $91M ahead of the $88.4M consensus estimate as adjusted operating margins expanded 10 bps Y/Y to 4.5%. Most importantly, management raised its full-year free cash flow guidance by 50% to ~$150M, an improvement of more than $400M Y/Y that will mark Advance’s first full year of positive free cash flow since FY2022.
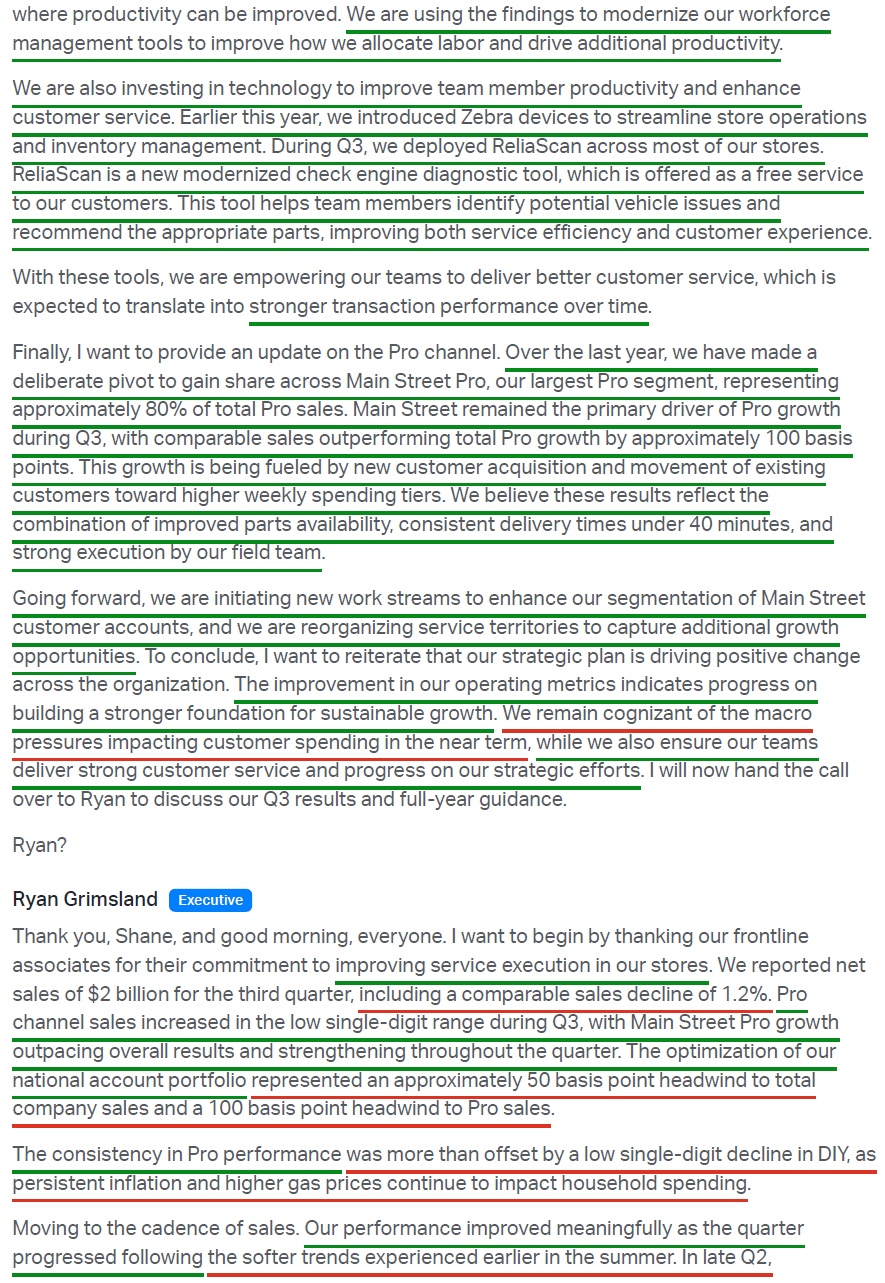
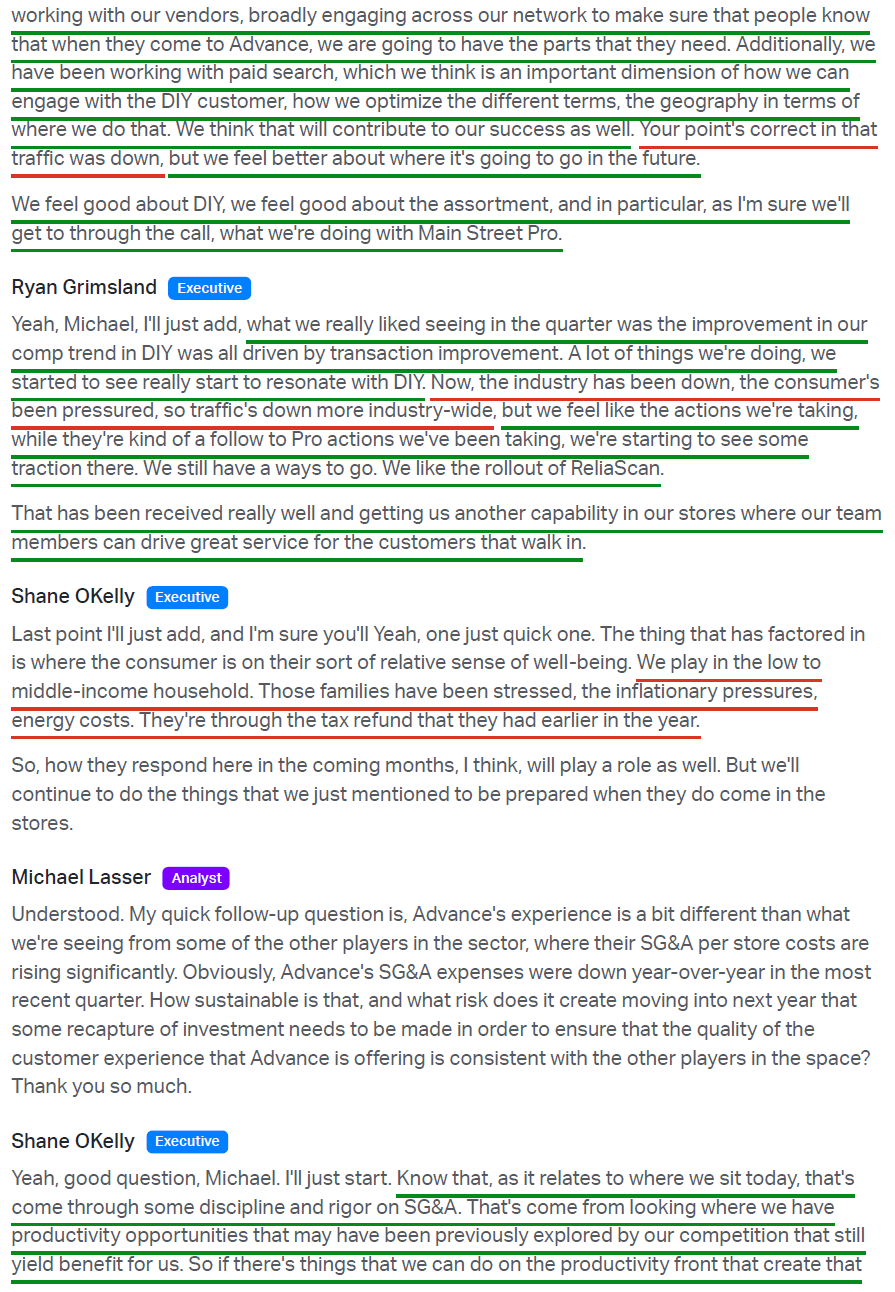
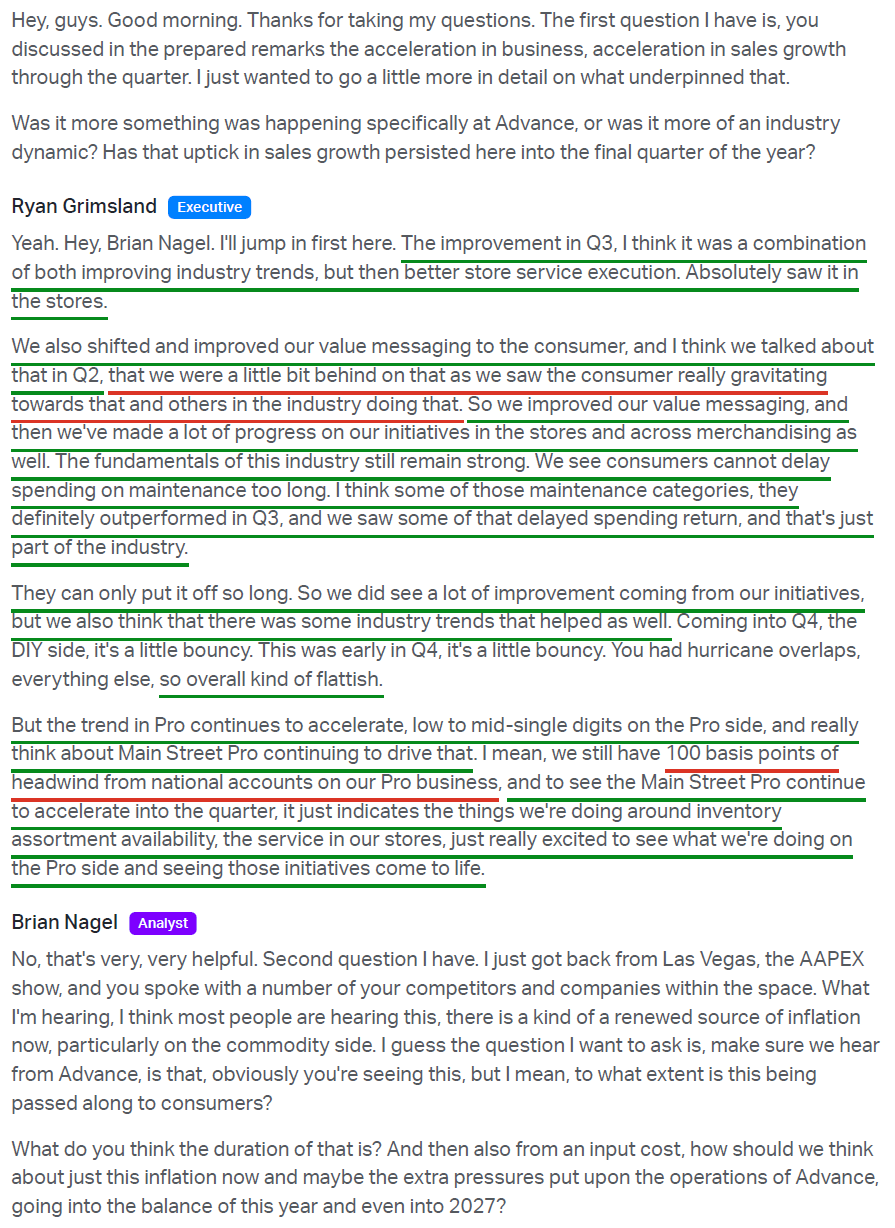
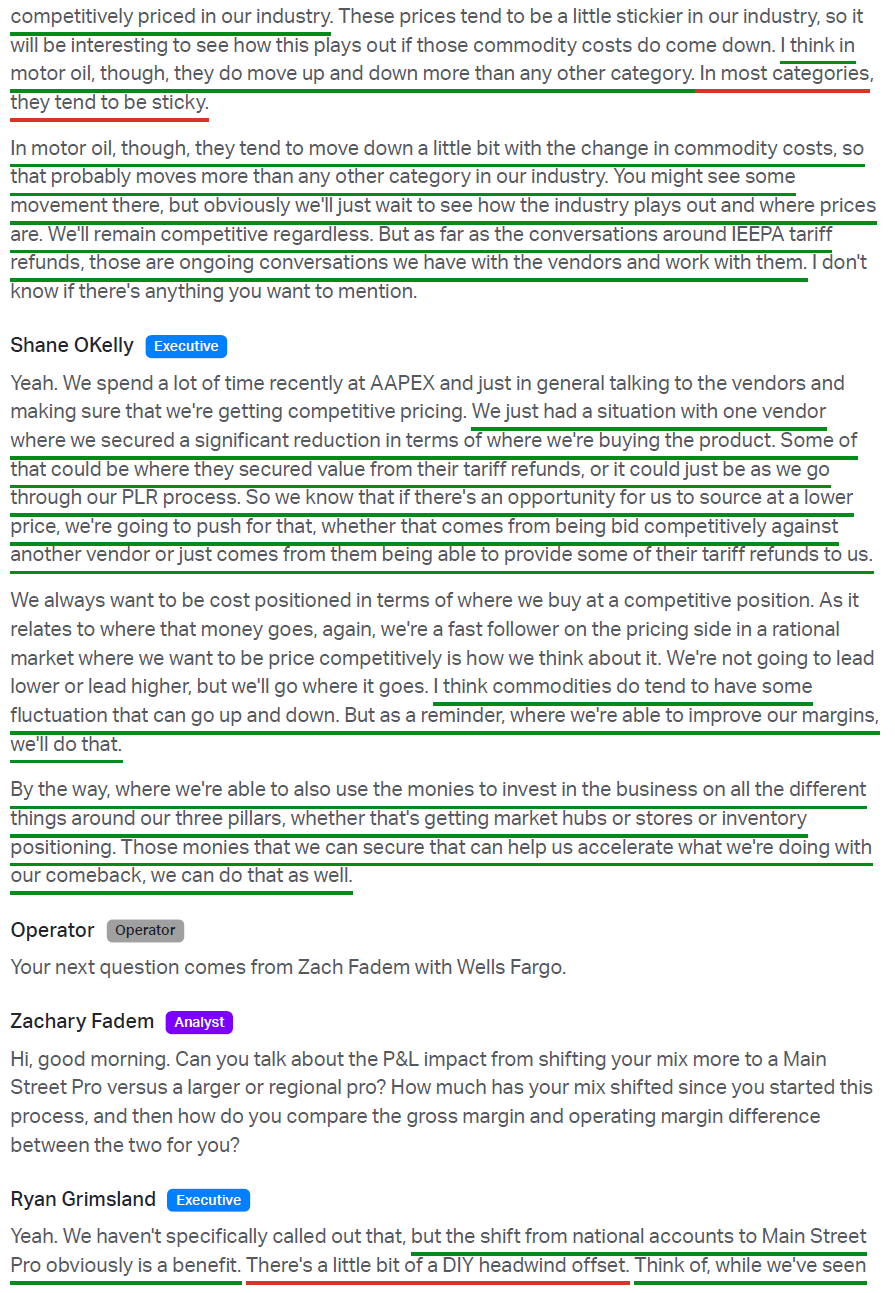
The weakness in the headline comp was largely a function of where the quarter started. The low point came in the final four weeks of Q2, which ended in mid-July, when comps declined ~3% on a nearly 7% drop in DIY, which management described as the channel’s weakest stretch of the year. From there, trends steadily improved, with comps down ~2% through the first eight weeks of Q3 before turning positive in the final four weeks as DIY declines narrowed to the low single digits. That momentum has carried into Q4, with Pro sales growing at a low-to-mid single-digit rate in the early weeks of the quarter, while management’s full-year comp guidance of ~1% implies further acceleration in overall comps.
That acceleration in Pro continues a trend that has been the steadiest part of the business all year. The channel, which accounts for ~half of sales, grew at a low-single-digit rate in Q3, remained positive every month, and reached ~3% growth in the final four weeks. Main Street Pro, the local two- or three-bay shops that account for ~80% of Pro sales and carry better margins, outpaced the overall channel by ~100 bps, driven by new customer wins and existing accounts moving into higher weekly spending tiers. That is the payoff from better parts availability and consistently getting deliveries out in under 40 minutes.
Keep in mind that reported Pro growth continues to understate the underlying strength, as management deliberately walks away from lower-margin national accounts to concentrate on Main Street. This self-imposed headwind weighed ~100 bps on Pro growth in the quarter (~50 bps on total sales). With that headwind set to roll off by early Q1, reported Pro growth should accelerate in 2027 even before accounting for any further improvement in the business.
DIY, the other half of the business, has been the harder fight. It’s no secret that Advance caters to the lower- and middle-income consumer, and with DIY accounting for ~half of sales, pressure on that customer is hard to miss in the comp. That matters for margins as well as sales, as DIY is Advance’s highest-margin channel, meaning any recovery would bring a mix tailwind alongside it. The channel declined at a low-single-digit rate in Q3, yet nearly every metric tied to O’Kelly’s initiatives continued to move in the right direction. Better training, service, and in-store execution pushed Net Promoter Scores above 80 from the high 70s last quarter, while in-store attachment rates climbed to the mid-30% range from ~30% and DIY units per transaction grew at a low-single-digit rate, driving average ticket growth above same-SKU inflation.
Management is pulling every internal lever available, from the Advance Rewards loyalty program, paid search optimization, and sharper value messaging to the ARGOS private label for customers trading down. Meanwhile, ReliaScan, a free check-engine diagnostic tool, rolled out across most stores during the quarter, and Zebra devices in every store are shifting team member hours from back-room tasks to selling. These encouraging signs tell us that Advance’s internal initiatives are working and translating into better results when customers come through the door. The next step is getting more customers through it.
That is where the macro backdrop is finally starting to turn in Advance’s favor. Much of the pressure on its core customer this year has come down to pain at the pump, with energy accounting for 17.4% of pre-tax income for the bottom 20% of earners, the bulk of which is gasoline, versus just 2.7% for the top quintile.
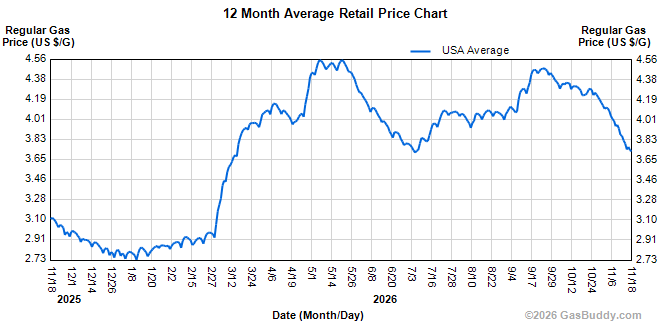
Gas prices rolled over in late September and have been falling steadily since, dropping ~$0.75 a gallon from the peak to a national average of $3.75, an eight-month low, with RBOB gasoline futures now below $2.50, pointing to more relief ahead.
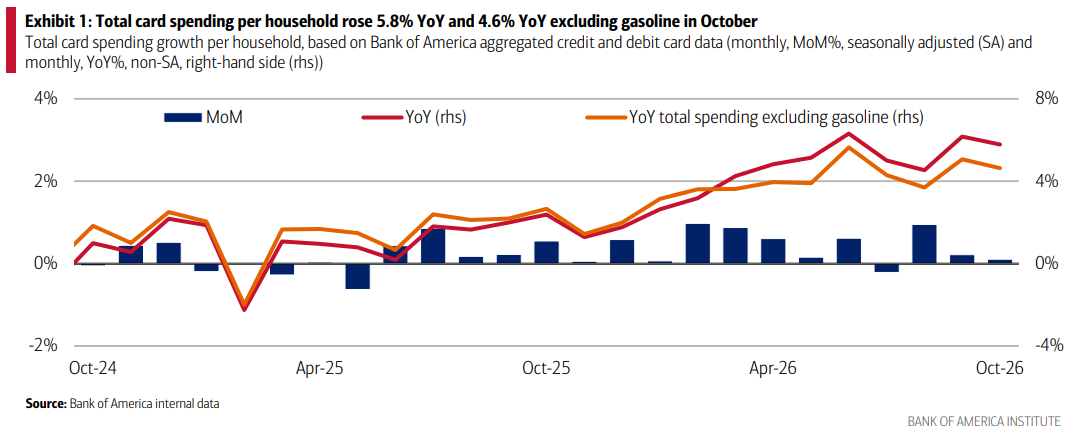
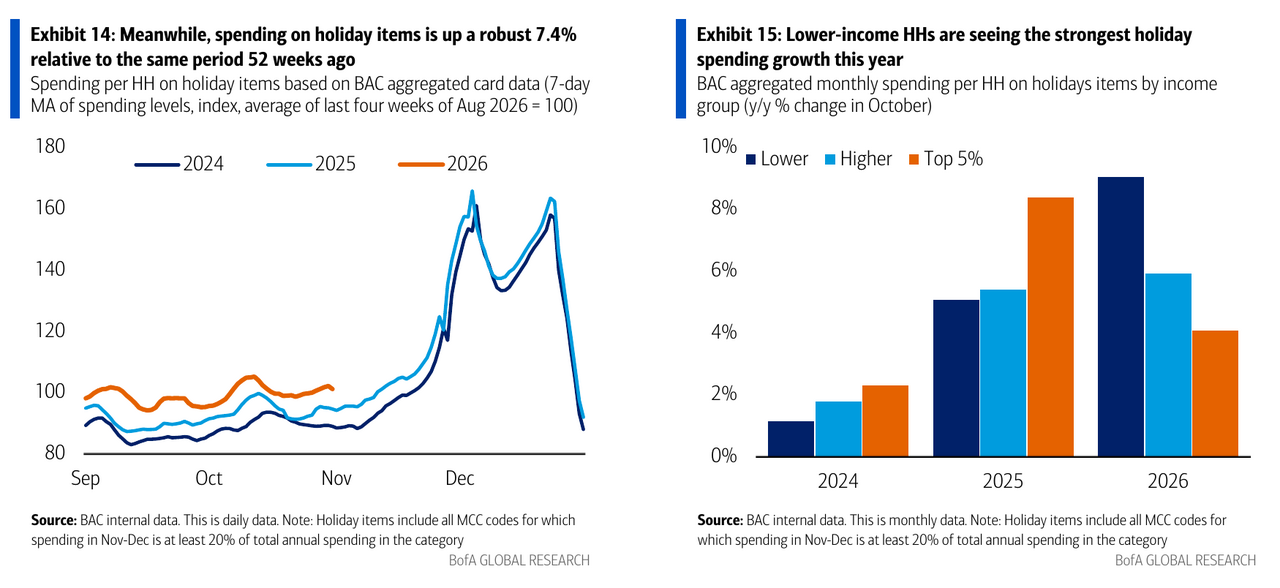
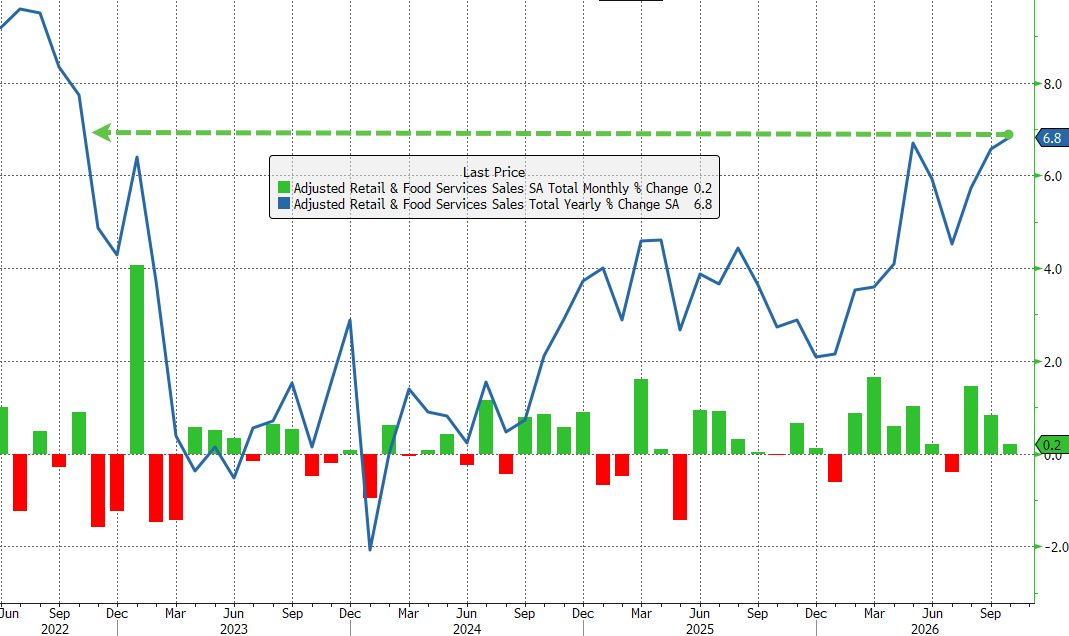
The spending data responded almost exactly as you would expect. BofA data show lower-income households posted the strongest total card spending growth of any group in October at +5.9%, while holiday spending by lower-income households, which trailed every other cohort in October of both 2024 and 2025, is now up ~9% Y/Y. Broader October retail sales confirmed the strength, rising 6.8% Y/Y for the strongest annual gain since October 2022.
Source: ZeroHedge
Lower gas prices will continue to bring inflation expectations down, which goes hand in hand with consumer sentiment, as seen below:
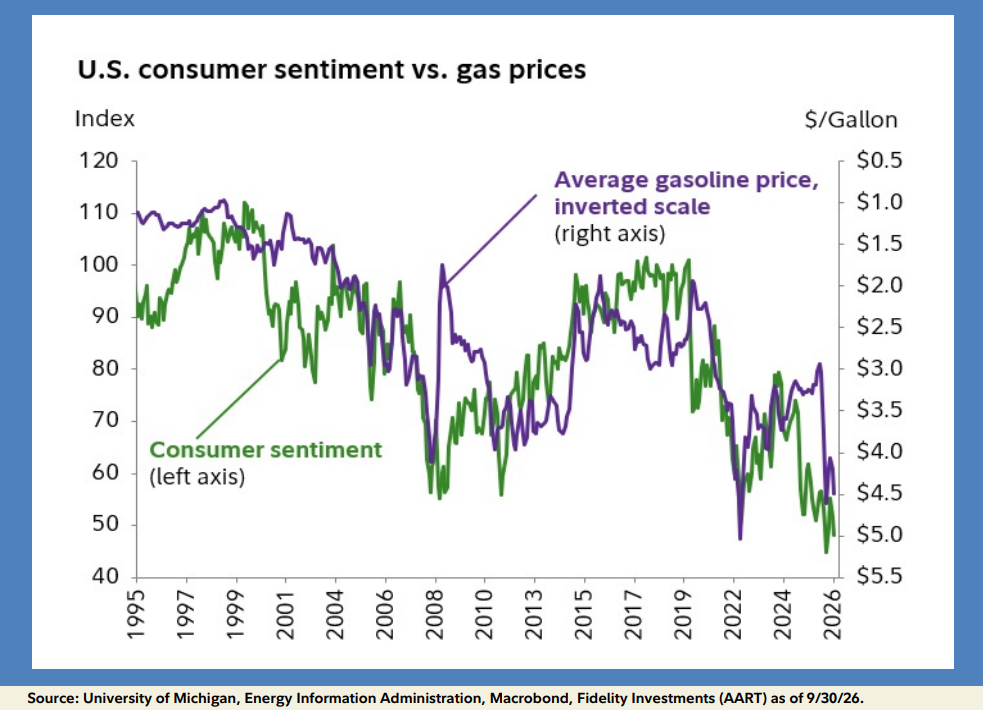
Less pain at the pump points to a lift in sentiment from today’s washed-out levels, with the UMich index at 48 in October, within a stone’s throw of May’s reading of 44.8. If May does ultimately prove to be the trough, the historical data is encouraging: following the last nine sentiment troughs, the S&P 500 delivered an average 12-month return of 24.1%. The point is, these are the times to be BUYERS of beaten-down consumer names, not SELLERS.
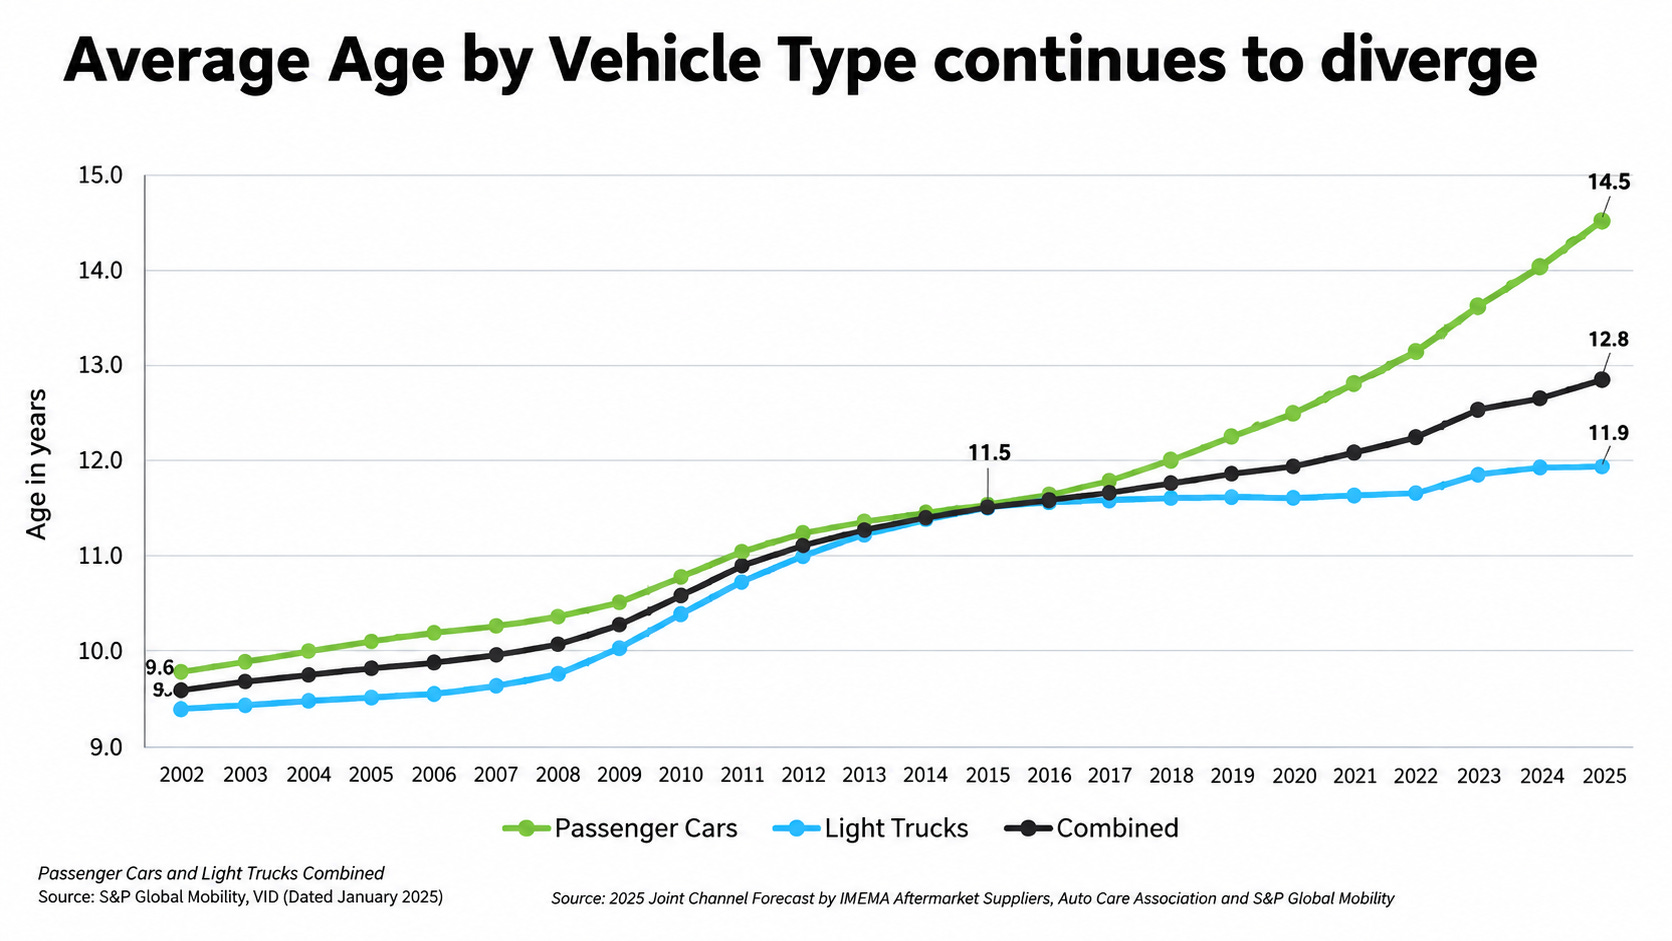
Beyond the consumer backdrop, ~90% of what Advance sells is tied to maintenance and break/fix needs. Q3 strength came from maintenance and failure categories like motor oil, batteries, and wipers, while hard parts remained weak as customers put off larger repairs. But deferred maintenance can only be kicked down the road for so long. The average age of U.S. light vehicles reached a record 12.8 years in 2025 and is expected to hit 13.0 years this year, with more than 110M vehicles now sitting in the prime aftermarket service window of 6 to 14 years. That represents nearly 38% of the fleet, a share S&P Global expects to reach ~40% by 2028.
In the meantime, management continues to control what it can, with the supply chain remaining the centerpiece of that effort. The distribution network has been consolidated from nearly 40 facilities running multiple systems to 15 operating on a single warehouse management platform, with process improvements rolling through each DC in stages through mid-2027 to lower handling costs, improve shipment accuracy, and shorten lead times. Carrier contracts have also been rebid, consolidating volume across 70% fewer carriers for 20+ bps of cost savings, even in a flattish sales environment.
The market hub network, modeled on the hub-and-spoke system that best-in-class peers have used for years, reached 46 locations following 13 openings YTD, with 70%+ of stores set to sit inside a hub ecosystem by year end and ~60 hubs expected to serve the majority of the store base by mid-2027. Each hub carries ~85,000 SKUs for same-day availability, with hub markets historically delivering ~100 bps of comp lift.
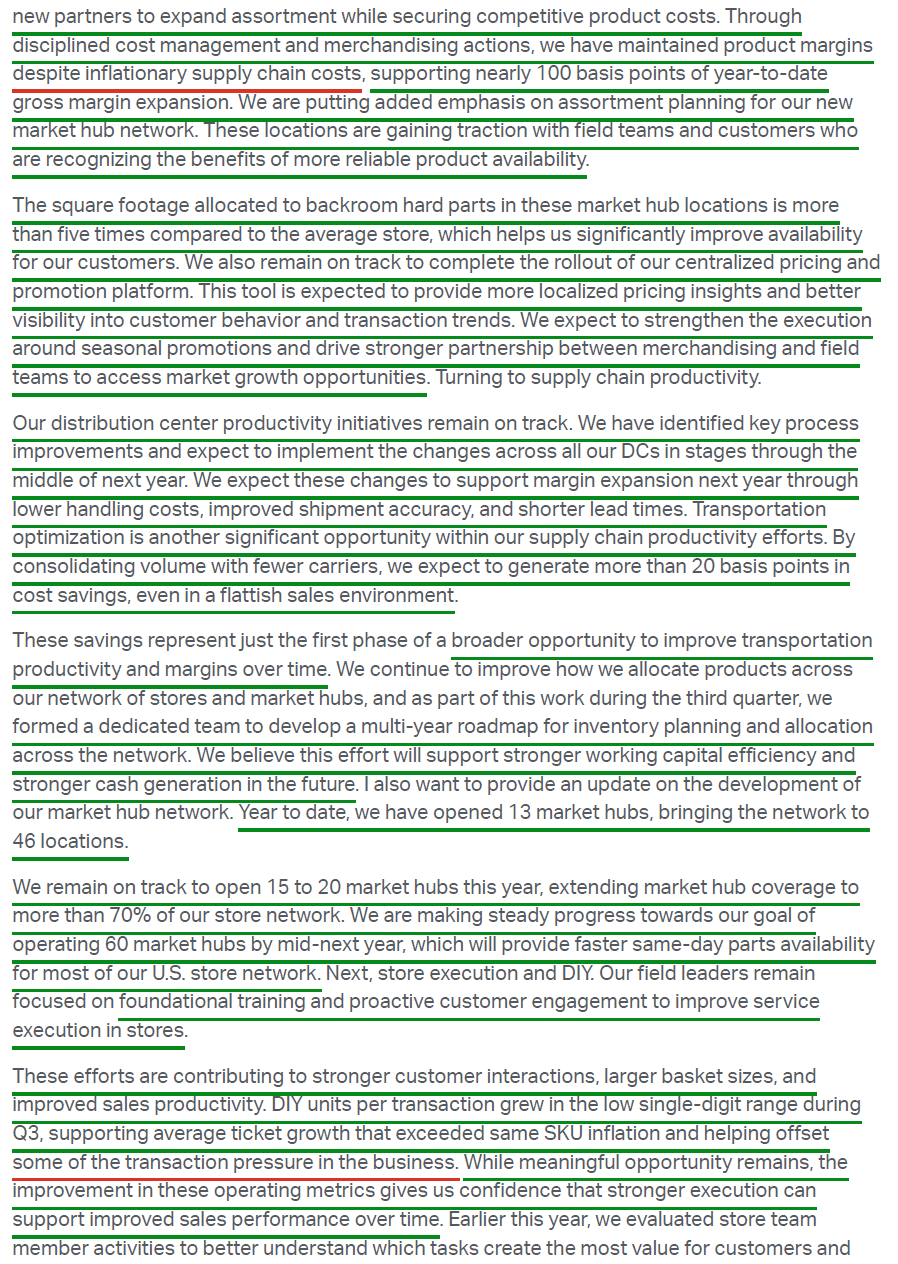
These self-help initiatives across the supply chain, merchandising, and stores have already driven significant margin improvement with very little help from the top line. Advance delivered a 4.5% adjusted operating margin in Q3 despite a negative comp, with SG&A dollars down ~2% Y/Y. Management noted that, excluding the tariff refunds received last quarter, it was one of the strongest margin quarters since the strategic plan began two years ago. Zooming out, adjusted operating margins have climbed from a trough of 0.4% in FY2024, the weakest level in more than 20 years, to 2.5% in FY2025 and ~4.15% at the midpoint of FY2026 guidance. That progress has come alongside comp growth of just 0.8% last year and ~1% this year.
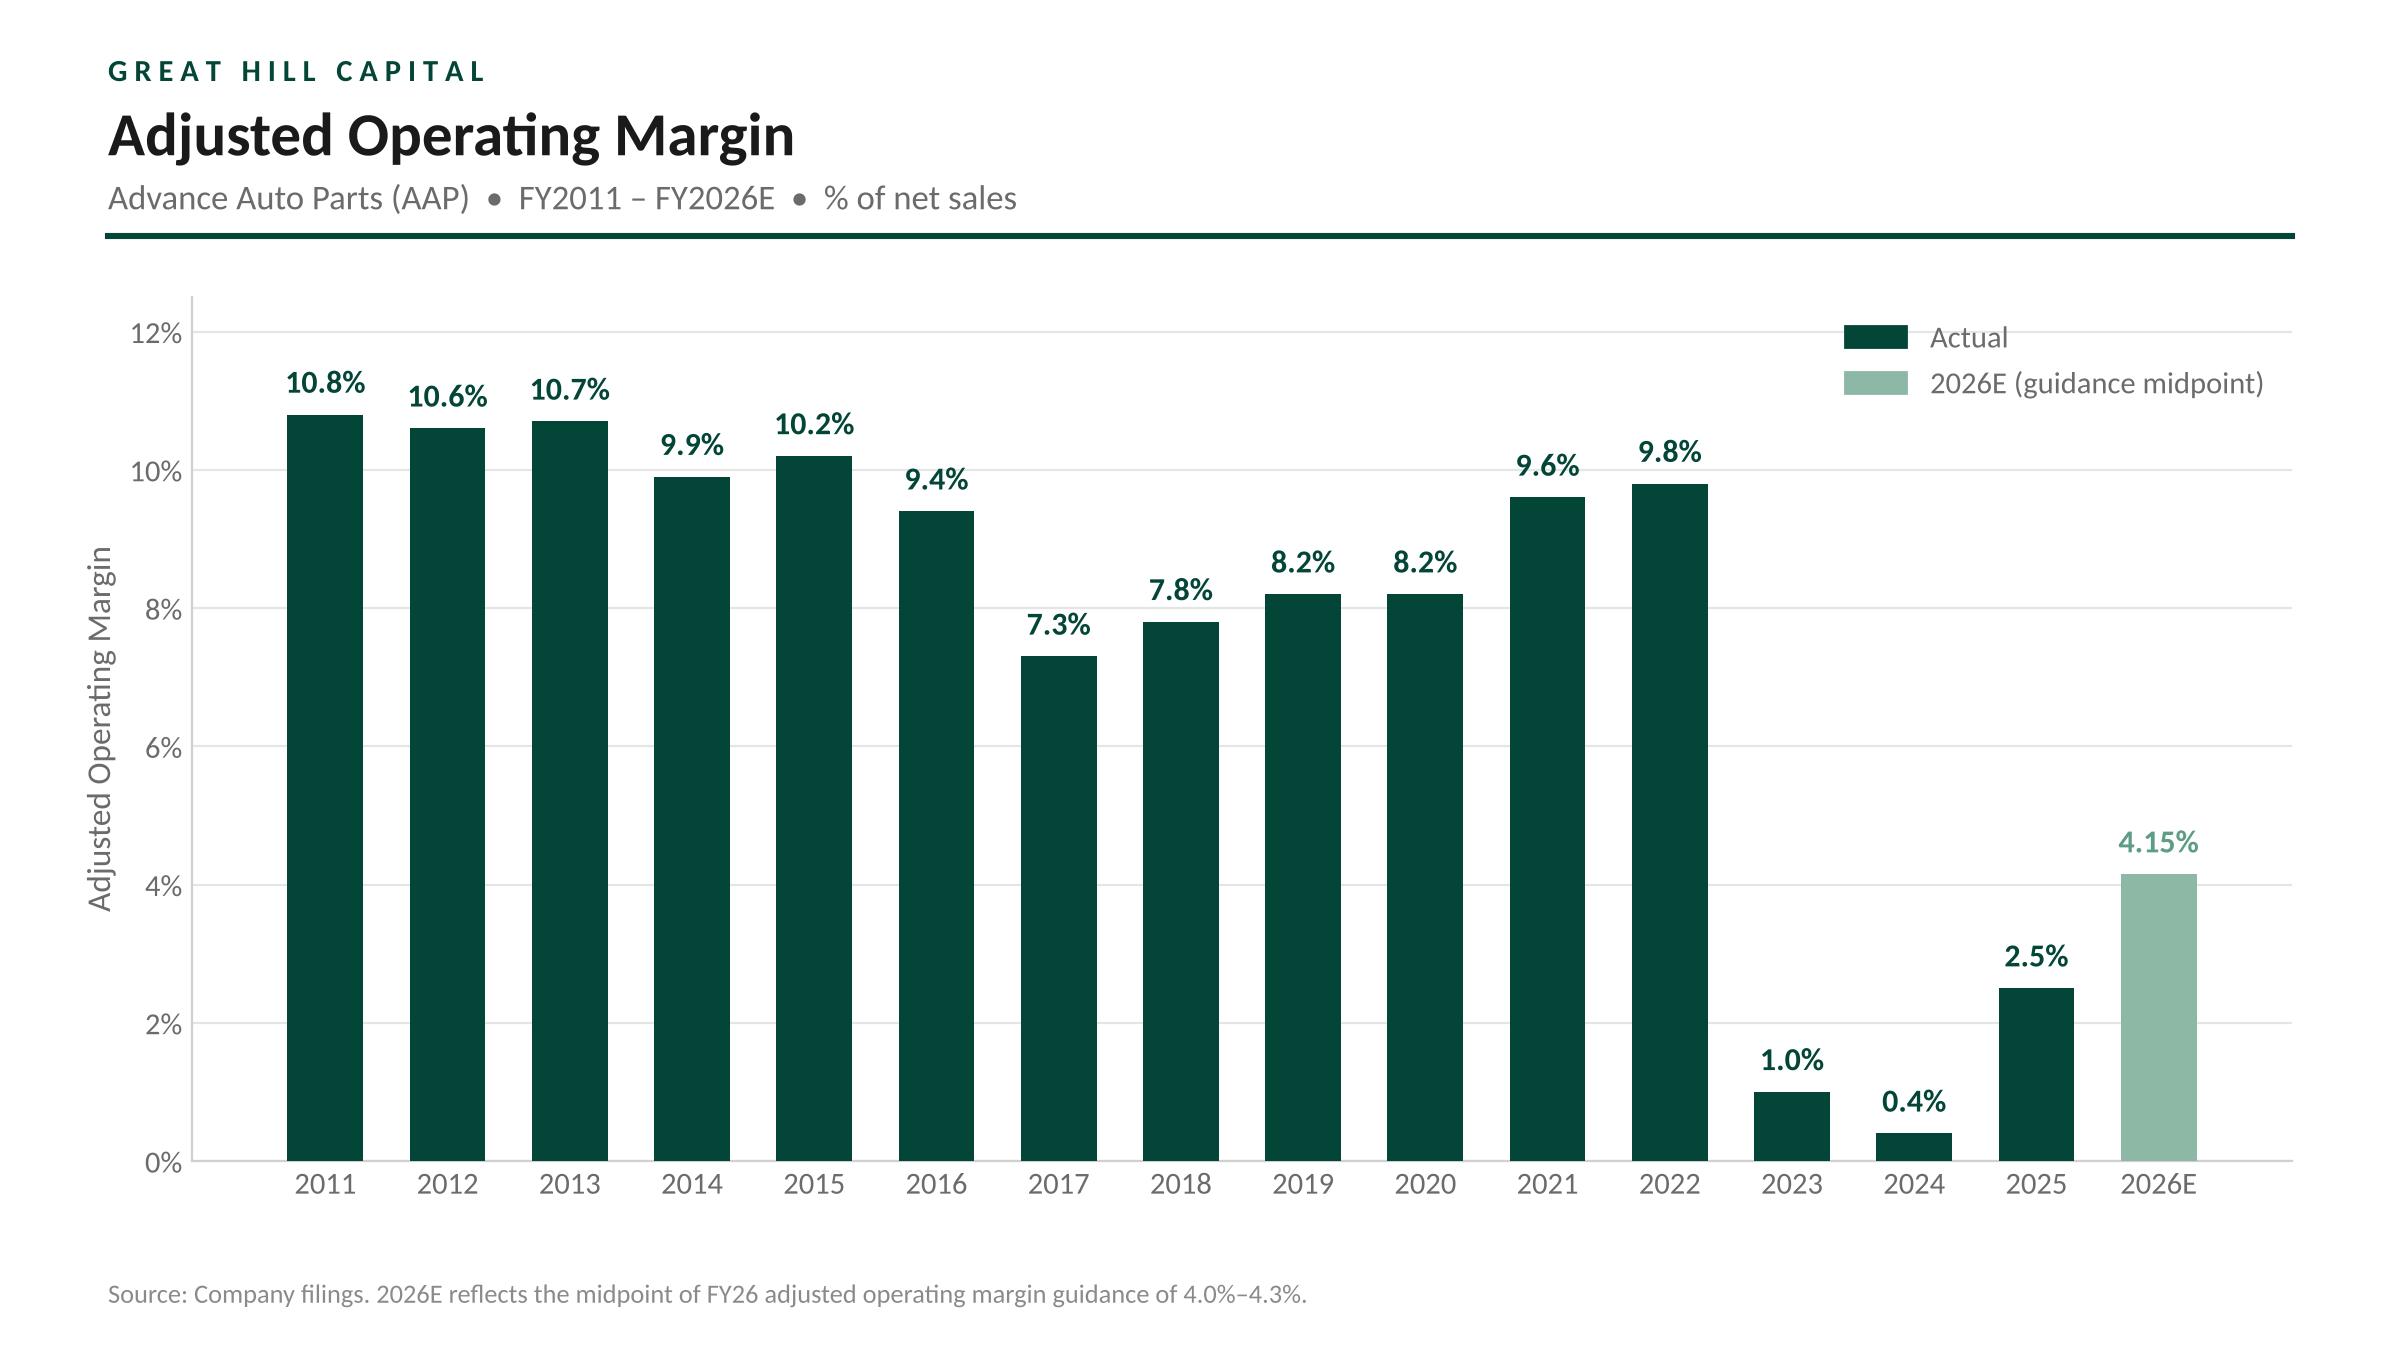
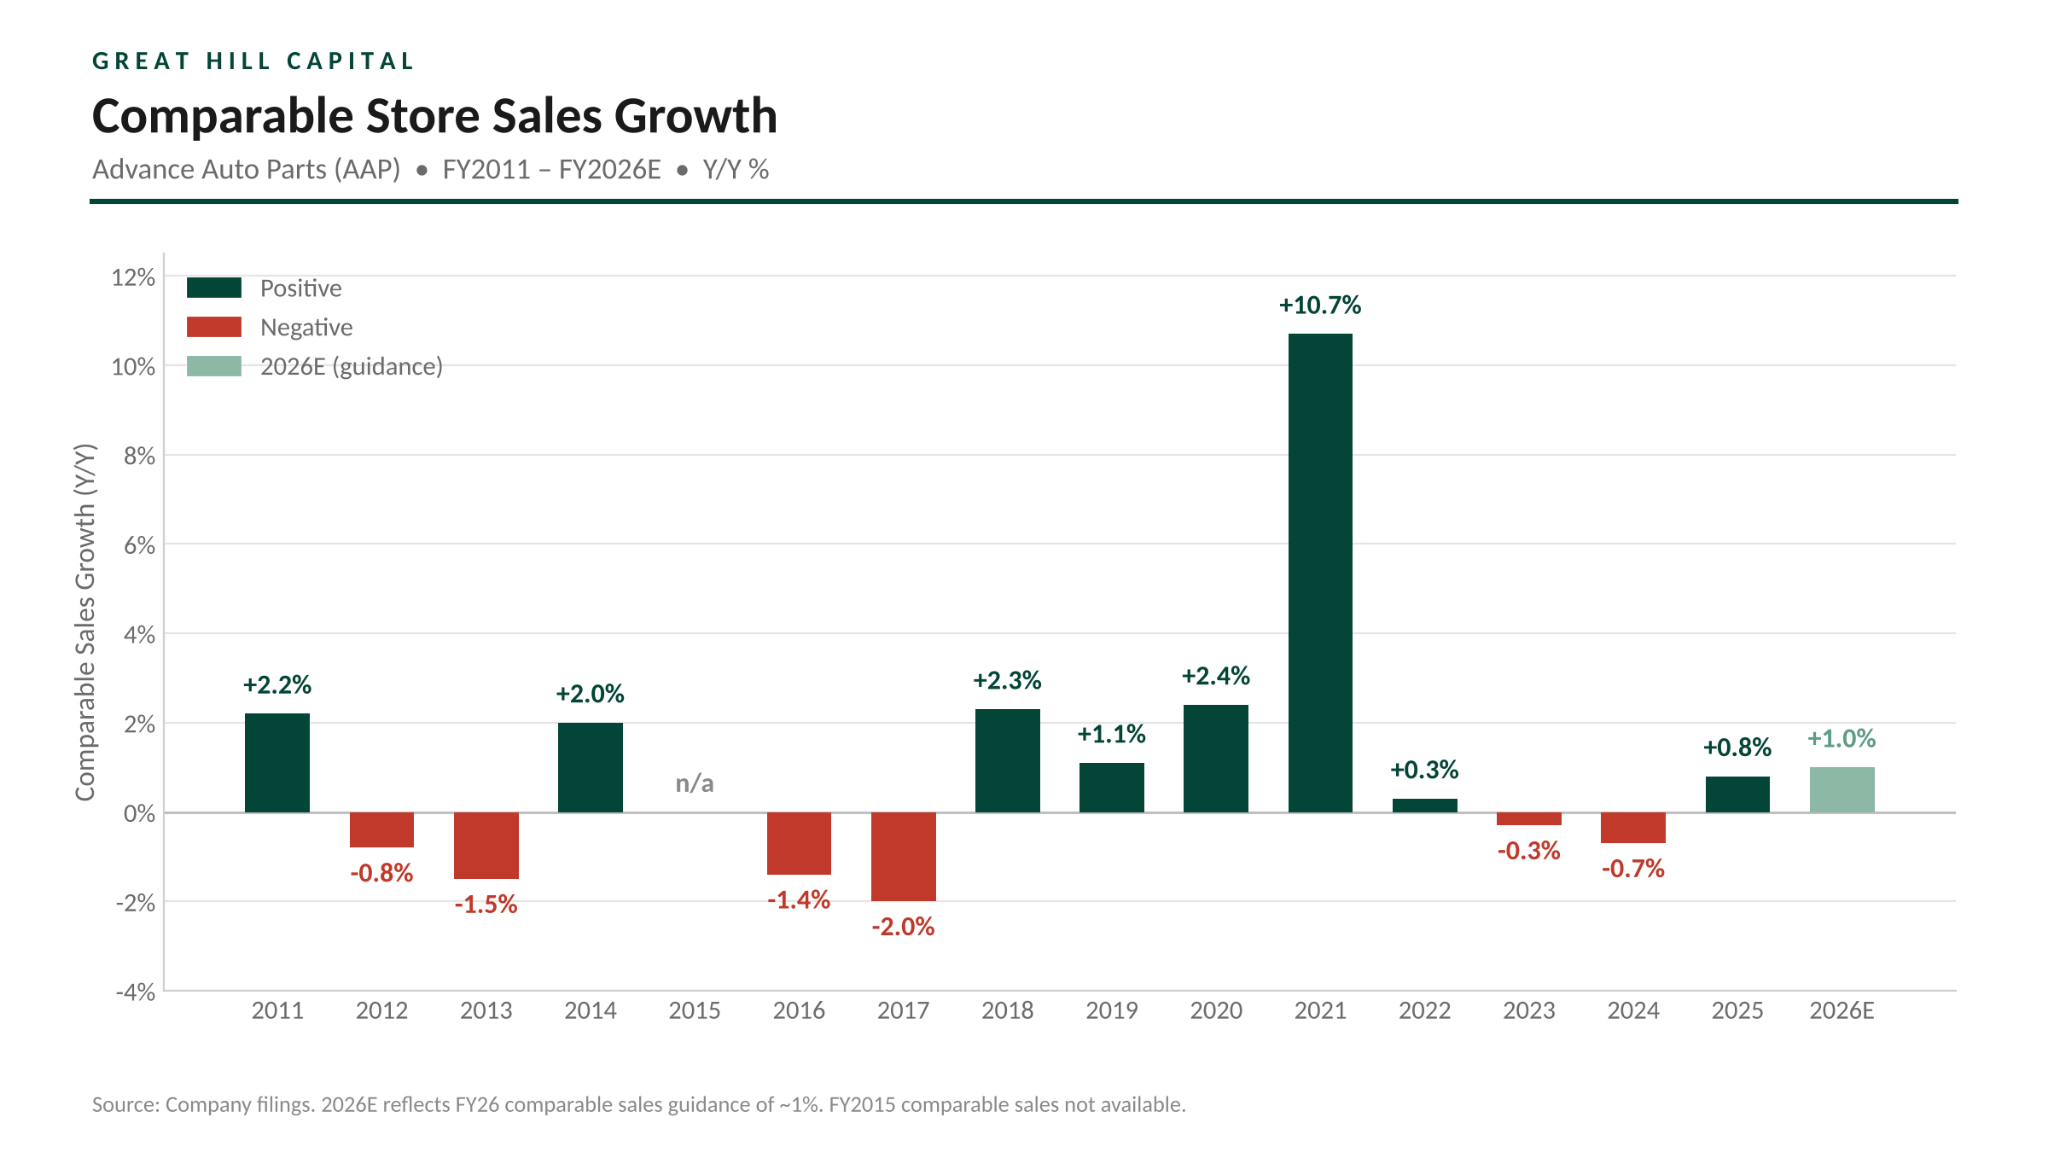
For 2027, management continues to expect at least another 100 bps of margin expansion, but guided investors to build off the second half of this year rather than the full year, given ~30 bps of tariff refunds that won’t repeat and fuel and deleveraging pressures likely to linger into the first half. That puts next year’s adjusted operating margin at ~4.7%, driven by merchandising initiatives, labor productivity, and supply chain savings, including 20+ bps from transportation.
More consistent comp growth remains the missing piece of the turnaround and the key to unlocking Advance’s longer-term margin potential. The original roadmap assumed steady low-single-digit comp growth, which has been slow to materialize, pushing out the timeline to management’s still-intact medium-term operating margin target of 7%. The good news is that, with its national account headwind behind it and a stronger Pro business, alongside even a modest recovery in DIY traffic, Advance has what we believe is its strongest top-line setup since the turnaround began.
At a 7% margin on ~$9B of revenue, Advance would generate ~$630M of operating income, a level we believe supports close to $7 per share in normalized earnings power, more than double the current run rate. For context, Advance generated 9% to 11% operating margins before the missteps that derailed the business, while O’Reilly and AutoZone operate at 18% to 20% today, leaving plenty of room to close the gap.
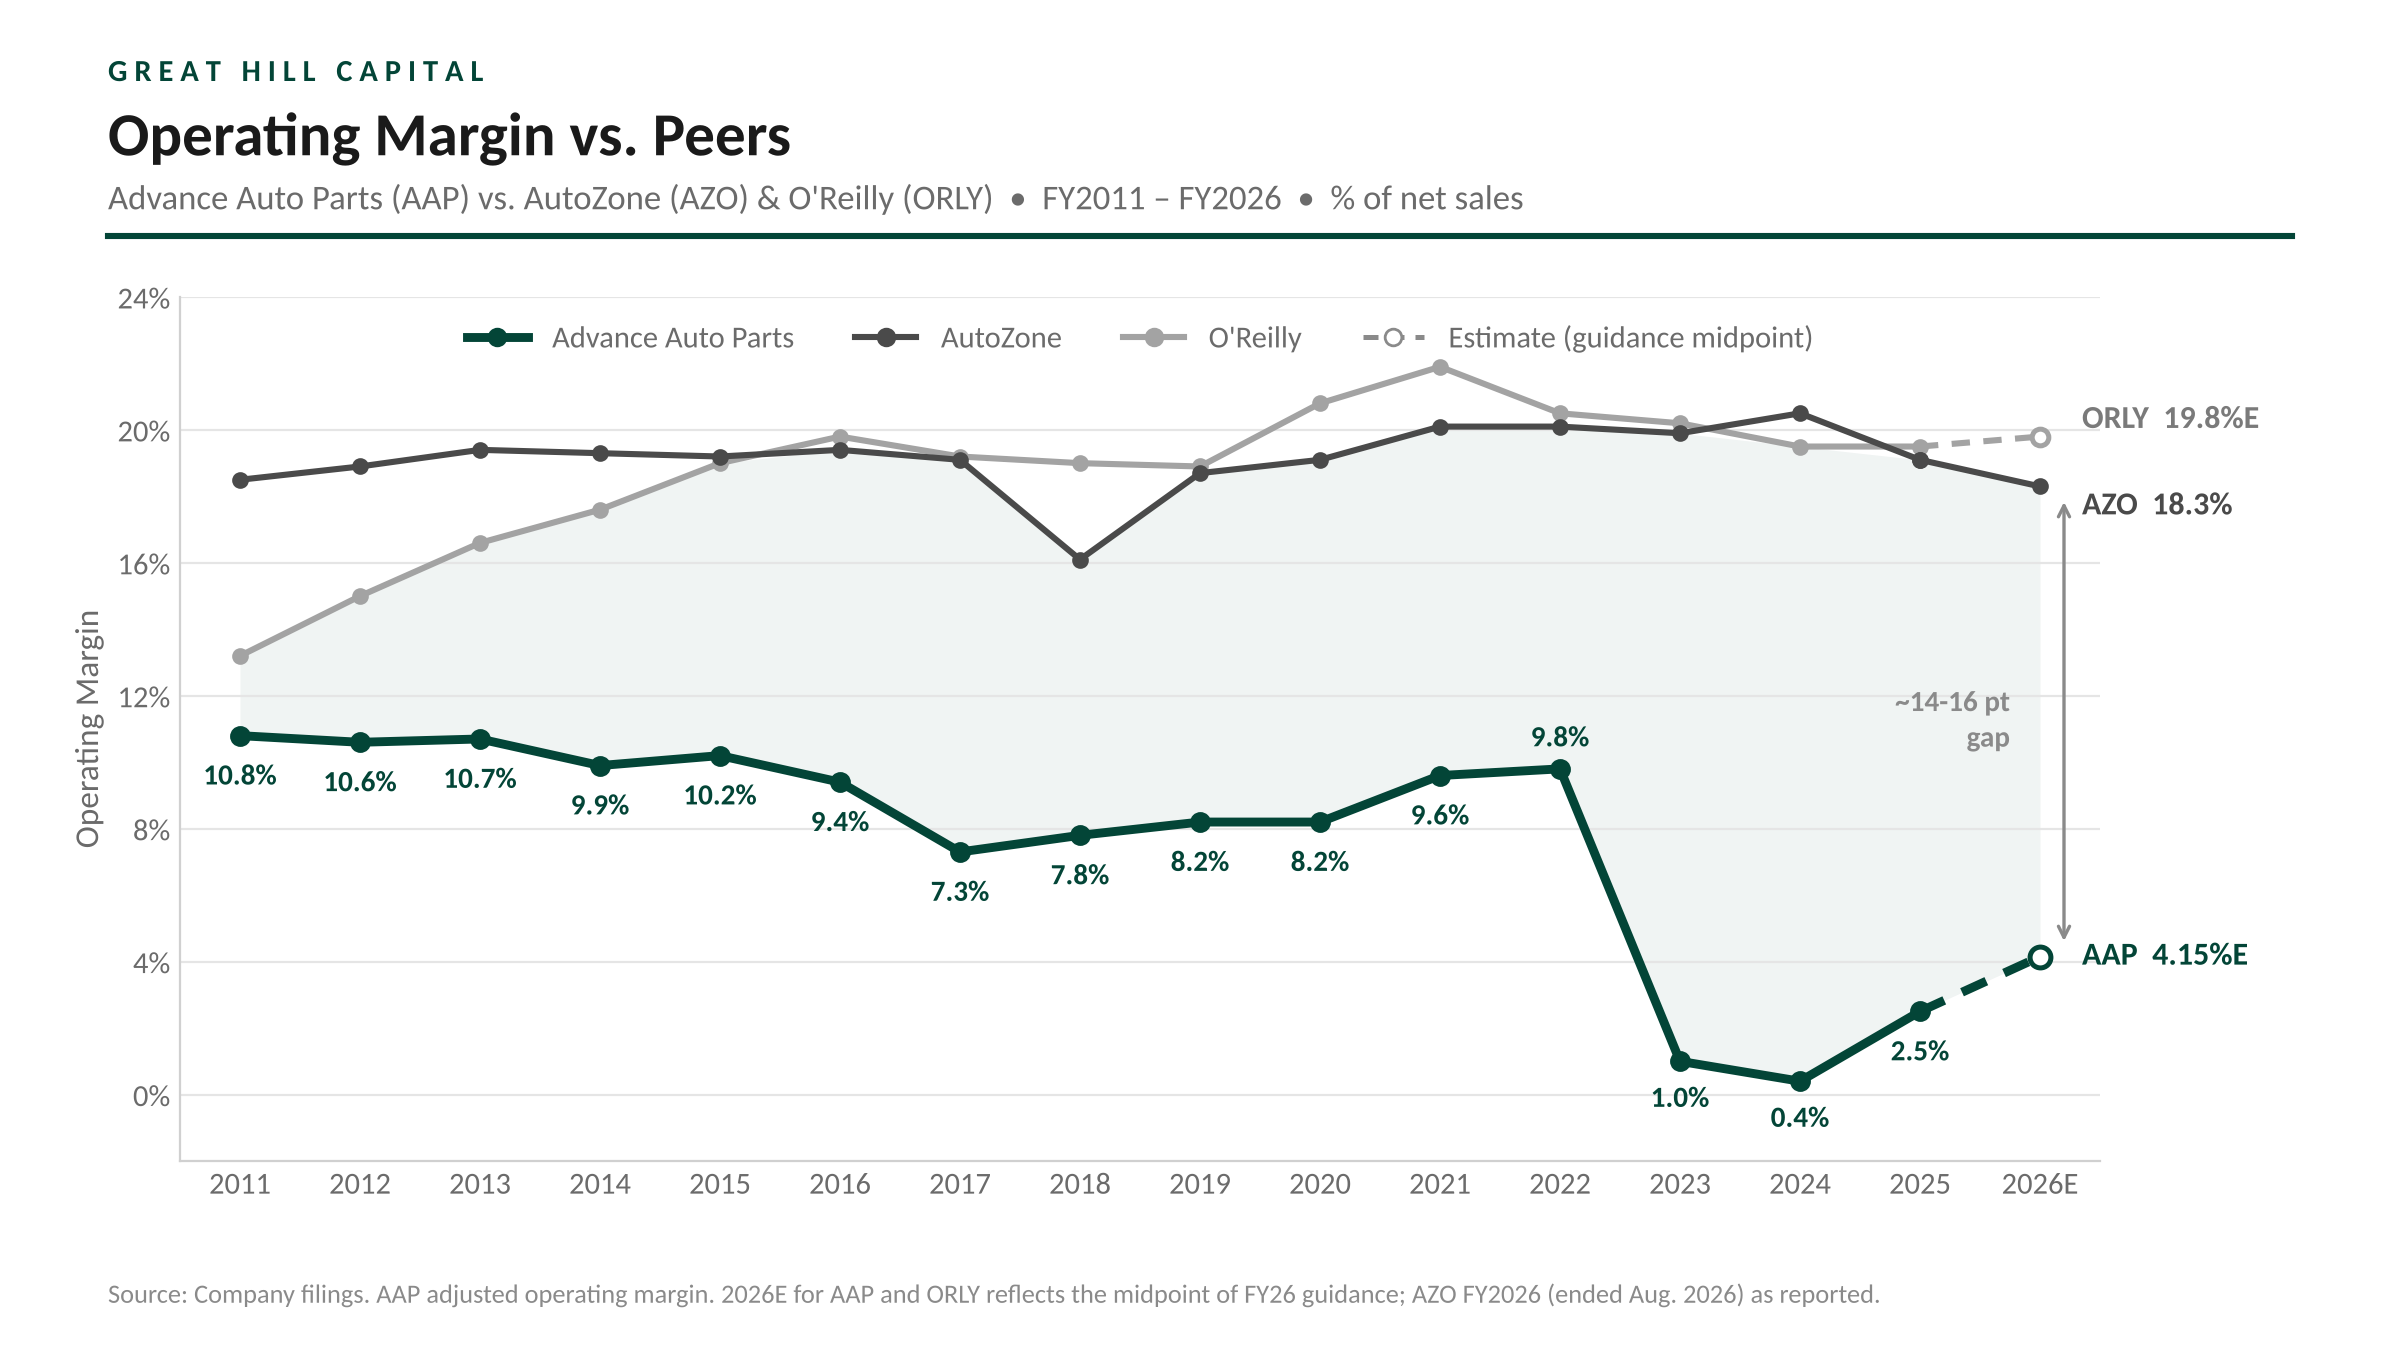
Meanwhile, the importance of the free cash flow inflection can’t be overstated. YTD free cash flow sits at +$109M versus an outflow of $277M last year, with the raised ~$150M full-year target coming even as capex steps up to ~$300M to fund new market hubs, new stores, store upgrades, and in-store technology. Management expects free cash flow to improve again in 2027, even with capex at or above this year’s level. That cash gives Advance the flexibility to keep investing in growth while chipping away at its debt, supporting the goal of returning to investment grade and eventually resuming share buybacks.
While the market has grown impatient waiting for the turnaround to move faster, we believe it underappreciates how much of the foundation has been rebuilt over the past few years and the upside that creates. At just 12.7x forward earnings, the bar is low enough that modest top-line improvement and consistent execution will be enough to move the stock. With much of the heavy lifting behind it and the road ahead starting to clear, Advance looks well positioned for a stronger 2027.
Q3 Earnings Breakdown

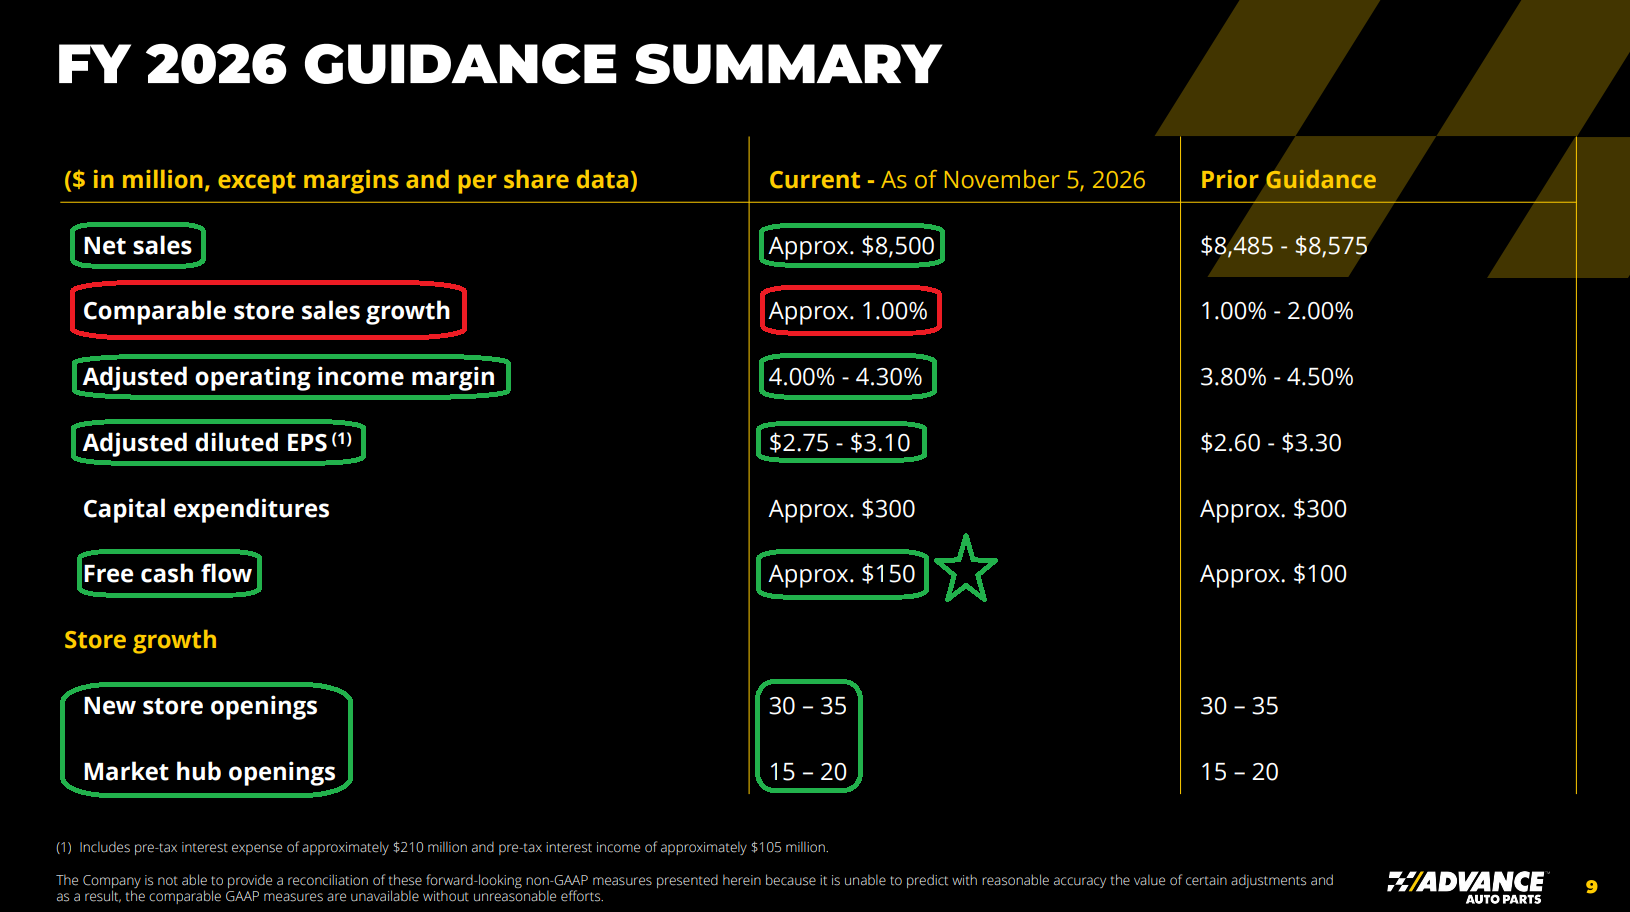
10 Key Points
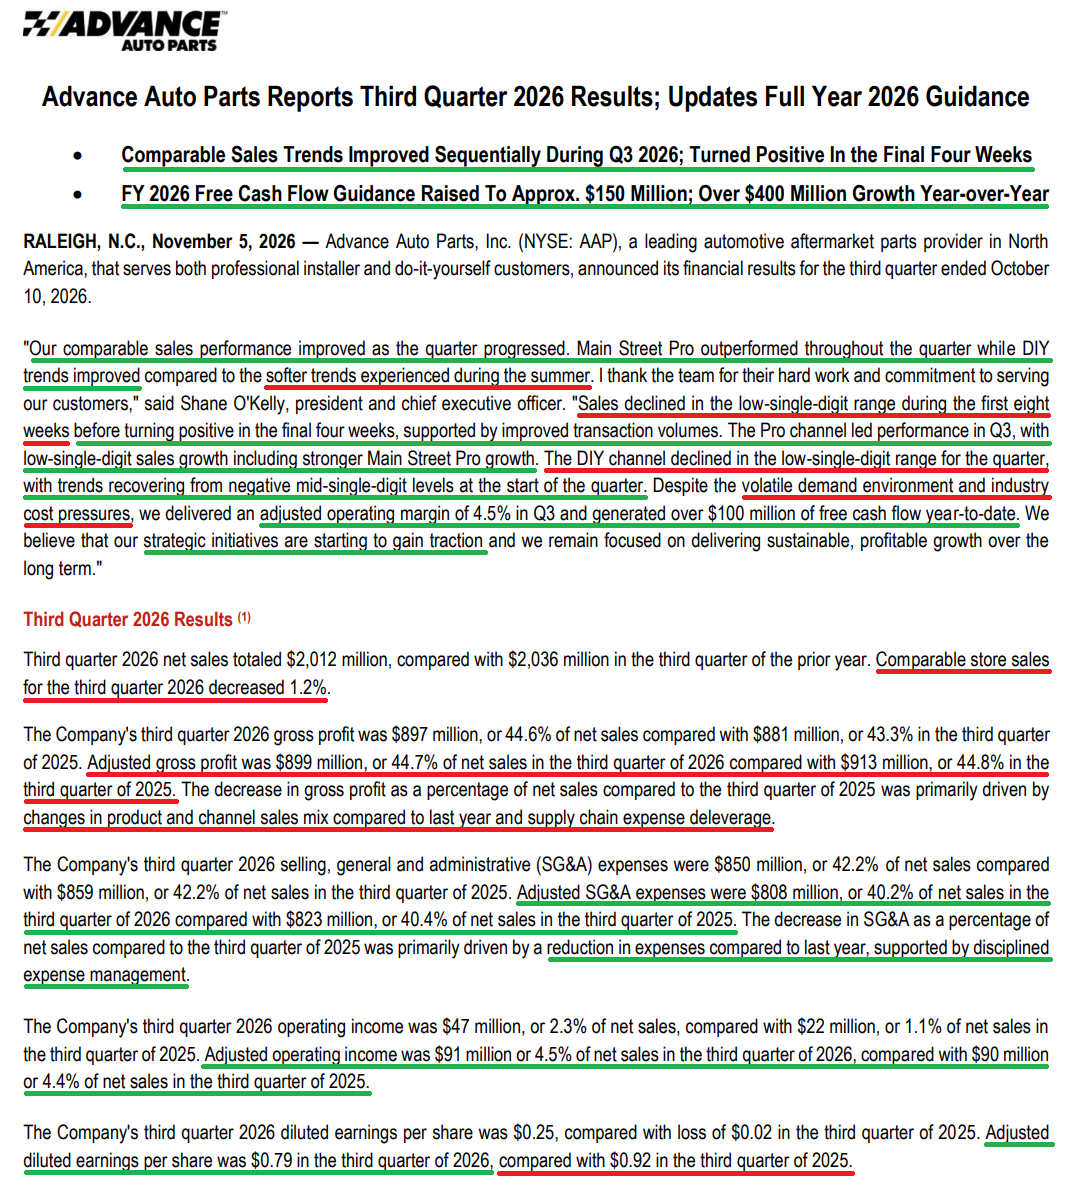
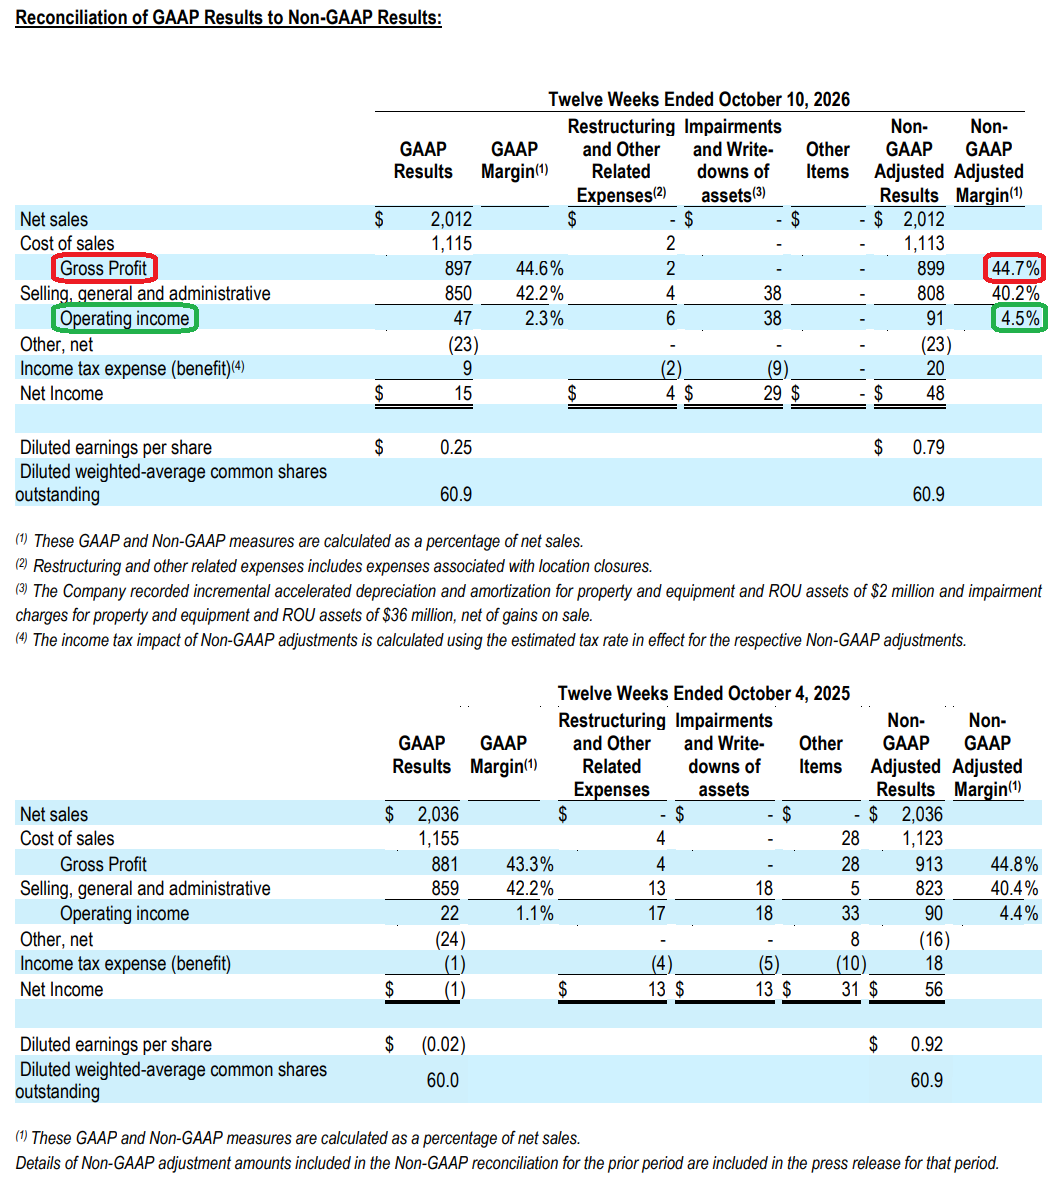
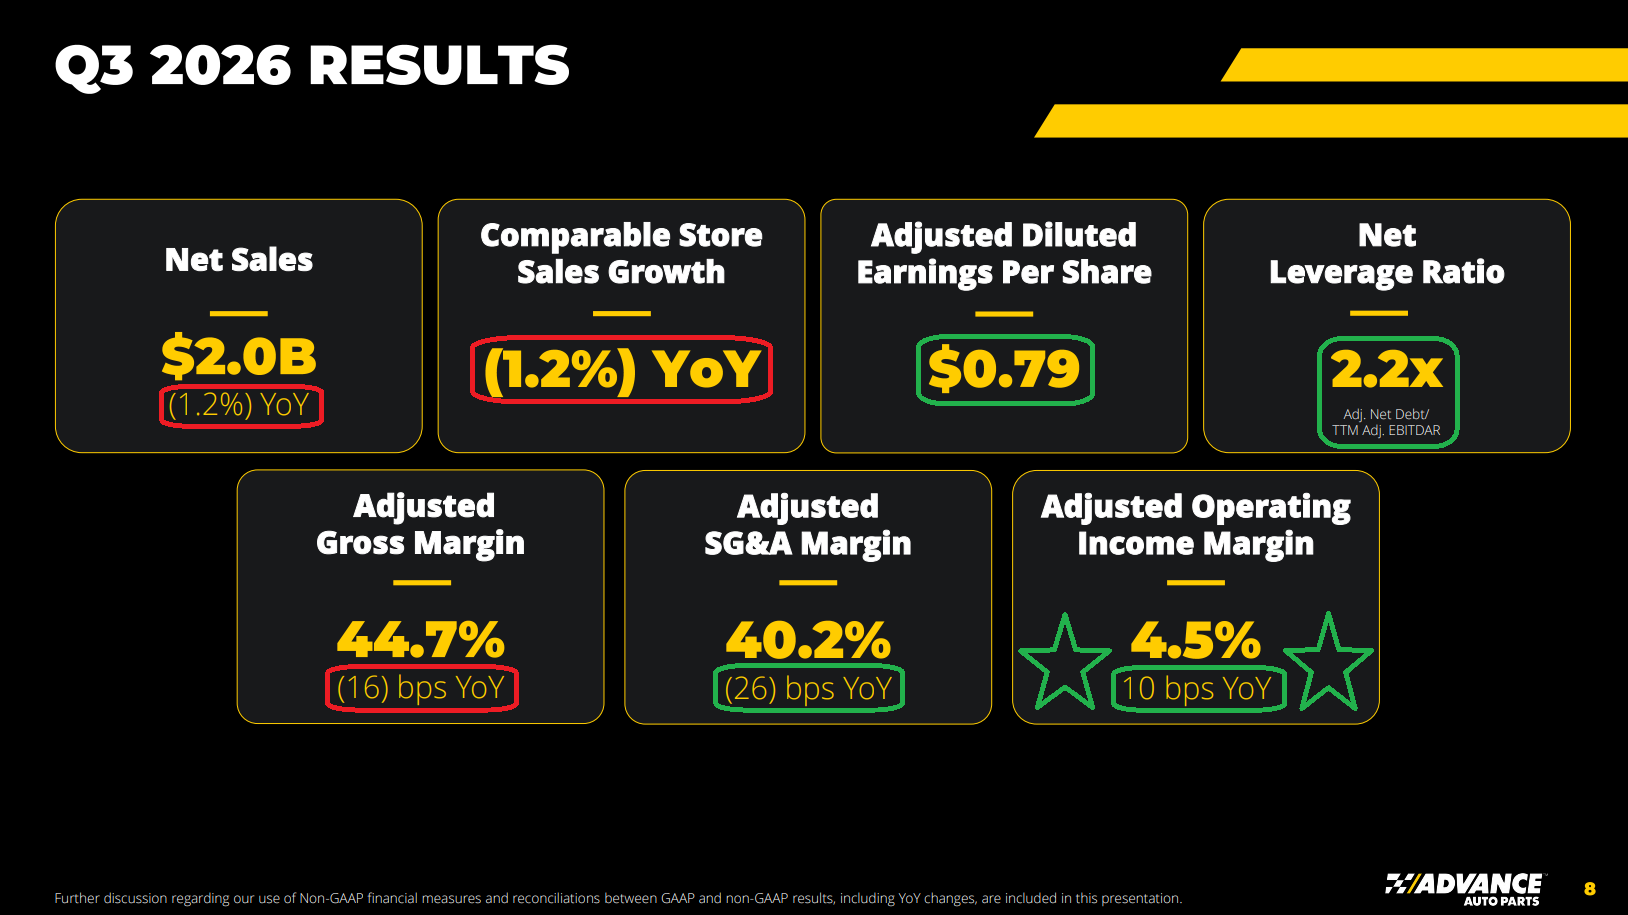
1) AAP delivered $2.01B in revenue (-1.2% Y/Y), missing the $2.04B consensus estimate by ~$30M, with comp sales declining 1.2%. Trends improved as the quarter progressed, with comps down ~2% through the first 8 weeks before turning positive in the final 4 weeks on improved transaction volumes. Average ticket was positive, including ~4% same-SKU inflation driven by commodity costs, with motor oil alone contributing ~100 bps. Adjusted diluted EPS of $0.79 came in ahead of the $0.78 consensus estimate, versus $0.92 last year (-14.1% Y/Y), weighed down by a higher adjusted tax rate. YTD adjusted EPS reached $2.59 versus $1.40 last year (+85.0% Y/Y).
2) The Pro channel grew low single digits, remaining positive in every month of the quarter, with growth accelerating to ~3% in the final 4 weeks. Main Street Pro, which represents ~80% of Pro sales, outpaced overall Pro by ~100 bps on new customer acquisition and existing accounts moving into higher weekly spending tiers. Management continues to rationalize the lower-margin national account book in favor of Main Street, a larger TAM with better flow-through. That mix shift weighed ~100 bps on Pro and ~50 bps on total sales in the quarter and will be largely cycled by early Q1 2027. Improved parts availability, delivery times consistently under 40 minutes, and the TechNet program continue to support share gains, with Pro accelerating to low-to-mid single digits in the early weeks of Q4.
3) DIY declined low single digits as persistent inflation and higher gas prices continued to pressure AAP’s core lower- and middle-income customer, though trends improved meaningfully from the ~7% decline in the final 4 weeks of Q2. DIY fell more than 4% through the first 8 weeks of Q3 before narrowing to a low-single-digit decline in the final 4 weeks, with transactions driving the improvement as store service execution and value messaging gained traction. Units per transaction grew low single digits, pushing average ticket growth above same-SKU inflation. Maintenance and failure categories such as motor oil, batteries, filters, and wipers led the quarter, while hard parts remained soft as consumers deferred larger repairs. Early Q4 DIY trends are running ~flat.
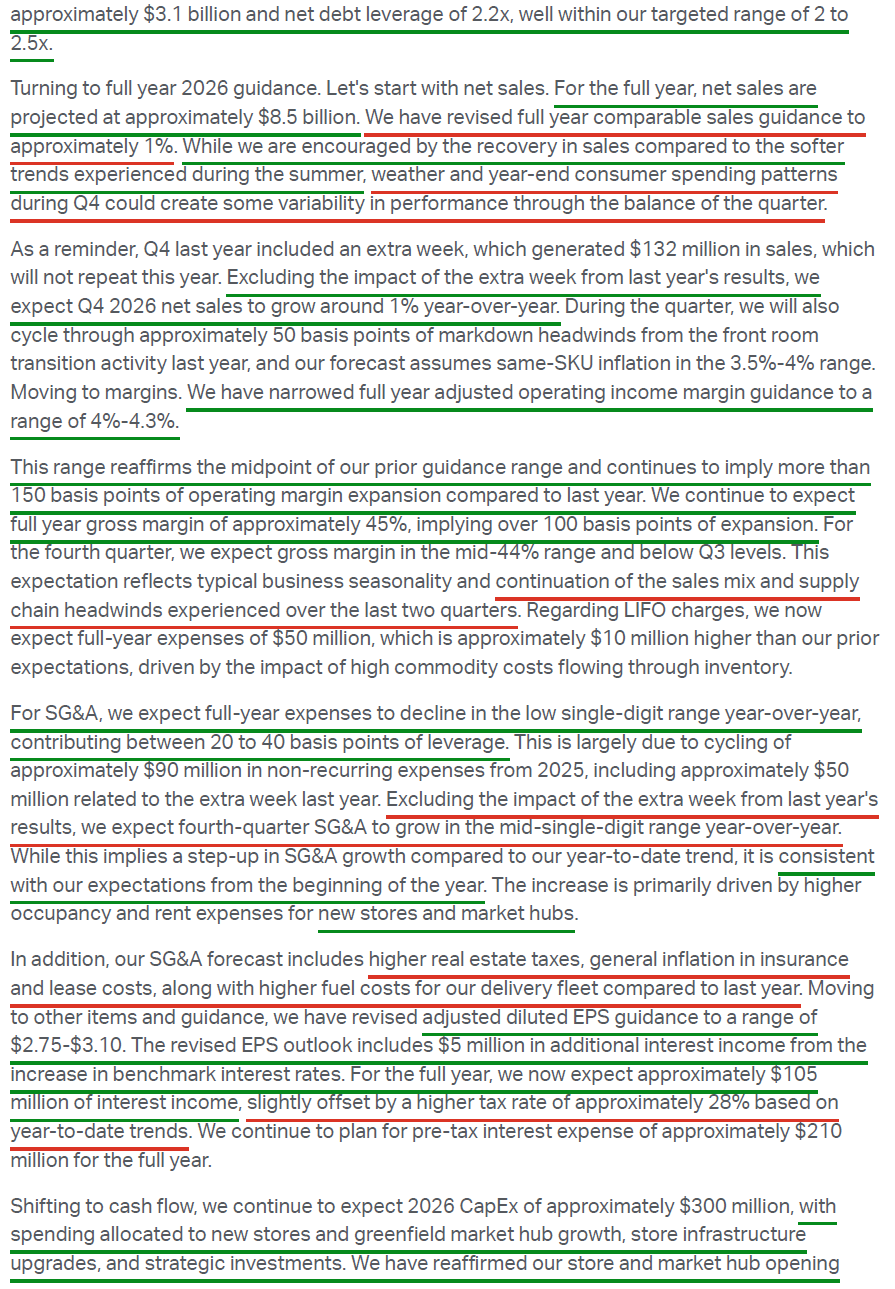
4) Adjusted gross margin came in at 44.7% (-16 bps Y/Y). Lower DIY mix, higher fuel costs, and supply chain deleverage from port surcharges and import freight created ~40 bps of pressure, with another ~20 bps from a product mix shift into lower-margin motor oil and away from hard parts. These headwinds were partially offset by ~40 bps of net benefit from lower LIFO expense ($11M vs. $33M), less the reversal of last year’s warehousing benefit. Management is not yet fully passing commodity costs through to customers, viewing much of the pressure as transitory. YTD adjusted gross margin stands at 45.3% (+150 bps Y/Y), with merchandising initiatives contributing ~100 bps. Management expects Q4 gross margin in the mid-44% range on seasonality, with FY gross margin of ~45%, implying 100+ bps of full-year expansion.
5) The most important metric in the AAP turnaround, adjusted operating margin, came in at 4.5% (+10 bps Y/Y), with adjusted operating income of $91M ahead of the $88.4M consensus estimate. Adjusted SG&A of 40.2% of sales delivered 26 bps of leverage as dollars fell ~2% Y/Y, with productivity gains in non-customer-facing areas such as indirect spend funding continued investment in the frontline. Excluding the Q2 tariff refunds, management called it one of the strongest margin quarters since the strategic plan began two years ago. YTD adjusted operating margin reached 4.6% versus 2.2% last year (+240 bps), or $302M of adjusted operating income versus $143M.
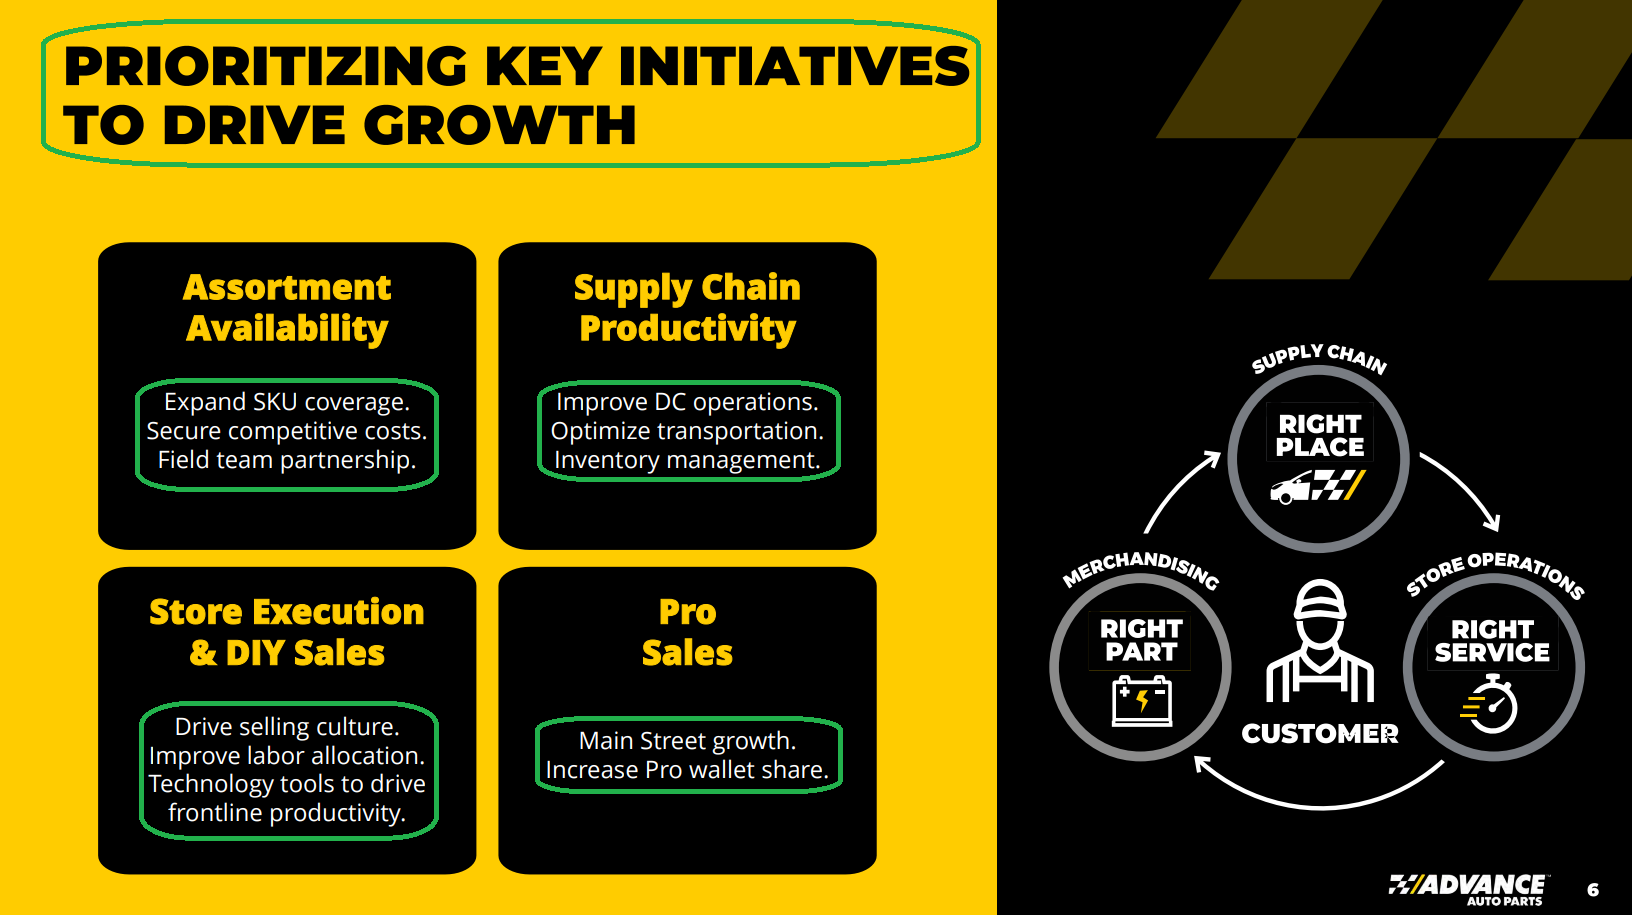
6) AAP opened 8 market hubs in Q3, bringing the network to 46 (13 opened YTD), with the FY2026 target of 15 to 20 openings reaffirmed. That extends hub coverage to more than 70% of stores by year-end, with ~60 hubs by mid-2027 covering the majority of the store base. Hubs carry ~85K SKUs, with more than 5x the backroom hard parts space of an average store, supporting multiple same-day delivery runs to surrounding locations. Following the completed DC consolidation, process improvements are rolling out across all 15 DCs in stages through mid-2027, targeting lower handling costs, better shipment accuracy, and shorter lead times. Carrier contracts have been bid, with volume consolidating across fewer carriers, expected to generate 20+ bps of cost savings even in a flattish sales environment, with benefits landing next year.
7) Store-level KPIs continued to improve sequentially, with NPS rising above 80 from the high 70s in Q2, while in-store attachment rates climbed to the mid-30% range from ~30%. AAP deployed ReliaScan, a modernized check-engine diagnostic tool offered free to customers, across most stores during the quarter, with Zebra devices now in every location to shift team member hours from tasking to selling. ~100K SKUs have been added YTD, the centralized pricing and promotion platform remains on track to complete its rollout, and workforce management tools are being modernized following this year’s labor standards study. AAP opened 17 stores and closed 3 in Q3, ending at 4,325 locations, with the FY2026 plan of 30 to 35 openings reaffirmed.
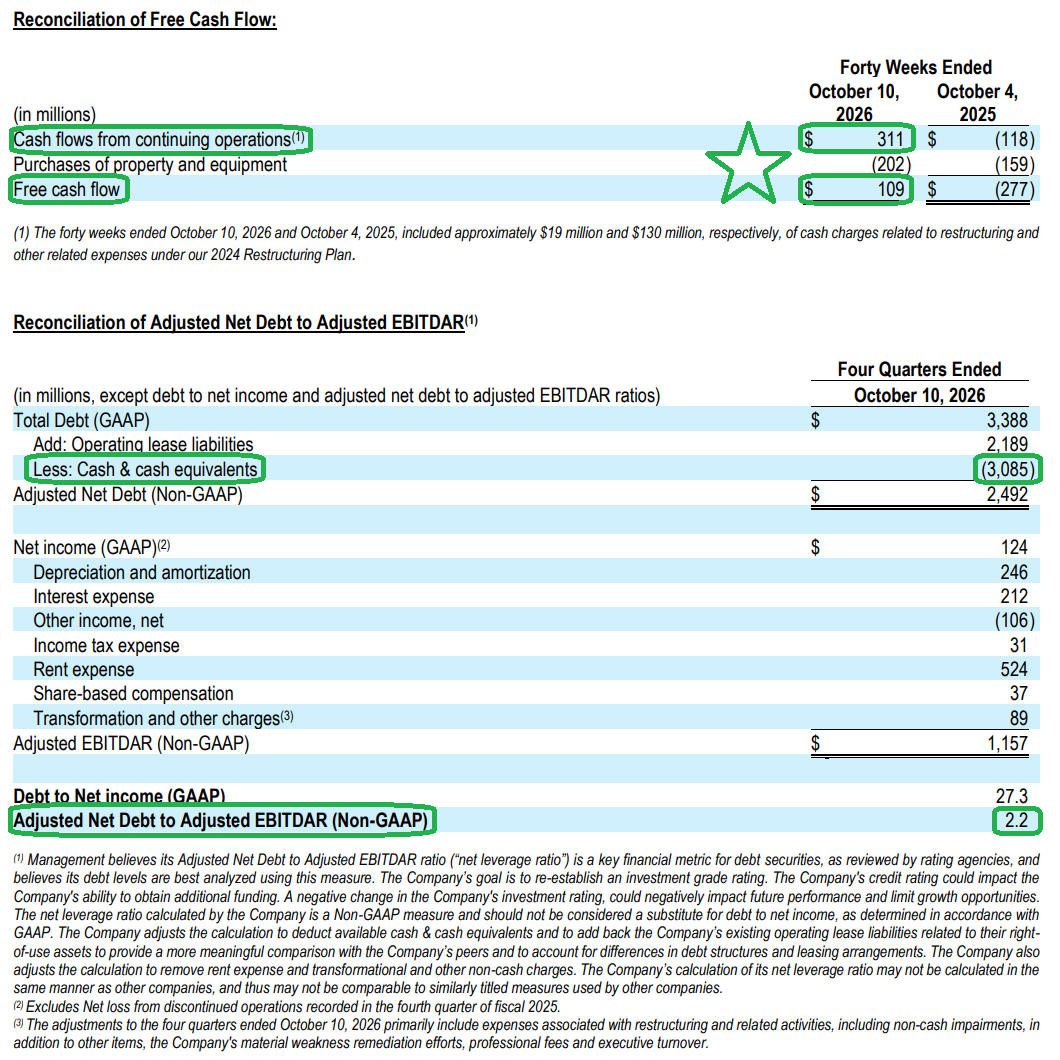
8) Operating cash flow swung to +$311M YTD from -$118M last year, driven by stronger profitability, working capital management, lower restructuring cash charges of $19M versus $130M, and tariff refunds. Capex stepped up to $202M from $159M as AAP continues to invest in market hubs, new stores, and store upgrades. That left free cash flow at +$109M YTD versus an outflow of $277M last year, a $386M improvement. Management raised FY2026 free cash flow guidance to ~$150M from ~$100M, implying more than $400M of Y/Y improvement and the first full year of positive free cash flow since FY2022, while noting FCF is not expected to go backwards in FY2027 despite higher capex.
9) The balance sheet remains in a solid position, with net leverage of 2.2x versus 2.1x in Q2, still within management’s 2.0x to 2.5x target range. AAP ended the quarter with $3.09B of cash against $3.39B of total debt, $349M of which is now current, putting adjusted net debt at $2.49B. FY interest income is now expected at ~$105M, up $5M from prior expectations on higher benchmark rates, against ~$210M of interest expense.
10) Management narrowed full-year guidance, now expecting net sales of ~$8.50B versus $8.485B to $8.575B previously (consensus: $8.52B), with comp sales of ~1% versus 1% to 2%, implying a return to positive comps in Q4. Adjusted operating margin guidance was narrowed to 4.0% to 4.3% from 3.8% to 4.5%, reaffirming the 4.15% midpoint and 150+ bps of expansion, while adjusted EPS guidance was narrowed to $2.75 to $3.10 from $2.60 to $3.30 (consensus: $2.96). Q4 net sales are expected to grow ~1% Y/Y, excluding the $132M 53rd week in the prior year, with same-SKU inflation of 3.5% to 4%. Looking to FY2027, management reiterated at least 100 bps of operating margin expansion, built off the H2 2026 base rather than the full year, with SG&A growing ~in line with sales.
Earnings Call Highlights
Stanley Black & Decker Update
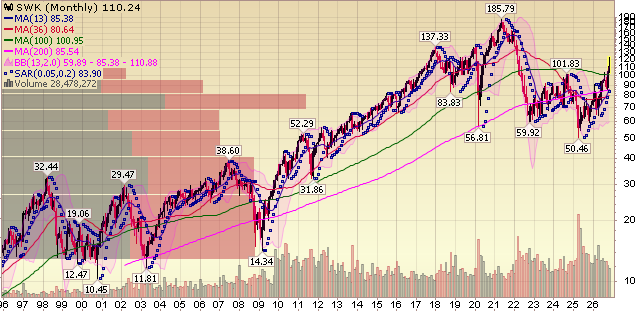
For newer readers, here’s a brief overview of the key drivers behind our Stanley Black & Decker thesis, the world’s #1 tools company turning the page on a multi-year restructuring and a levered way to play the long-awaited housing recovery:
Company Overview
Founded 1843 in New Britain, Connecticut – the #1 world leader in tools and outdoor
Iconic brands: DEWALT, CRAFTSMAN, STANLEY, BLACK+DECKER, Lenox, Irwin, Cub Cadet
Tools & Outdoor: ~90% of sales (power/hand tools, lawn/garden); Engineered Fastening: ~10% (automotive/industrial fasteners)
90% of North American/European cars and light trucks use SWK fasteners; industry-leading North American manufacturing footprint (>60% of cost of sales)
Revenue mix: 62% U.S., 16% Europe, 13% emerging markets, 5% Canada
Major customers: Home Depot ~15% of sales, Lowe’s ~12%
~$15.1B in net sales in FY2025 (-2% Y/Y); stock still down ~50% from 2021 highs
Largest domestic manufacturing footprint in the industry leaves SWK at parity to mildly advantaged versus competitors in the current tariff environment
Cost Savings Program
Launched $2B 3-year Global Cost Reduction Program in 2022 amid the post-pandemic de-stock/re-stock cycle, higher rates and inflation, a housing downturn, and excess inventory
Completed end-FY 2025: $2.1B in run-rate pre-tax savings achieved, exceeding the $2B target (including ~$120M in Q4). Most of it came from centralizing and scaling sourcing plus restarting a dormant engineered and material cost reduction program
Supply chain optimization: ~30-40% of Tools & Outdoor network sites transformed or closed
~85,000 SKUs discontinued
Headcount down >40% to ~41k from a peak of 71.3k
Inventories peaked at ~$6.64B in 2022; reduced ~42% to ~$3.84B as of 3Q’26 (down ~$2.8B)
Targeting ~$200M of working capital reduction in FY2026 and a return to ~135 days sales-in-inventory (pre-COVID threshold), with management expecting to be a good portion of the way there by year-end
Management considers working capital productivity still in early innings. Fewer components, fewer SKUs, and fewer facilities make lower working capital feasible, though inventory will not be cut at customer expense
~149M diluted shares outstanding – ~$14/share in savings delivered
Targeting ongoing ~3% annual productivity savings (~$300M gross) going forward
Margin Expansion
Adj. gross margins bottomed in Q4 2022 at ~19.5% (from inflation and excess inventory; historical range: mid-30s)
FY2025 adj. gross margin: 30.7% (+70 bps Y/Y)
Q3 2026 adj. gross margin: 39.4% (+780 bps Y/Y), including ~430 bps from net tariff refunds. ~35.1% ex-refunds (+350 bps Y/Y), clearing the 35% threshold with or without refunds on net productivity and favorable product mix
YTD’26 adj. gross margin of 34.4% (+460 bps Y/Y)
FY2026 adj. gross margin expansion of ~350 bps (34% and a fraction), including ~150 bps from net tariff refunds
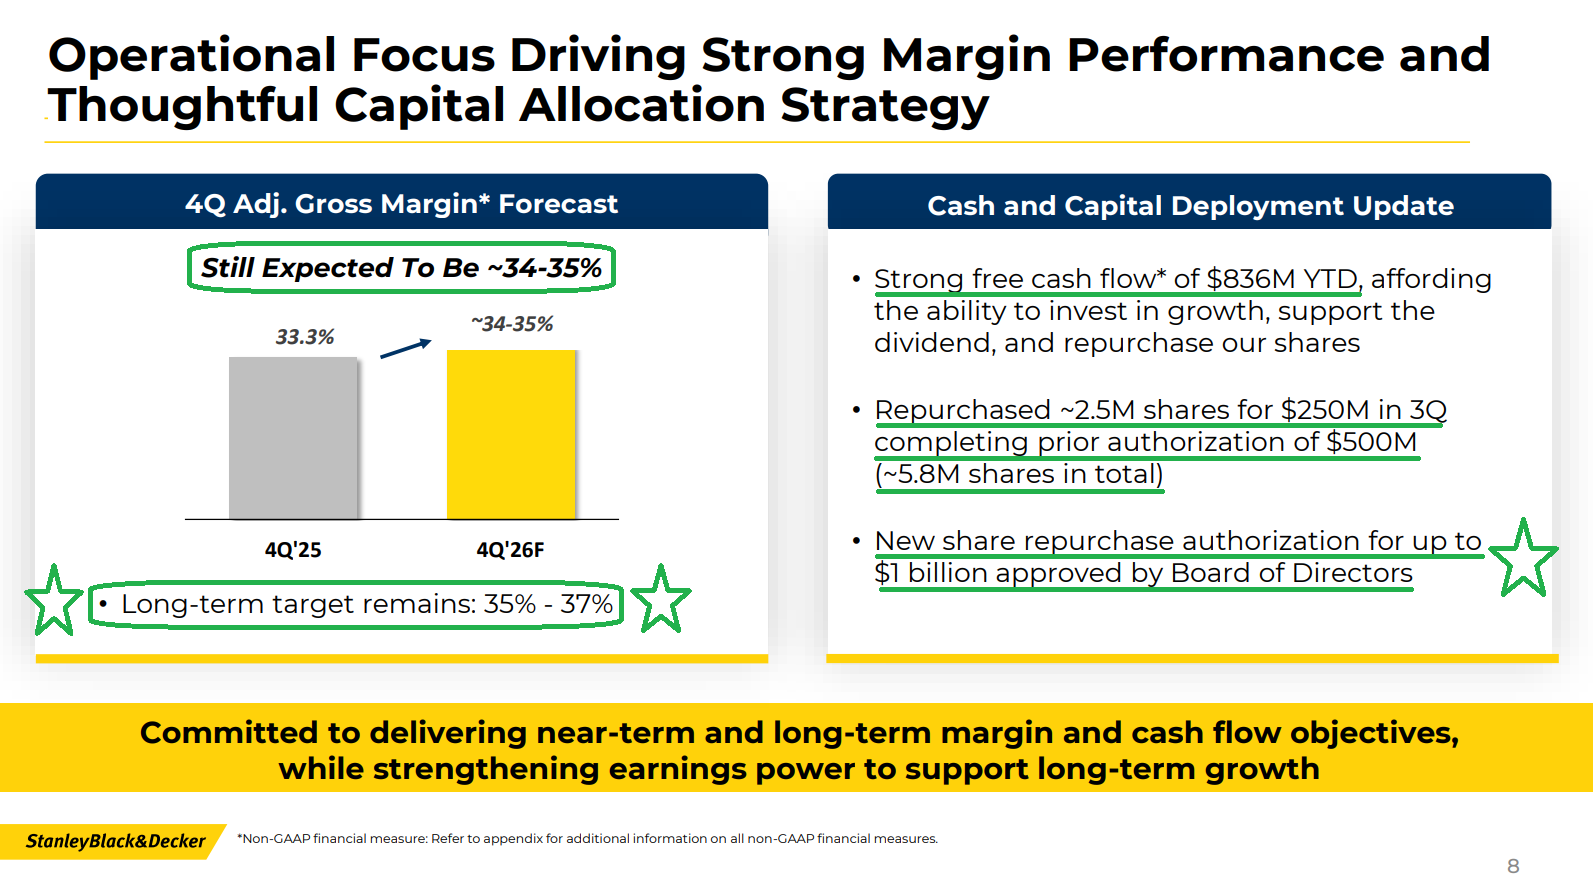
Management target: 34-35% in 4Q’26 (vs. 33.3% LY), consistent with the 35%+ exit rate ambition
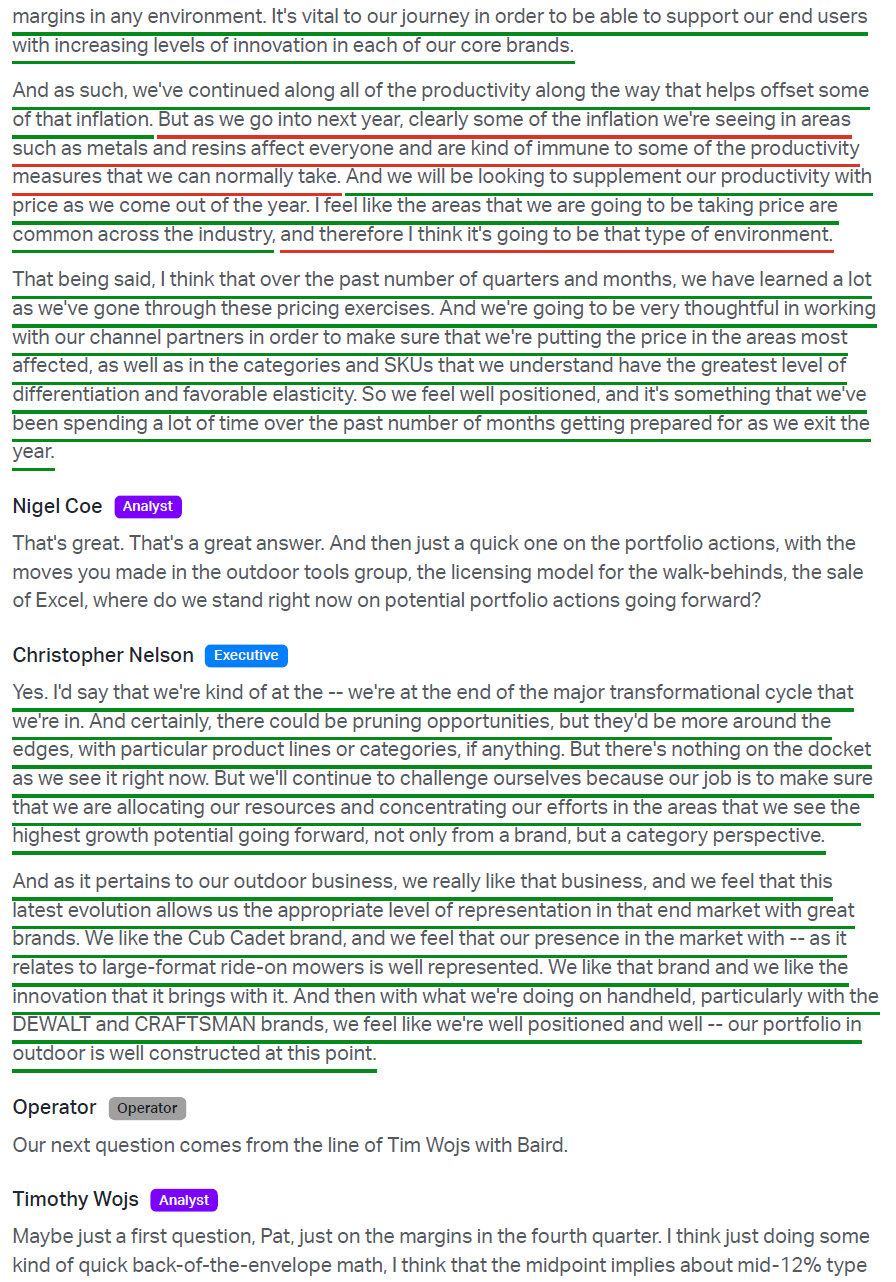
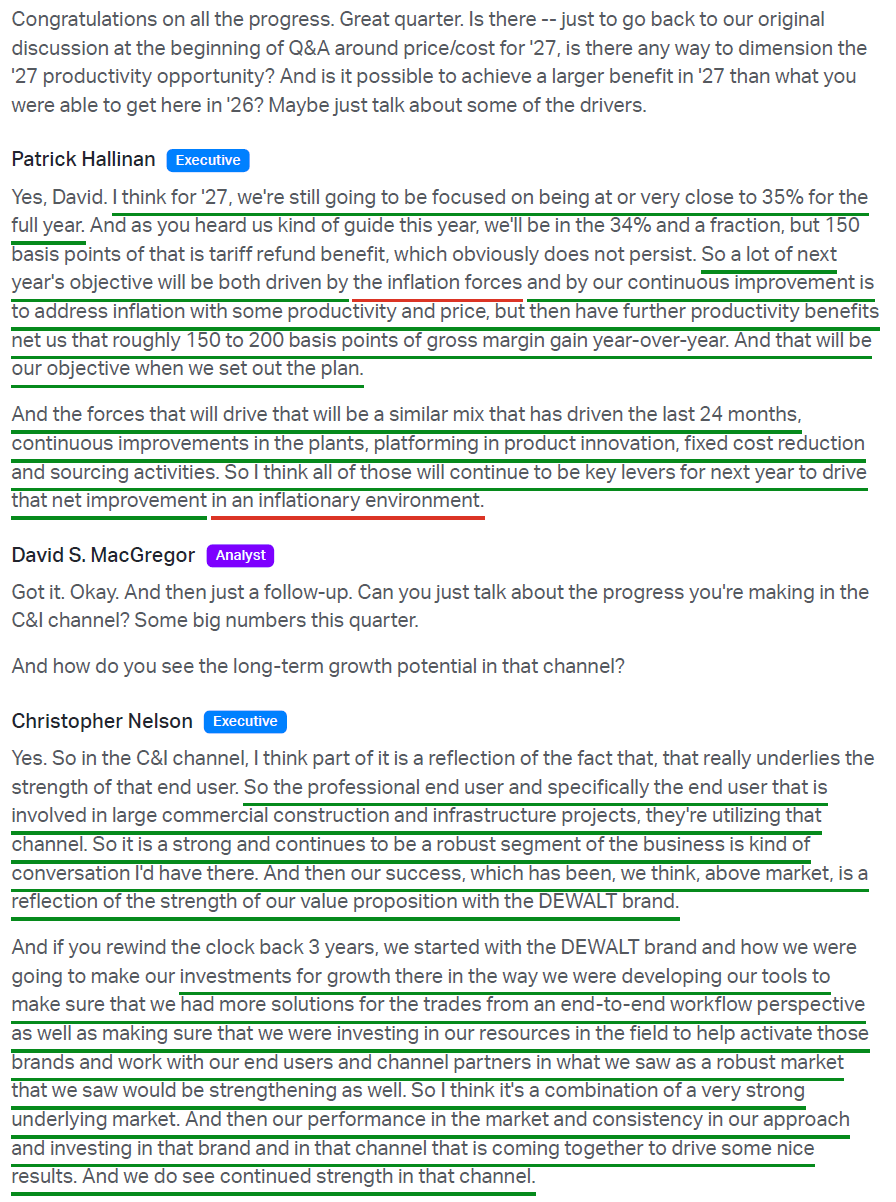
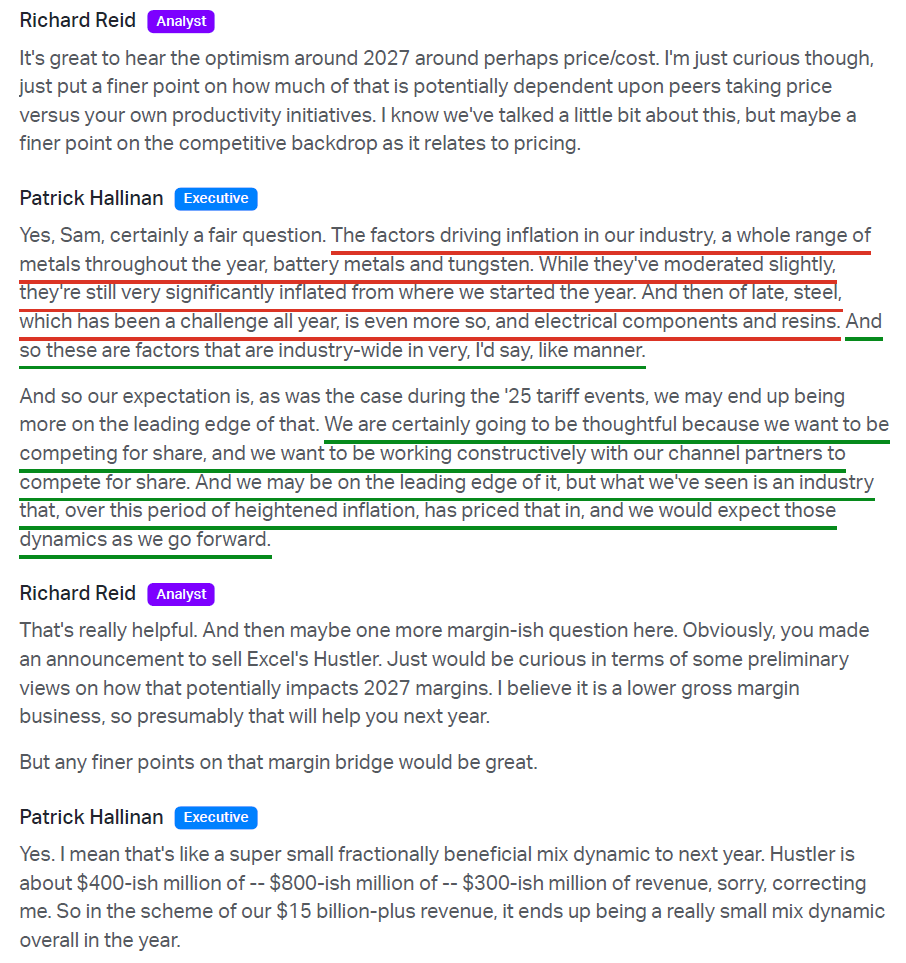
2027 targeted at or very close to 35%, with net productivity driving ~150-200 bps of Y/Y gains off the ex-refund base. Inflation building in steel, electrical components, resins, battery metals and tungsten, with a price increase likely around the turn of the year alongside productivity. Price increase sized at low single digits, needed regardless of what happens on tariffs, with pricing set by product using elasticity data built up over the tariff period
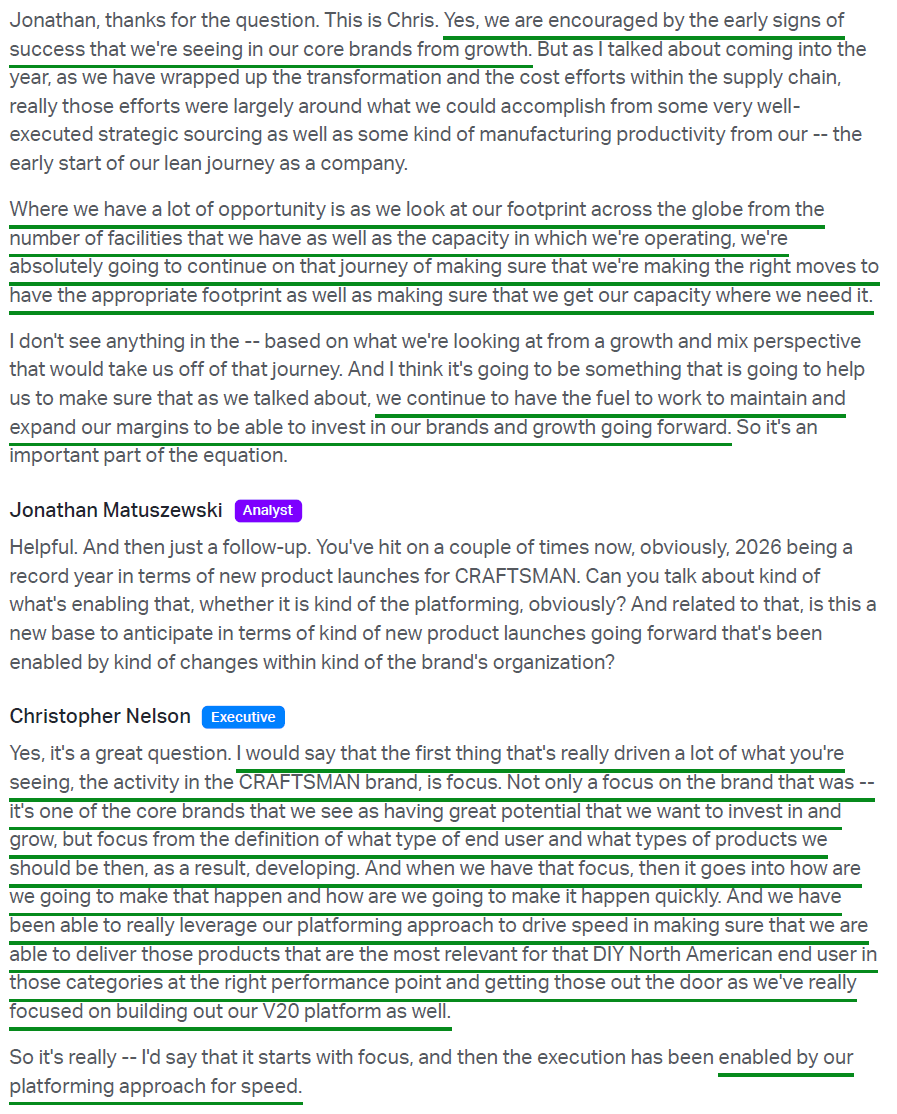
The path to 35% assumes flat volumes with no market recovery, and runs on three levers: product platforming, lean and automation, and footprint rationalization
~50% of this year’s material productivity savings are enabled by platforming, with management expecting that to accelerate. Platforming now mandatory to pass the stage gates for every new product, with the next leg being retrofitting already-launched products onto shared components (e.g., 20 motor controllers consolidated to 4)
Footprint rationalization has the most runway left, since the engineers and operators who would consolidate have been occupied moving production for tariff optimization.
Last full year above 35% was 2018 at 35.2%, when EPS was $8.15 and the stock traded above $150
Long-term target: 35-37% adj. gross margins by FY2028
~Every 100 bps of gross margin expansion = ~$1/share in EPS
Adj. EBITDA margin of 16.3% in Q3 (+400 bps Y/Y); YTD’26 at 12.2% (+220 bps Y/Y)
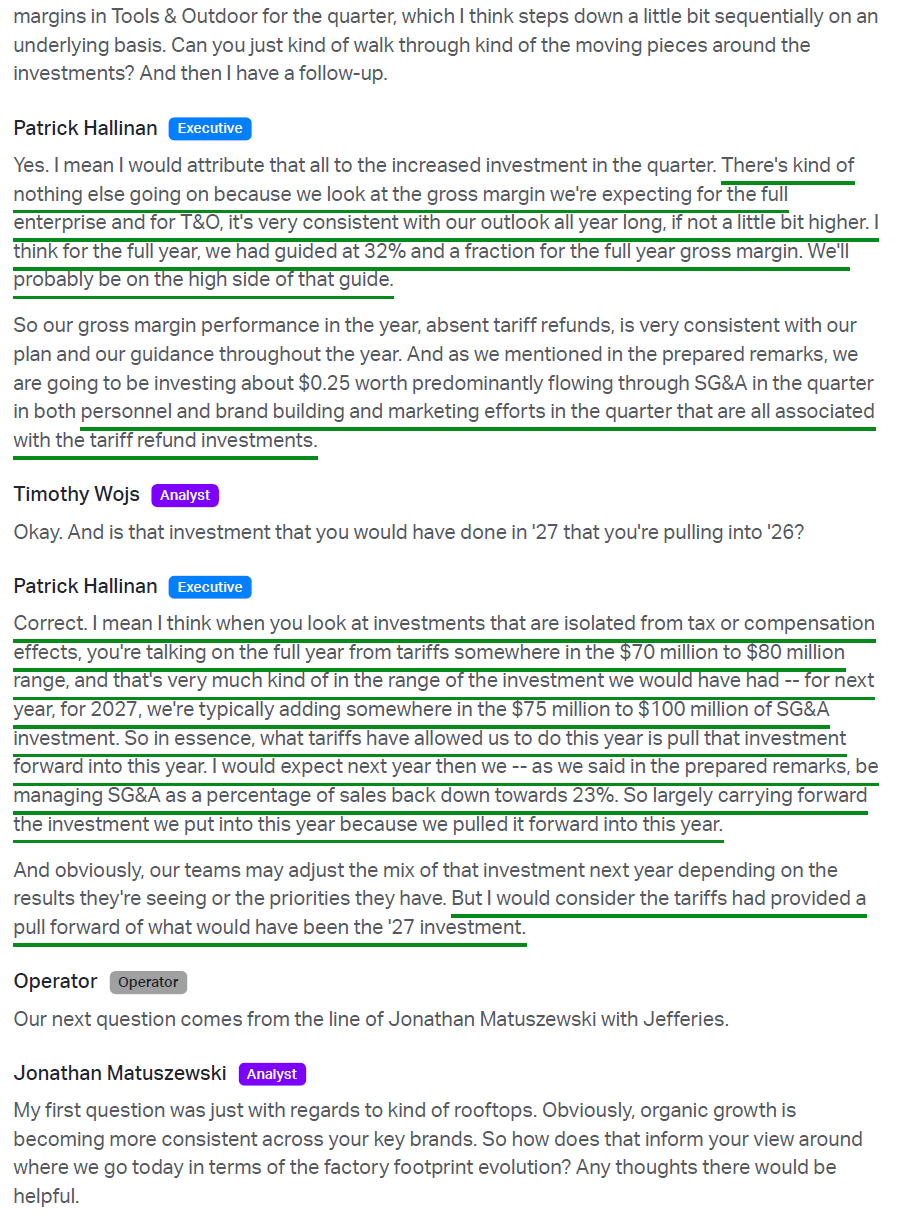
Received the vast majority of IEEPA tariff refunds applied for. Refunds pulling forward $70-80M of growth investment planned for 2027, with SG&A expected back to ~23% of sales in 2027
On track to reach at-or-above industry-average USMCA-qualified import mix (up from ~1/3 at program start) and reducing China-sourced U.S. sales to <5% by end-2026 (from ~20%), both ahead of plan
2H’26 margin expansion is expected to lean meaningfully on tariff mitigation, specifically continued USMCA compliance progress and shifting U.S. tools production from China to North America
Deleveraging Through Asset Sales & Capital Allocation
Debt reduced >$3.7B since FY2022; net leverage improved from 5.9x (end-FY2023) to 3.4x (end-FY2025); on track for ~2.5x by end-FY2026 inclusive of buybacks
Convergent Security Solutions sold July 2022 for net proceeds of $3.1B
Mechanical Solutions business sold July 2022 for net proceeds of $916M
Oil and Gas business sold August 2022
Infrastructure business sold April 2024 for net proceeds of $729M
CAM sold to Howmet Aerospace on April 6, 2026 for $1.8B all-cash (18x EBITDA, above the $1.0-1.5B expectation), ahead of the prior H1 2026 timeline; ~$1.8B of proceeds received net of cash sold, with a $273.7M pre-tax gain ($1.08 of GAAP EPS)
~$1.7B of debt reduction executed in 2Q using CAM proceeds plus operating cash flow
Over $6.3B in cumulative asset sales over ~4 years; multi-year restructuring now complete – focus shifts to share repurchases
Management considers large structural portfolio moves finished (“end of the major transformational cycle”). The Excel (Hustler large-format mowers, ~$300M of revenue) divestiture announced in September was pruning, since SWK could already cover the outdoor zero-turn professional gas market with Cub Cadet, with closing expected ~year-end.
Completed the $500M repurchase authorization with ~2.5M shares repurchased for $250M in 3Q (~5.8M shares total). Board approved a new $1B authorization on Oct 29 (expires Oct 2029); capital allocation now biased toward buybacks while the M&A pipeline builds
Any future M&A would be tools brands or technologies that accelerate the organic story in target verticals. Management explicitly ruled out diversifying acquisitions or adding another leg of the stool
3Q’26 balance sheet: cash ~$0.7B, long-term debt $4.7B, no short-term borrowings, ~$3.7B of total additional liquidity, next debt maturity in 2028
Return to Growth
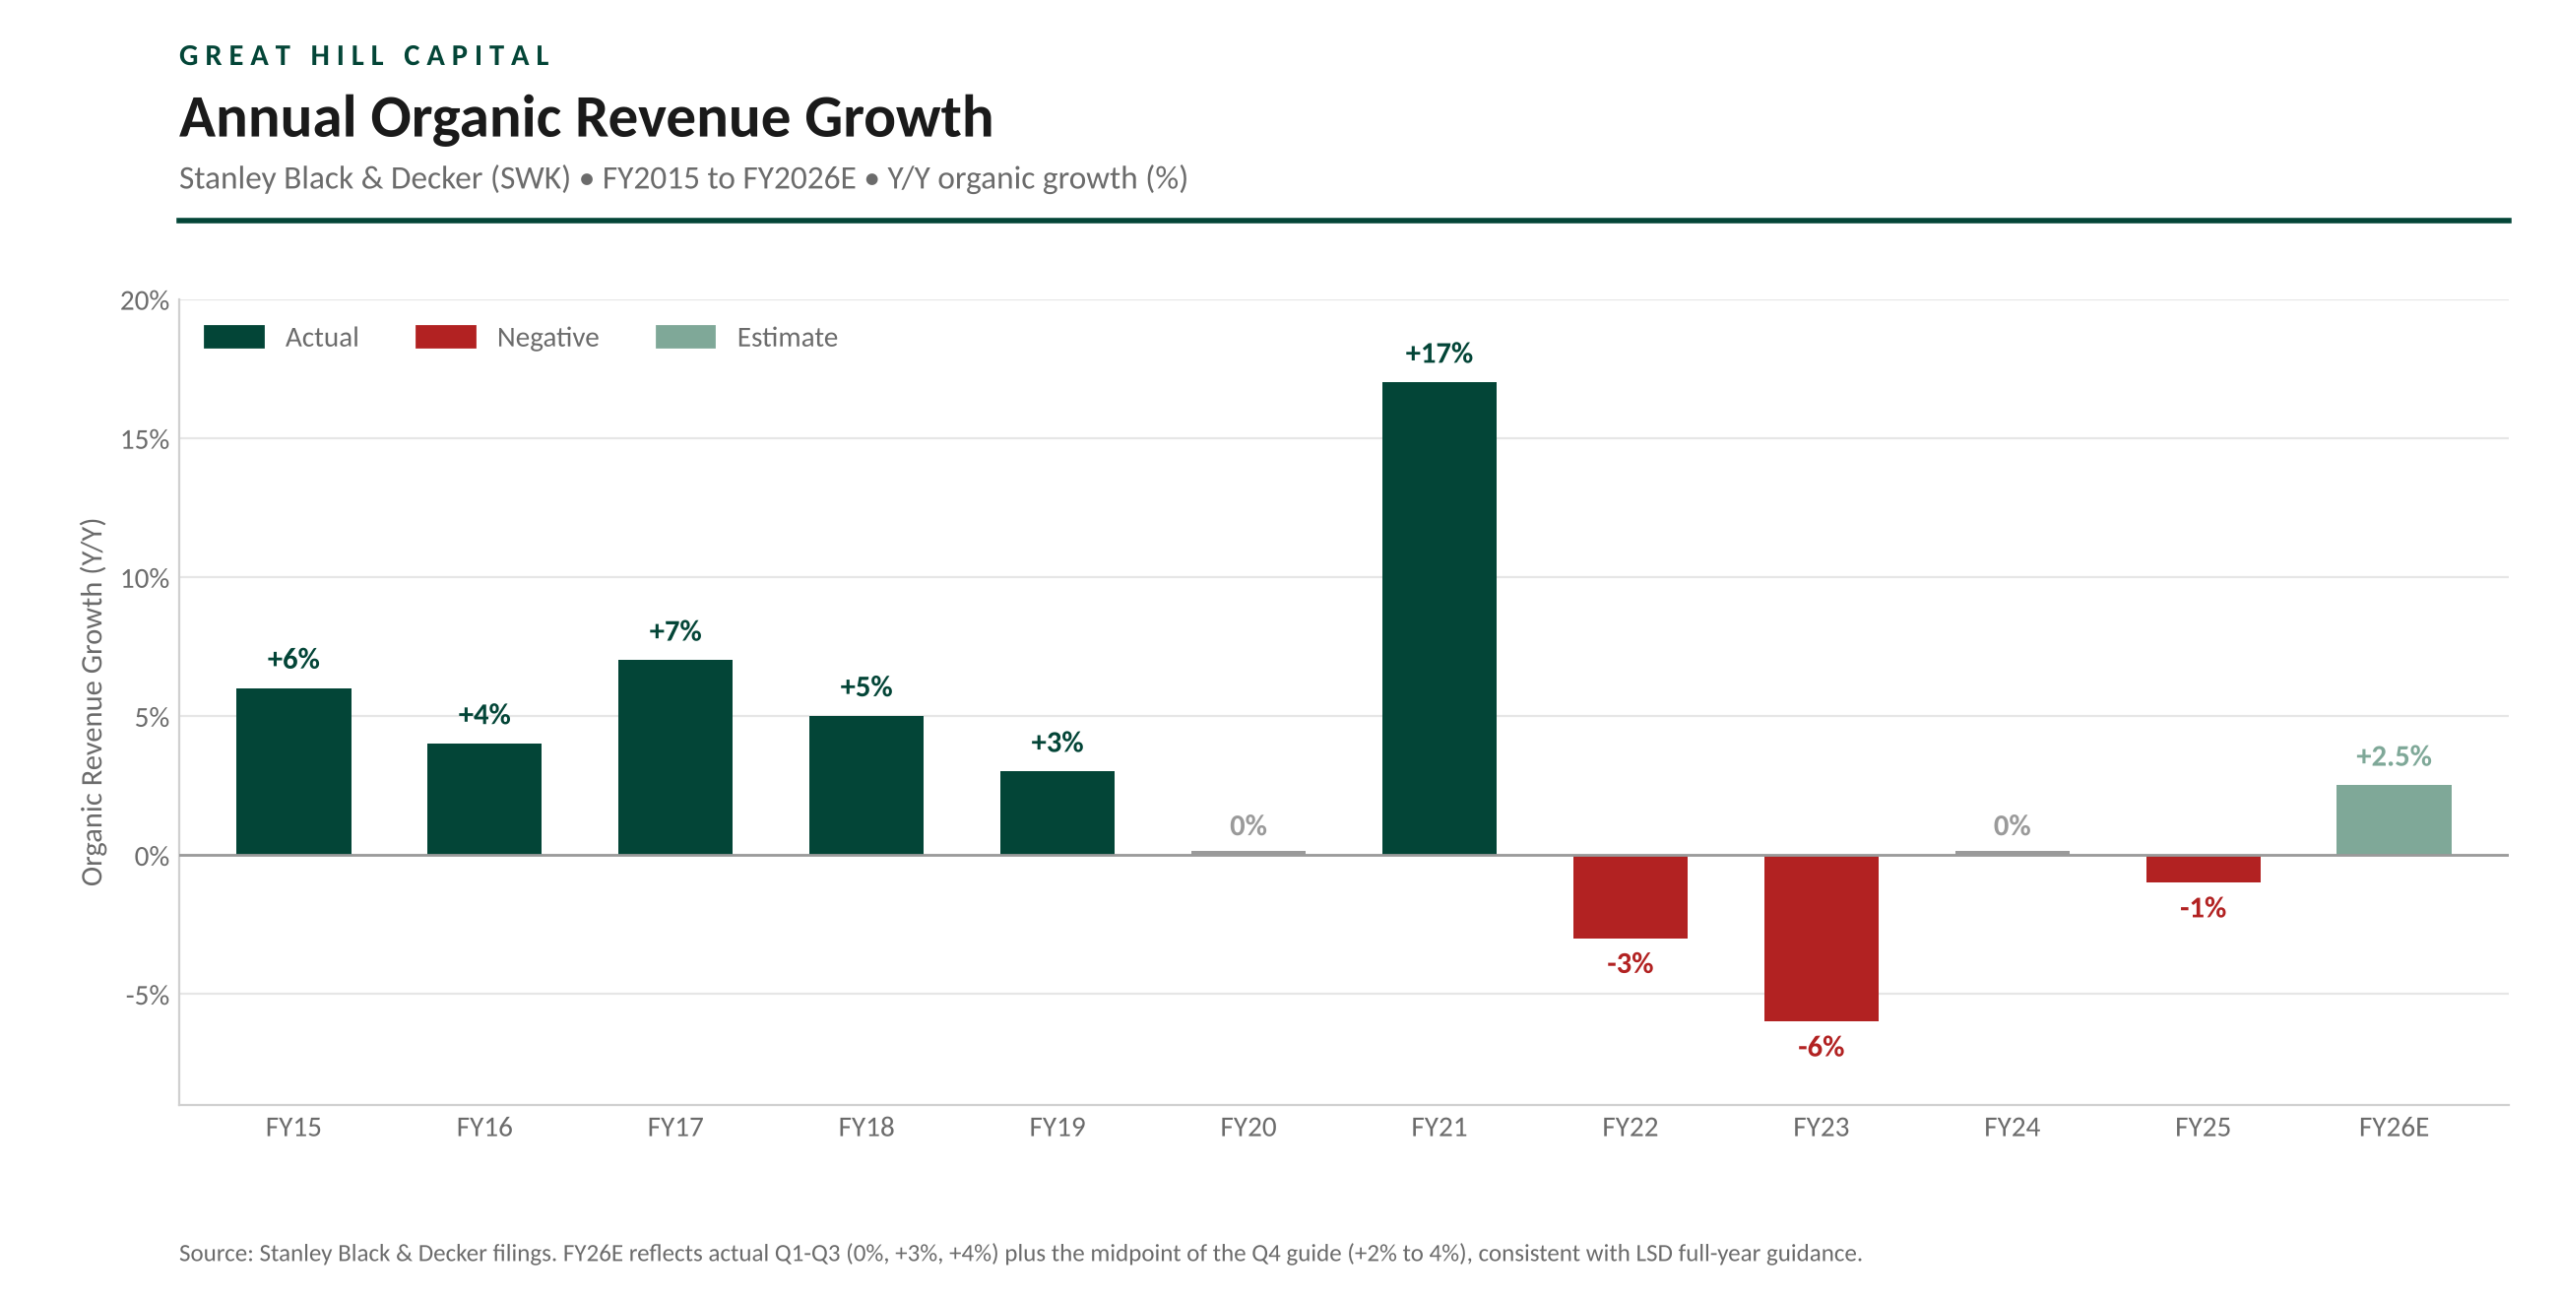
Stabilizing after multiyear pressures; FY2025 organic sales -1%; 2026 organic sales accelerating each quarter (Q1 flat, Q2 +3%, Q3 +4%)
Q3 2026 revenue $3.73B (+4% organic), at the top of the +3-4% organic guide
2026 guidance: low single-digit organic growth (total revenue ~flat on CAM close and gas walk-behind licensing). Tools & Outdoor LSD organic growth driven by share gains in a ~flat to down market
Q3 2026 standouts: Power tools organic +10% (up from +8% in Q2), U.S. retail up mid-single digits, U.S. C&I channel up mid-teens (accelerating from low double digits in Q2), all three priority brands (DEWALT, STANLEY, CRAFTSMAN) growing organically for a second straight quarter
Reworked 2026 promotional construct (e.g., which free tool is bundled with a battery purchase) based on nationwide A/B testing, driving accretive volume growth in higher-margin products despite a heavier promotional environment across the industry
Industrial fasteners organic +10%; Outdoor organic -12% on weather in the U.S. plus Automotive organic -2% on OEM caution the drags
Underlying demand is flattish overall. Commercial and industrial professional is very strong, housing has not inflected, and the DIY consumer is stabilized rather than growing
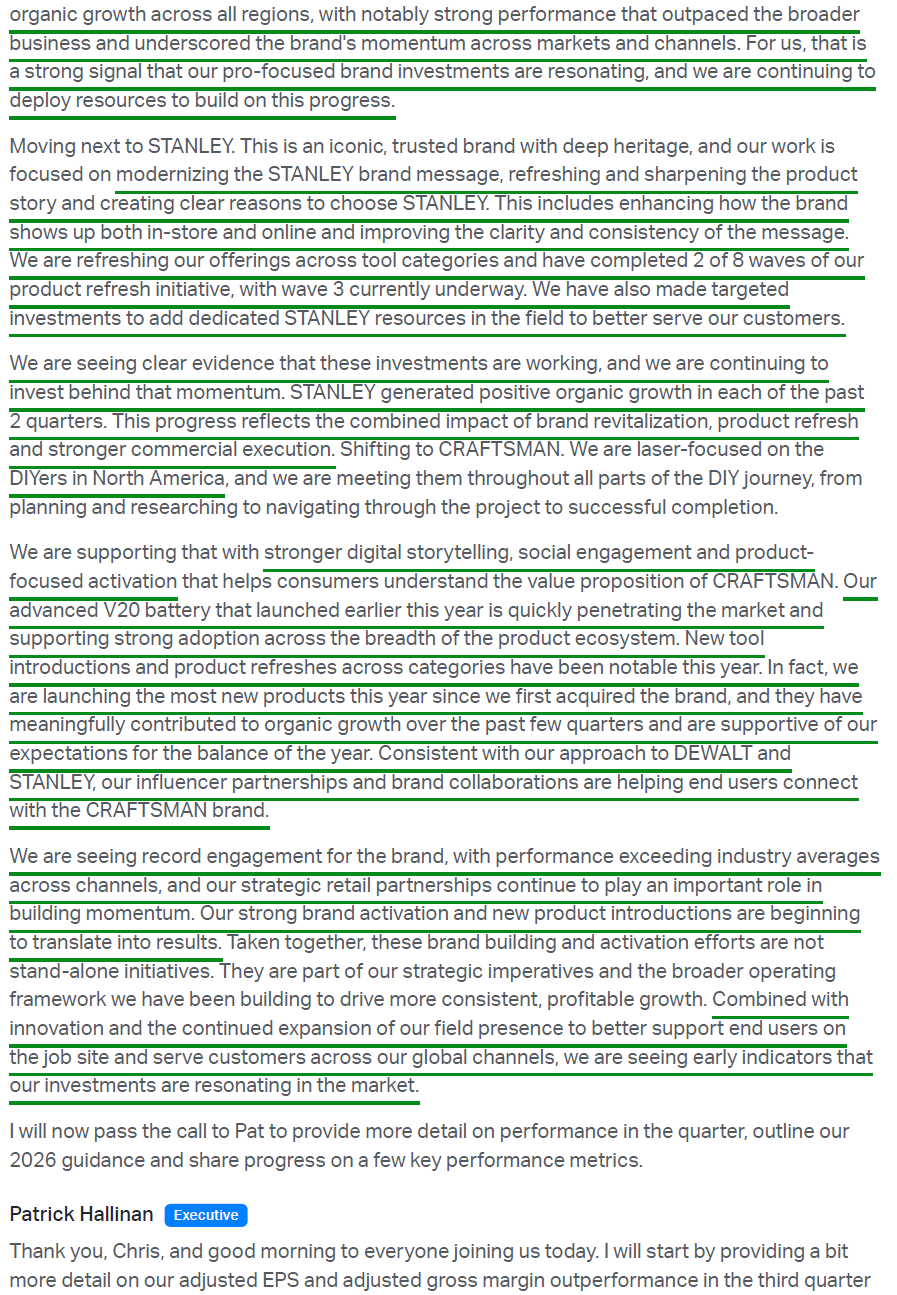
STANLEY generated positive organic growth in each of the past 2 quarters, on pace with the mid-2026 target; management still points to 2H’26 for consistent STANLEY performance. 2 of 8 product refresh waves complete, with wave 3 underway.
Over 60% of STANLEY is European, sold through wholesalers, where SWK previously had no dedicated sales force. Those resources are now in place and producing growth
CRAFTSMAN also positive organically in Q2 and Q3, with the relaunch (most new product launches since SWK acquired the brand in 2017) and new V20 advanced batteries driving momentum alongside record brand engagement; management targets consistent performance into 2027.
Growth led by DEWALT ($7B+ franchise, ~half of total revenue, low-single-digit growth in FY2025, organic growth across all regions in Q3) alongside the long-awaited inflection in CRAFTSMAN and STANLEY.
The DEWALT push expands from traditional residential and carpentry strength into commercial and industrial mechanical, electrical, plumbing, and concrete
Battery ecosystem builds a moat: users are >80% predisposed to stay in their current battery platform on the next purchase. SWK competes on battery performance (20V, the industry-exclusive FLEXVOLT 20V/60V, larger-format packs moving gas-powered concrete work to battery) plus full workflows for each trade down to specialty tools, with room to win specialty share of wallet from smaller players
Management’s pricing argument on DEWALT: large professional enterprise users are relatively price insensitive because what is sold is labor arbitrage. Turning a two-person job into a one-person job matters on a data center timeline measured in hours and days
Management expects consistent, repeatable growth across all three brands by the middle of next year
U.S. C&I channel expected to approach ~10% of total Tools & Outdoor sales in 2026 on ~double-digit organic growth; projects served by this channel represent trillions of dollars of committed capital spending over the next 5 years (data centers, power generation, prefab manufacturing).
Management views this as more than a data center trade, with new tradespeople entering the workforce needing to be outfitted and a backlog of other construction work behind data centers
Long-term goal: mid-single-digit organic growth (2-3x market/GDP in normalized environments)
~50% of Tools & Outdoor tied to residential construction: 27% new construction, 23% repair/remodel
Key secular drivers: housing construction recovery, lower rates tailwind, U.S. housing shortage of ~4M homes, significantly aged housing stock (>42 years)
13.9M homes owned by Baby Boomers and the Silent Generation expected to return to the market from 2026-2036, a 33.7% (3.5M) increase over the prior decade’s pace
Innovation cycle time improved 30% by the end of this year, feeding a product pipeline across DEWALT, STANLEY, and CRAFTSMAN
Introduced the world’s first downward drilling, fleet-capable robot accelerating data center construction (80 weeks saved across 10 projects, 99.97% accuracy)
Key Financials + Valuation
FY2025: Net sales $15.1B (-2% Y/Y, -1% organic); adj. EPS $4.67 (+7% Y/Y); FCF $688M (ahead of prior ~$600M guide)
YTD’26: Net sales $11.54B (+0.8% Y/Y); adj. EPS $4.66 (vs. $3.26 LY); FCF $836M (vs. -$195M LY)
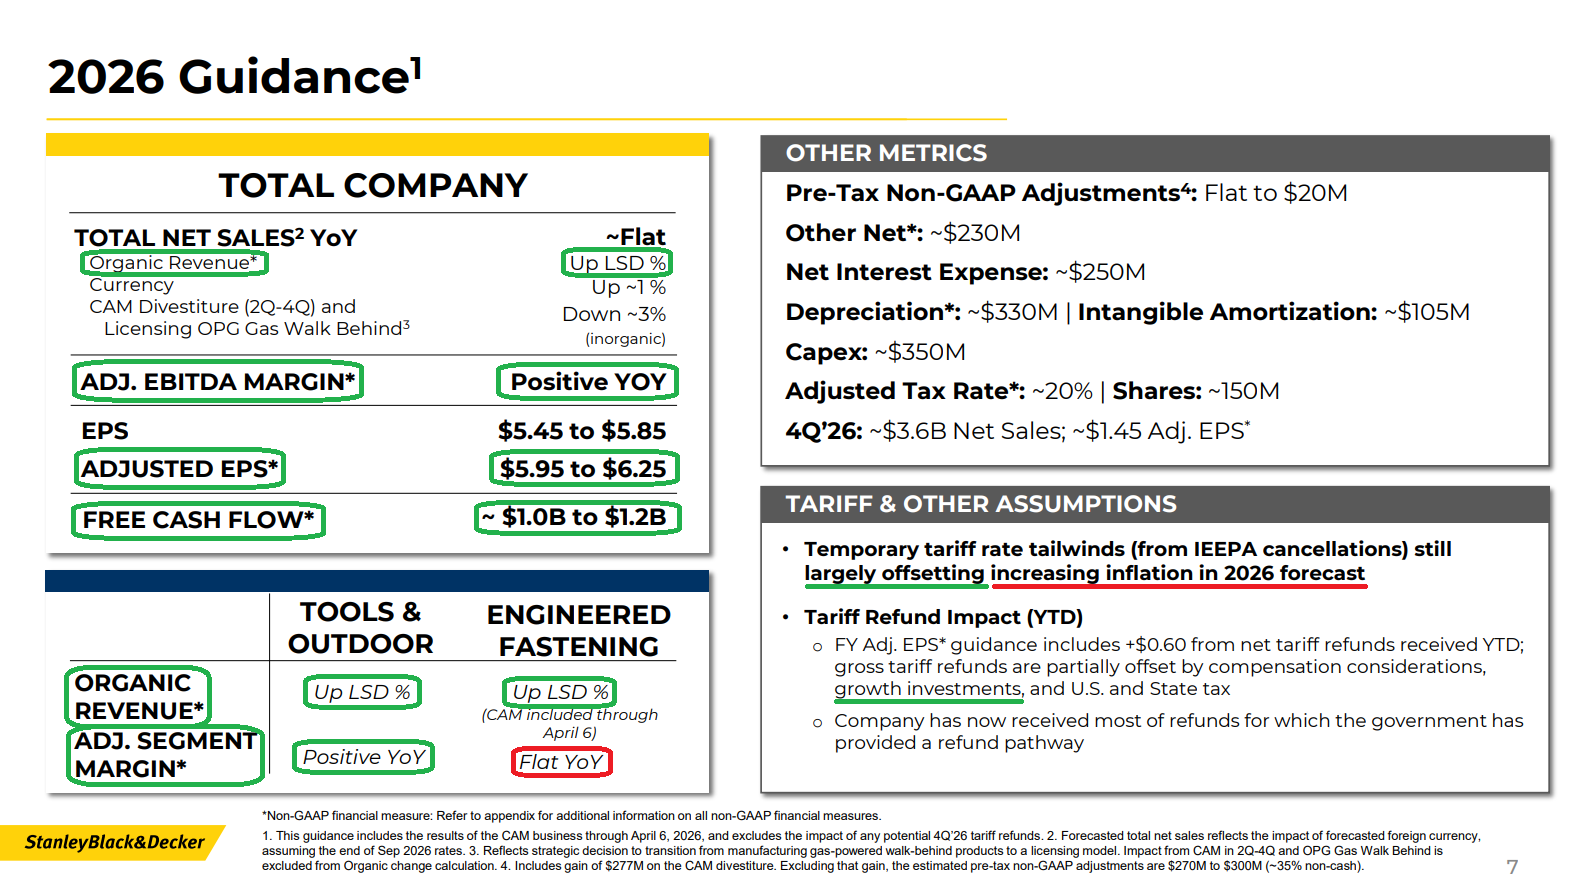
2026 guidance: adj. EPS $5.95-6.25 (midpoint $6.10, +31% Y/Y), including ~$0.60 from net tariff refunds and excluding any potential Q4 refunds; FCF $1.0-1.2B; organic sales low single digits; ~350 bps adj. gross margin expansion including ~150 bps from refunds
4Q’26 guide: net sales ~$3.6B (flat reported), organic +2-4%, adj. EPS ~$1.45 (including ~$0.25 of refund-related costs and taxes)
Dividend: quarterly rate now $0.84 (from $0.83); ~3% yield; 149 consecutive years of payments (longest streak of any industrial company on the NYSE); 58 consecutive years of increases (every year since 1968)
Q3 Commentary
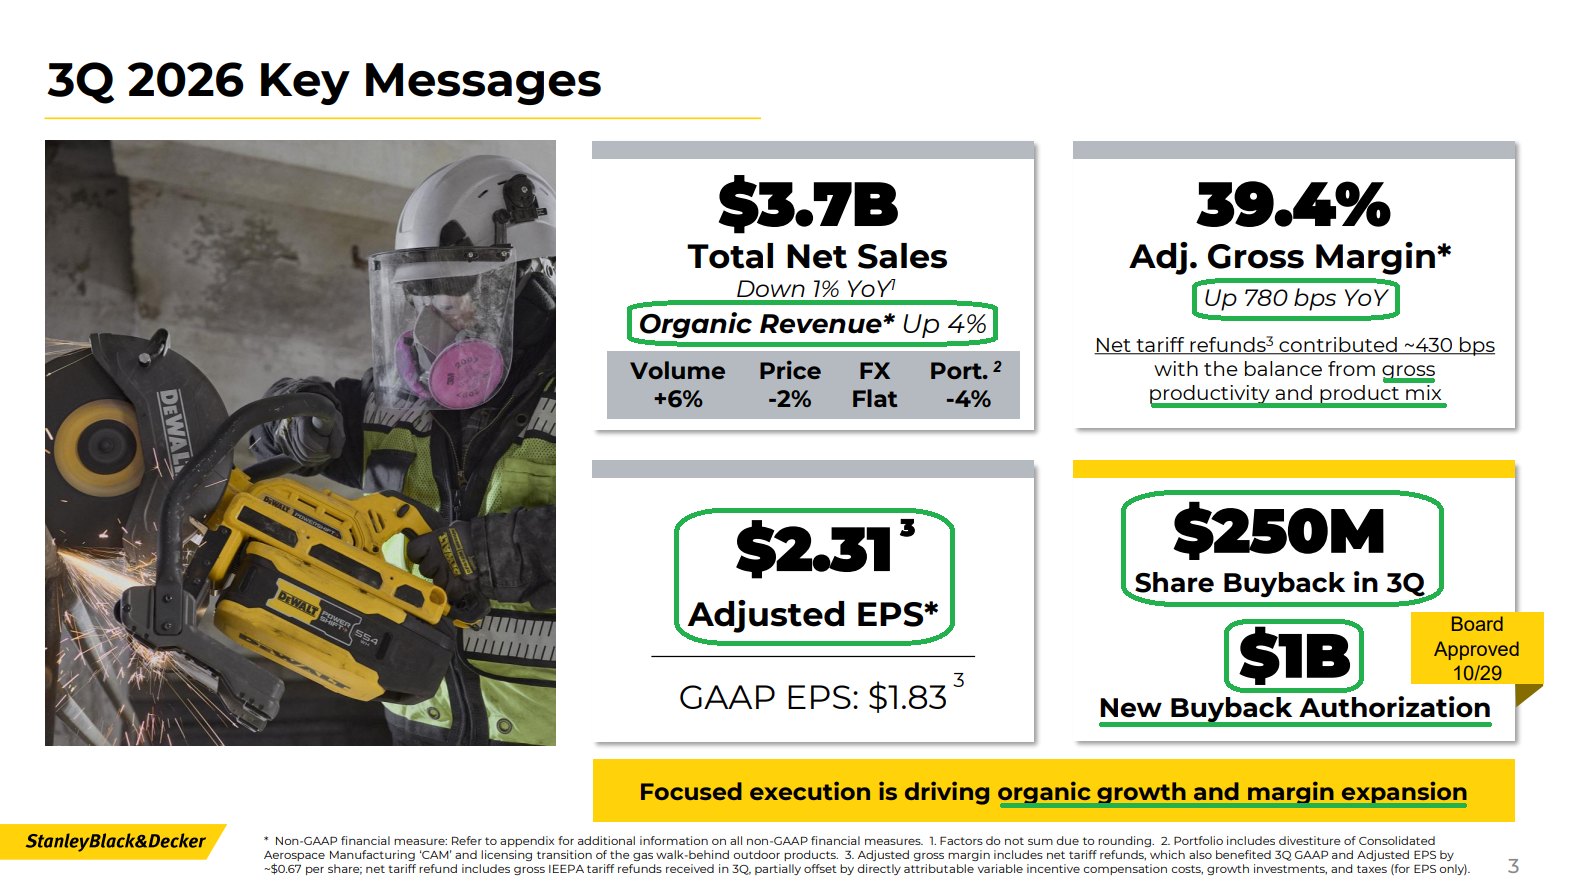
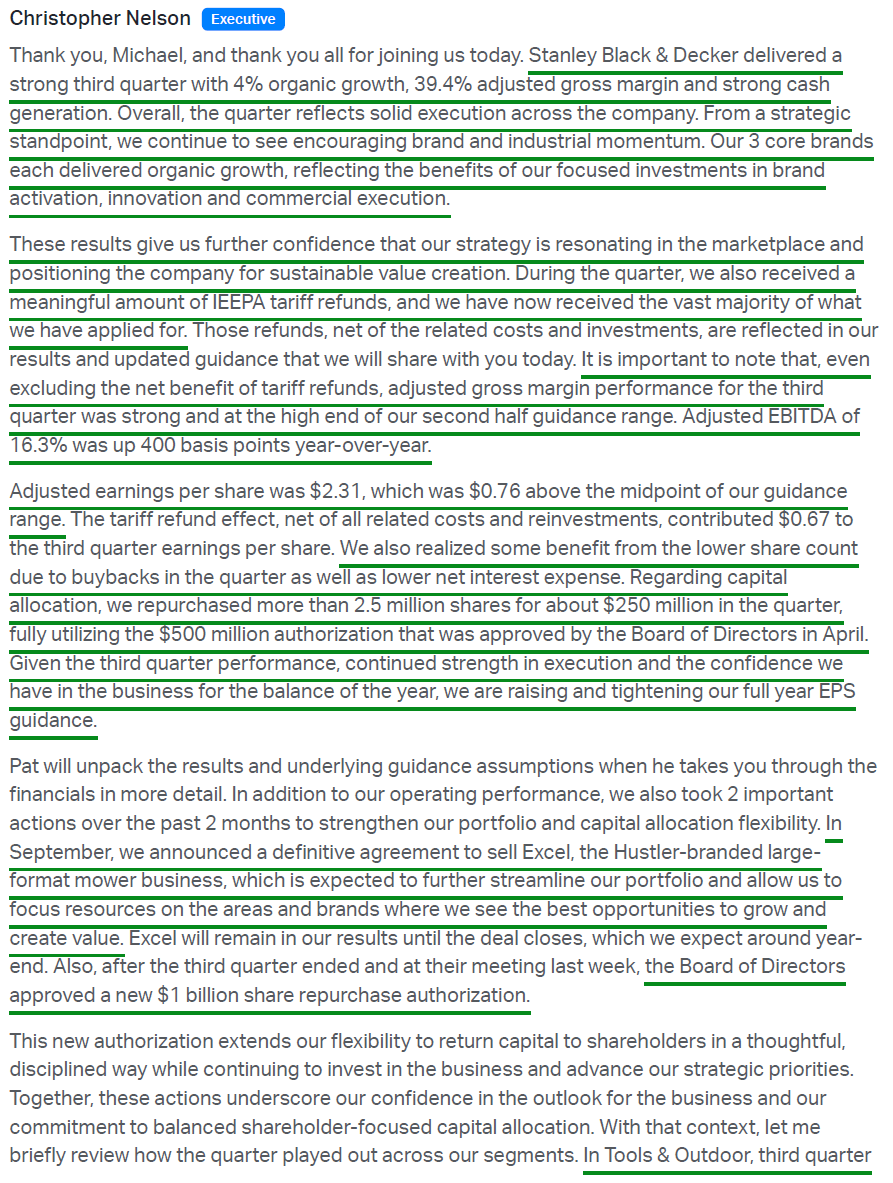
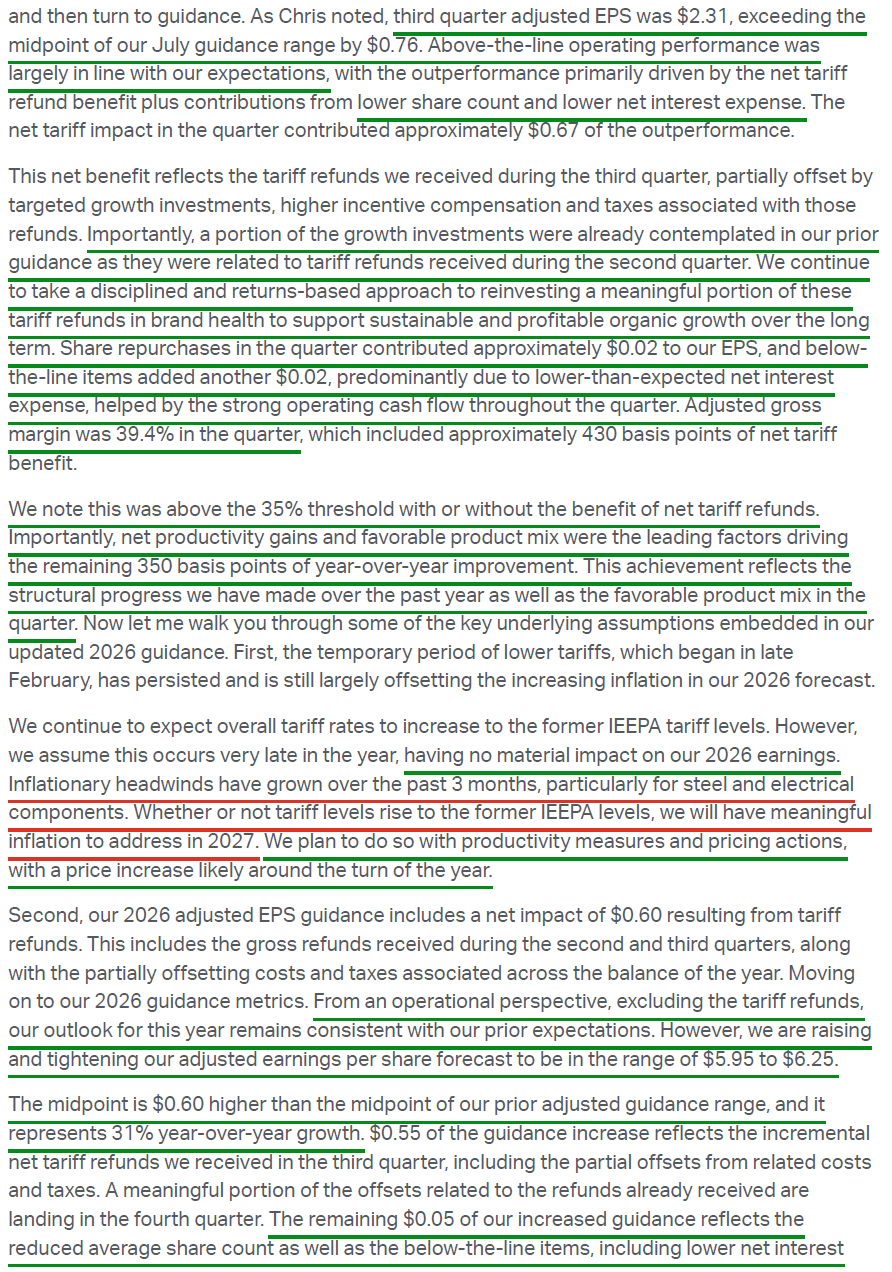
For a company the market has long treated as a housing proxy, Stanley Black & Decker keeps finding ways to grow without any help from housing. Organic growth accelerated to 4% in Q3 on revenue of $3.73B, landing at the high end of guidance and marking the fastest pace since Q4 2021. Adjusted EPS of $2.31 and adjusted gross margin of 39.4% both benefited from IEEPA tariff refunds, which generated a $180.7M pretax gain in the quarter, worth ~$0.67 of EPS and ~430 bps of margin. Backing out the tariff benefit, the underlying results were every bit as strong. Adjusted EPS of ~$1.64 (+14.7% Y/Y) still topped the ~$1.56 consensus and the high end of guidance, while adjusted gross margin of ~35.1% cleared the long-awaited 35% threshold at the heart of the entire turnaround. That prompted management to raise FY26 adjusted EPS guidance to $5.95-$6.25 (+31% Y/Y at the midpoint) and its free cash flow outlook to $1.0-$1.2B (vs. $688M in FY25), with the underlying operational outlook unchanged.
We laid out the full thesis last month (see article below), walking through how SWK has pulled its own levers to grow and expand margins while housing remains in the gutter.
Little has changed since then. Housing remains under pressure, with management still planning around a flat-to-down tools market, yet SWK continues to take share through its own execution. That progress was well underway before the tariff refunds arrived, but the refunds have given the strategy a shot in the arm. Rather than let them flow straight to the bottom line, management is directing the bulk toward growth investments on top of the $75-100M already planned for 2026. In effect, it is pulling forward $70-80M of spending originally earmarked for 2027 to expand its field presence, step up digital marketing and brand activation, while accelerating new product innovation.
Those investments continue to gain traction, with organic growth climbing from flat in Q1 to +3% in Q2 and +4% in Q3. That puts FY26 on track to be SWK’s first year of positive organic growth since the pandemic-driven pull-forward in 2021.
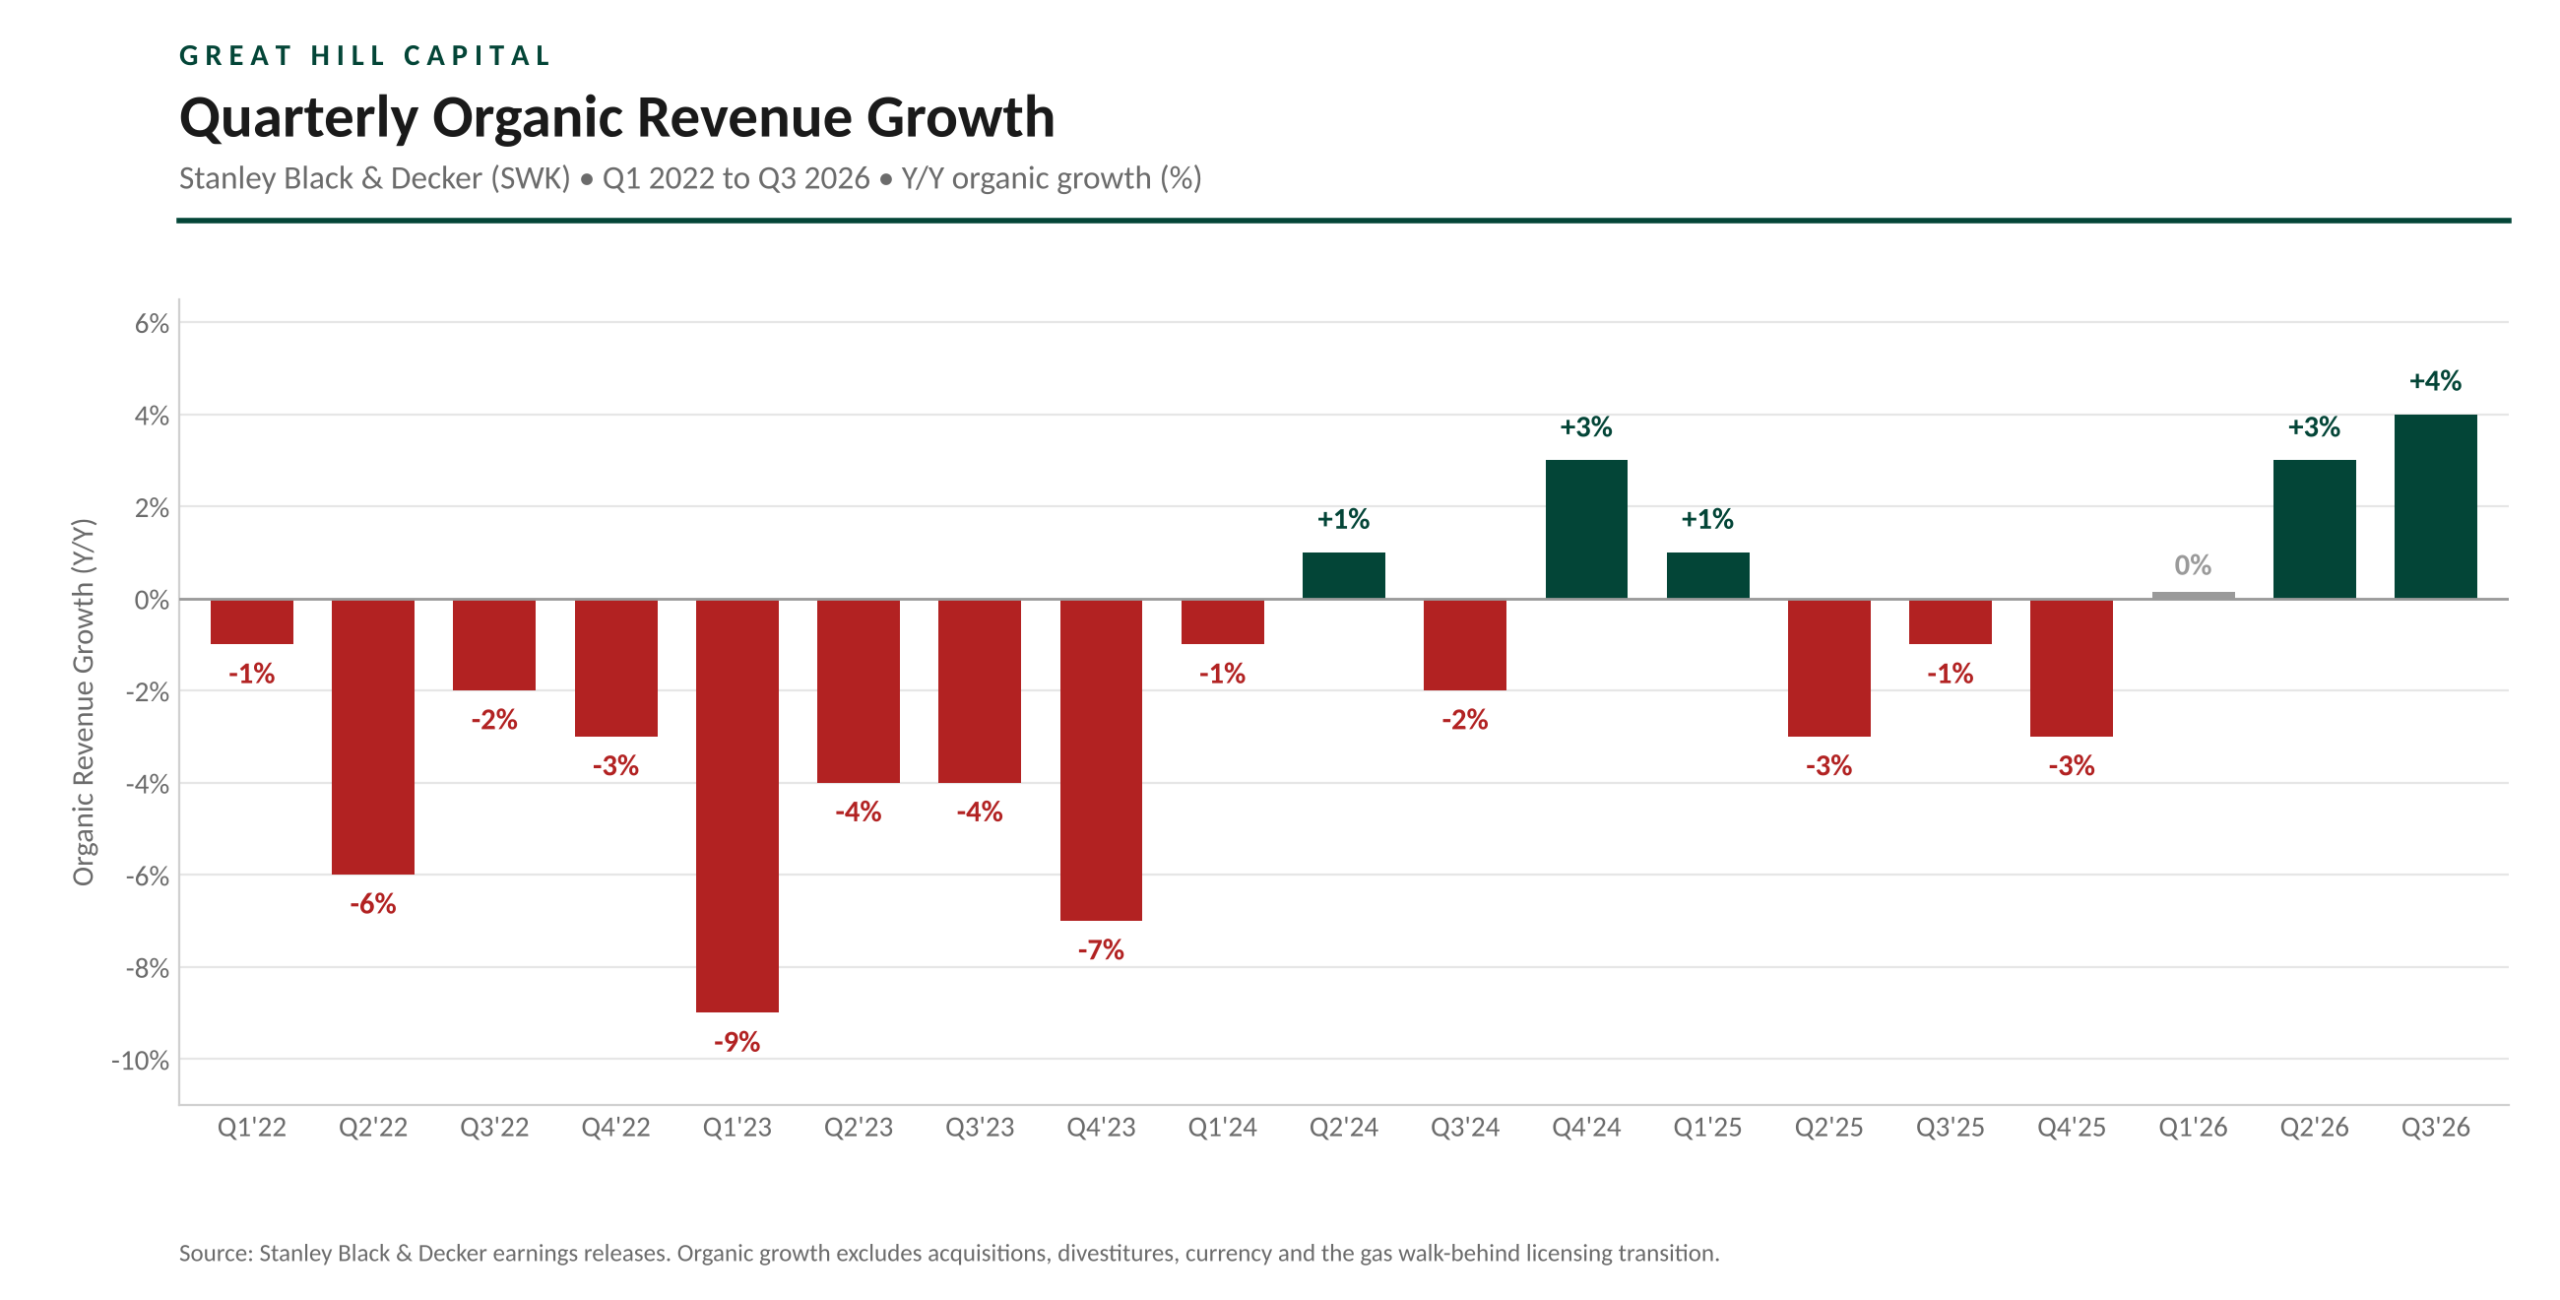
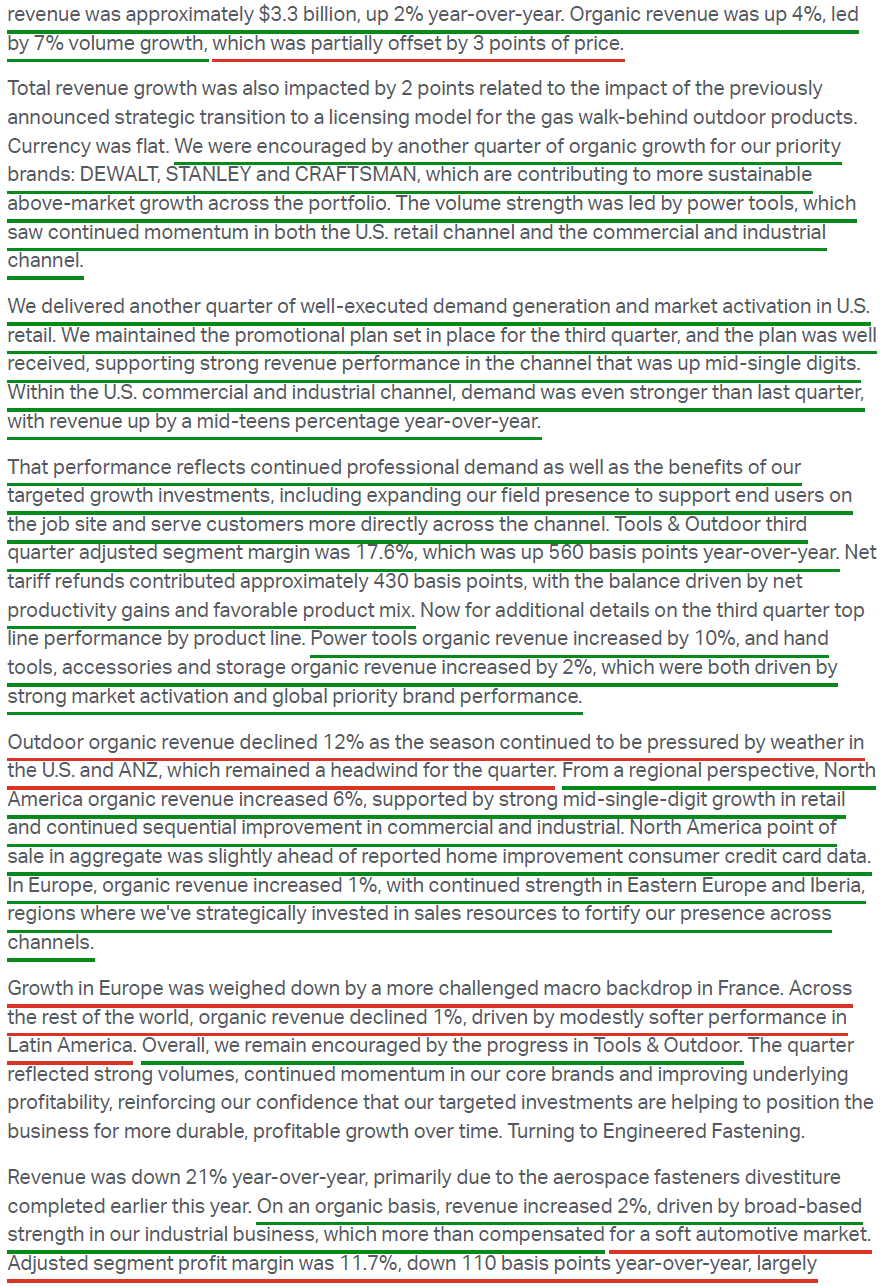
Power tools once again did the heavy lifting in Q3, accelerating to +10% organic growth from +8% in Q2, which had already marked the category’s strongest growth in several years. Much of that strength traces back to the pro customer. The U.S. commercial and industrial channel accelerated to mid-teens growth from low double digits last quarter as data center construction and a broad backlog of other job site work keep pro demand running hot, a trend management expects to continue. U.S. retail added mid-single-digit growth of its own, a solid result given how long the DIY customer has been under pressure.
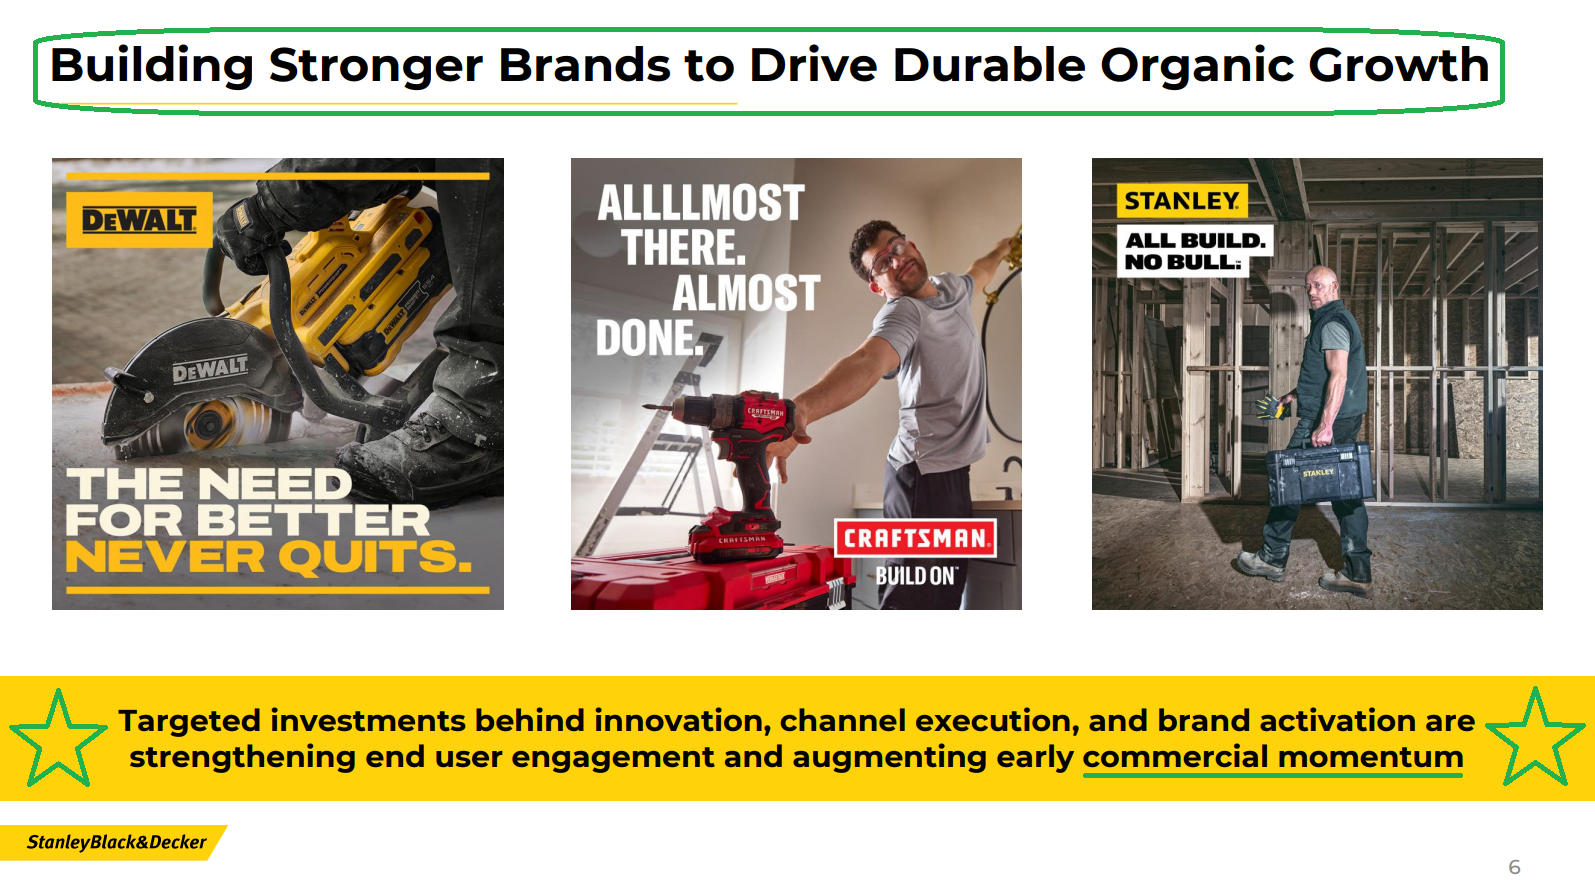
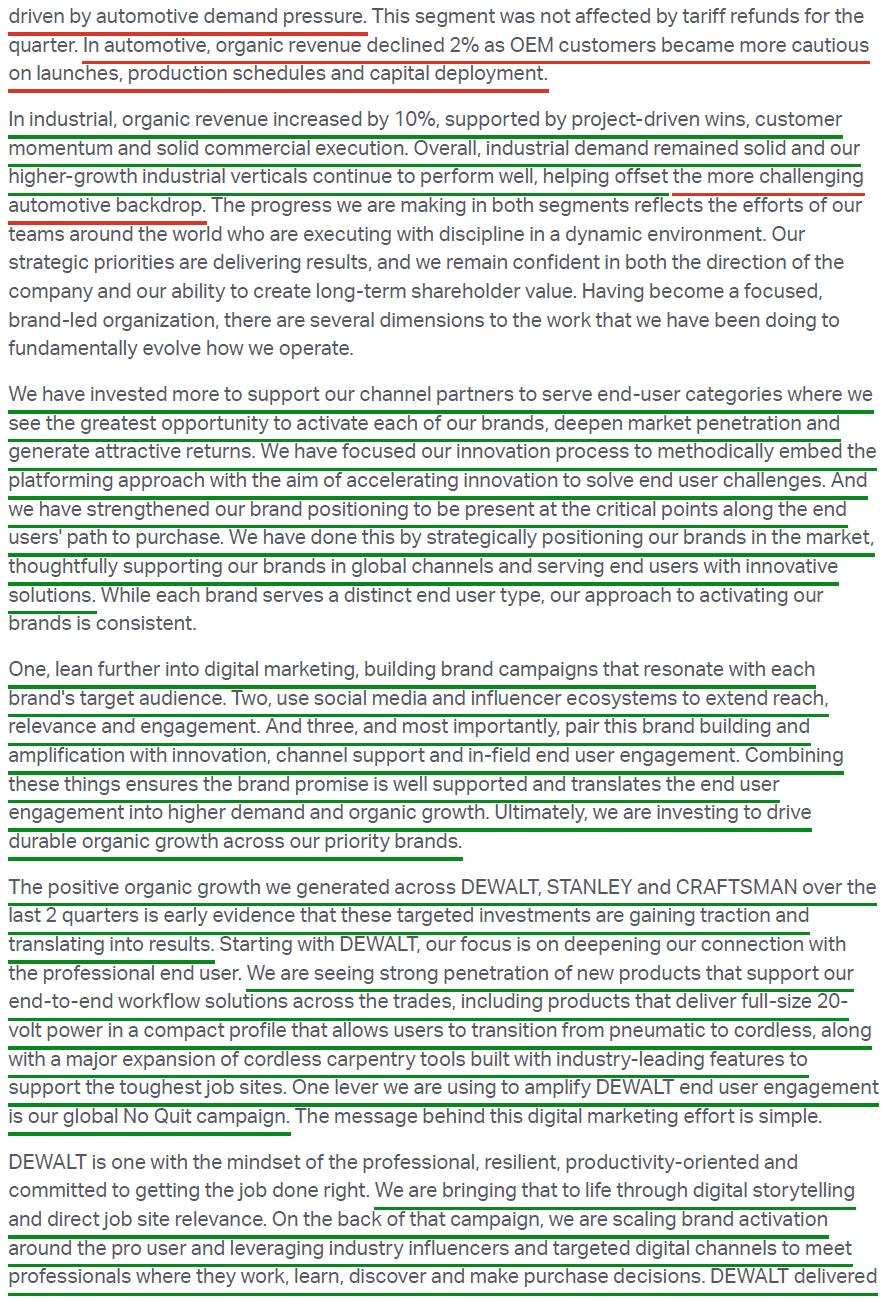
Most encouraging is how broad the growth has become. For years, DEWALT was left to carry the portfolio on its own, but STANLEY and CRAFTSMAN have now joined it, with all three brands delivering organic growth for two consecutive quarters. That consistency is a direct result of one of the biggest changes under CEO Chris Nelson, who reorganized the company around its brands rather than individual product lines, giving each its own general manager and a clearly defined end user.
Built for the pro, DEWALT grew across every region as investments in end-user specialists embedded with each trade continue to pay off. Those efforts are pulling more pros into a battery ecosystem where more than 80% of users stick with the same platform on their next purchase. CRAFTSMAN, repositioned as SWK’s DIY brand, is in its most active launch year since being acquired in 2017. Influencer partnerships are driving record brand engagement, while a ~30% reduction in new product development time across the company, with platforming serving as a major productivity unlock, is helping bring new tools to market faster. STANLEY, which generates more than 60% of its sales in Europe, is working through an eight-wave refresh of its product lines, now supported by a dedicated sales force focused on the European hand tool wholesalers that drive the business.
Management expects that momentum to carry into the fourth quarter, guiding to +3-4% organic growth in Tools & Outdoor and keeping the segment on track for low-single-digit organic growth for the full year.
Home Depot and Lowe’s both reported results this week for quarters that ran about a month past SWK’s quarter-end, offering a positive early read on Q4. Home Depot (15% of sales) beat expectations with its highest comp growth in four years, led by double-digit comps in its power tools department, while its Pro customer continued to outpace DIY. Lowe’s (12% of sales) also beat, with comps up 1.8% on positive growth in tools and hardware. It also cited strong Pro demand for new DEWALT generators and an expanded lineup that now gives it the largest DEWALT assortment of any U.S. home improvement retailer. Both retailers raised full-year sales guidance on steady underlying demand, with SWK’s brands front and center heading into the key holiday selling season.
The progress on adjusted gross margin has been just as impressive. Excluding refunds, adjusted gross margin of ~35.1% expanded 350 bps Y/Y on productivity and favorable mix, up from ~31.2% in Q2 and more than 15 ppts above the 19.5% trough in Q4 2022. Including refunds, YTD adjusted gross margin now stands at 34.4% (+460 bps Y/Y), keeping FY26 on track for ~34.2% (~350 bps of expansion, ~150 bps from refunds).
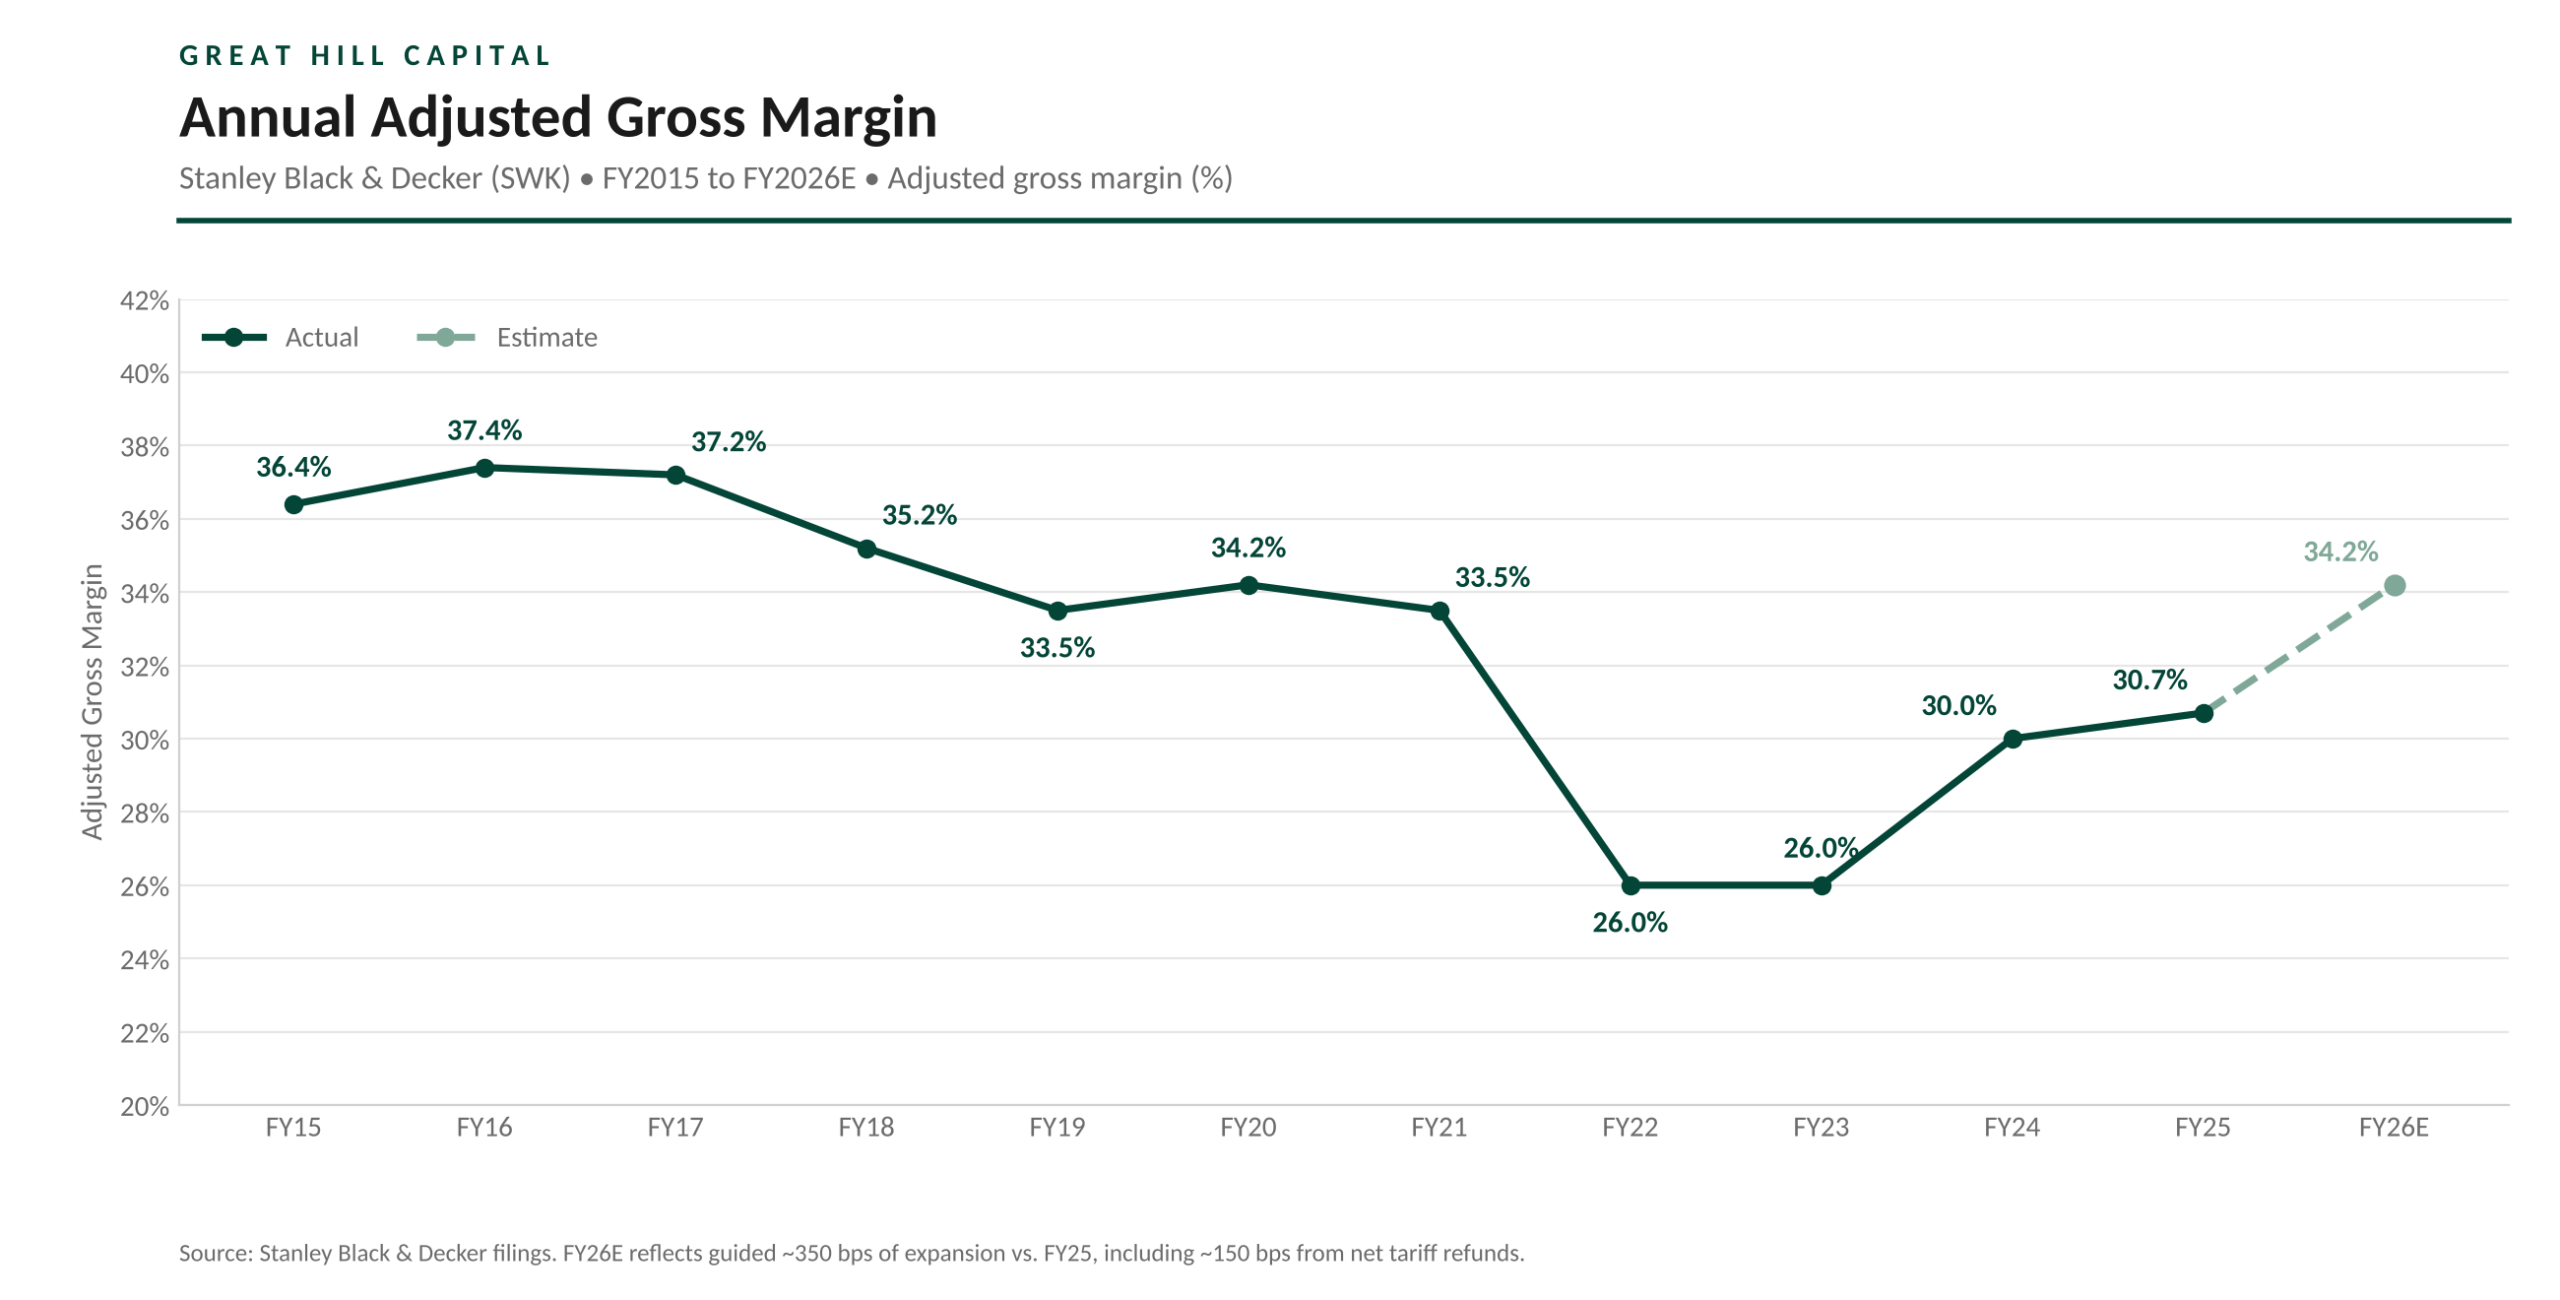
Even as that refund benefit falls away, management expects to land at or very close to 35% in 2027, with another 150-200 bps of net productivity gains and a modest low-single-digit price increase offsetting rising inflation. That keeps the long-awaited 35-37% target for 2028 firmly in place. For context, the last time SWK cleared 35% for a full year was 2018, when it earned $8.15 per share and the stock traded north of $150. With a far leaner cost structure today and a shrinking share count, we see a path not only back to those earnings levels, but considerably beyond over time.
That margin progress is translating just as clearly into free cash flow. Q3 free cash flow of $585M came in well ahead of the ~$222M the Street was expecting, bringing YTD free cash flow to $836M versus an outflow of $195M a year ago. At the $1.1B midpoint of FY26 guidance, backing out ~$300M of tariff refunds and adding back ~$200M of one-time taxes and fees tied to the CAM sale leaves ~$1.0B of underlying free cash flow, or a ~6.2% yield at today’s price.
With leverage heading toward ~2.5x by year-end and balance sheet repair now a closed chapter, that cash is making its way back to shareholders. SWK repurchased $500M of stock this year, retiring ~4% of its shares, before the Board approved a new $1B authorization in October. That comes alongside a ~3.0% dividend yield and a payout history spanning 150 consecutive years, with 59 straight annual increases, the longest such record of any industrial company on the NYSE.
With the stock up 54% YTD and more than double its lows, the market has clearly started to reward SWK for its execution. Shares now trade at ~17x forward earnings, in line with their historical average, so a breather after such a big move would come as no surprise. Zooming out, however, we still see this story in its early innings. Execution alone has carried the stock this far, with the housing tailwind still ahead. A ~4M-unit housing shortage, an average home now ~42 years old, and millennials moving into their prime family formation years all point to a recovery being a matter of when, not if. From today’s depressed levels, we continue to see the risk-reward in housing as firmly skewed to the upside. When housing finally turns, it will be the whipped cream and cherry on top of an already improving business.
Q3 Earnings Breakdown
10 Key Points
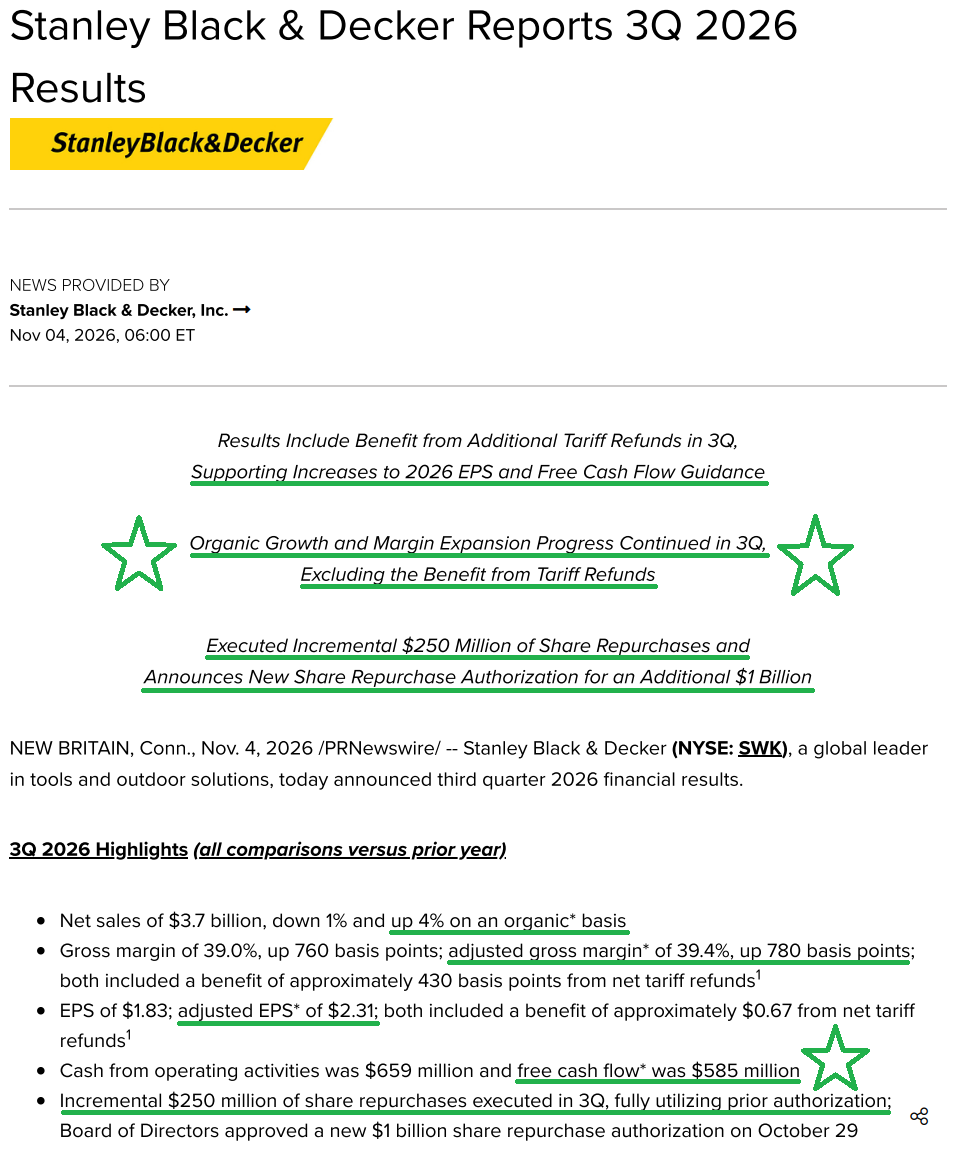
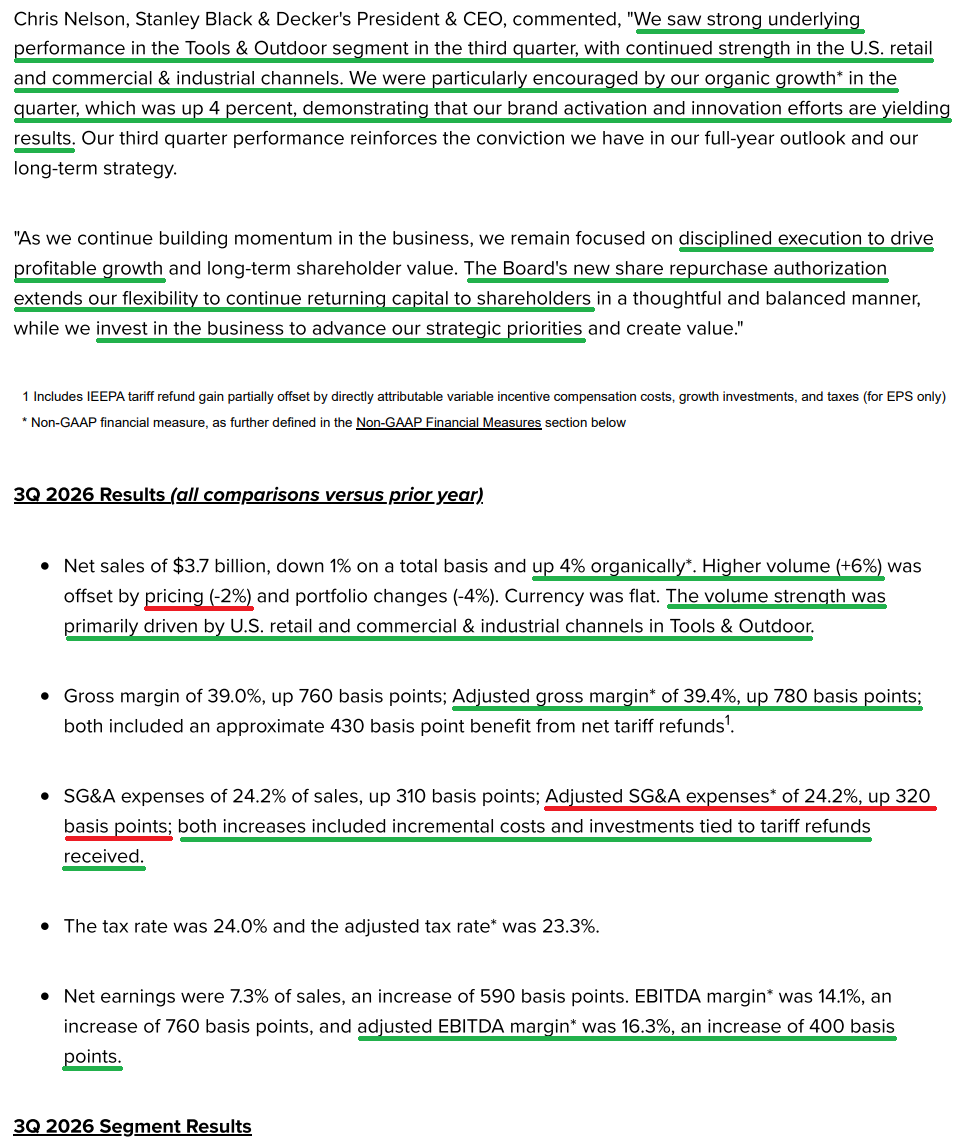
1) SWK reported Q3 revenue of $3.73B, down 0.6% Y/Y on a reported basis and up 4% organically. The figure was in line with consensus and at the top end of the 3% to 4% organic growth guide. Higher volume (+6%) was offset by lower pricing (-2%) and a ~4% portfolio drag from the CAM divestiture and the transition to a licensing model for gas walk-behind outdoor products, with currency flat. Organic growth accelerated from flat in Q1 and +3% in Q2 to its highest quarterly level since 2021. Volume strength was concentrated in U.S. retail (up mid-single digits) and the commercial and industrial (C&I) channel (up mid-teens) within Tools & Outdoor. YTD revenue reached $11.54B (+0.8% Y/Y), with YTD organic growth of ~2%.
2) Adjusted EPS of $2.31 came in well ahead of consensus of ~$1.56 and $0.76 above the midpoint of July guidance, up 61.5% Y/Y from $1.43. The outperformance was driven primarily by net tariff refunds (~$0.67 after related incentive compensation, growth investments, and taxes), along with ~$0.02 each from a lower share count and lower net interest expense. Excluding refunds, adjusted EPS of ~$1.64 (+14.7% Y/Y) still cleared both consensus and the high end of the $1.50 to $1.60 guide. YTD adjusted EPS reached $4.66 versus $3.26 last year (+42.9%).
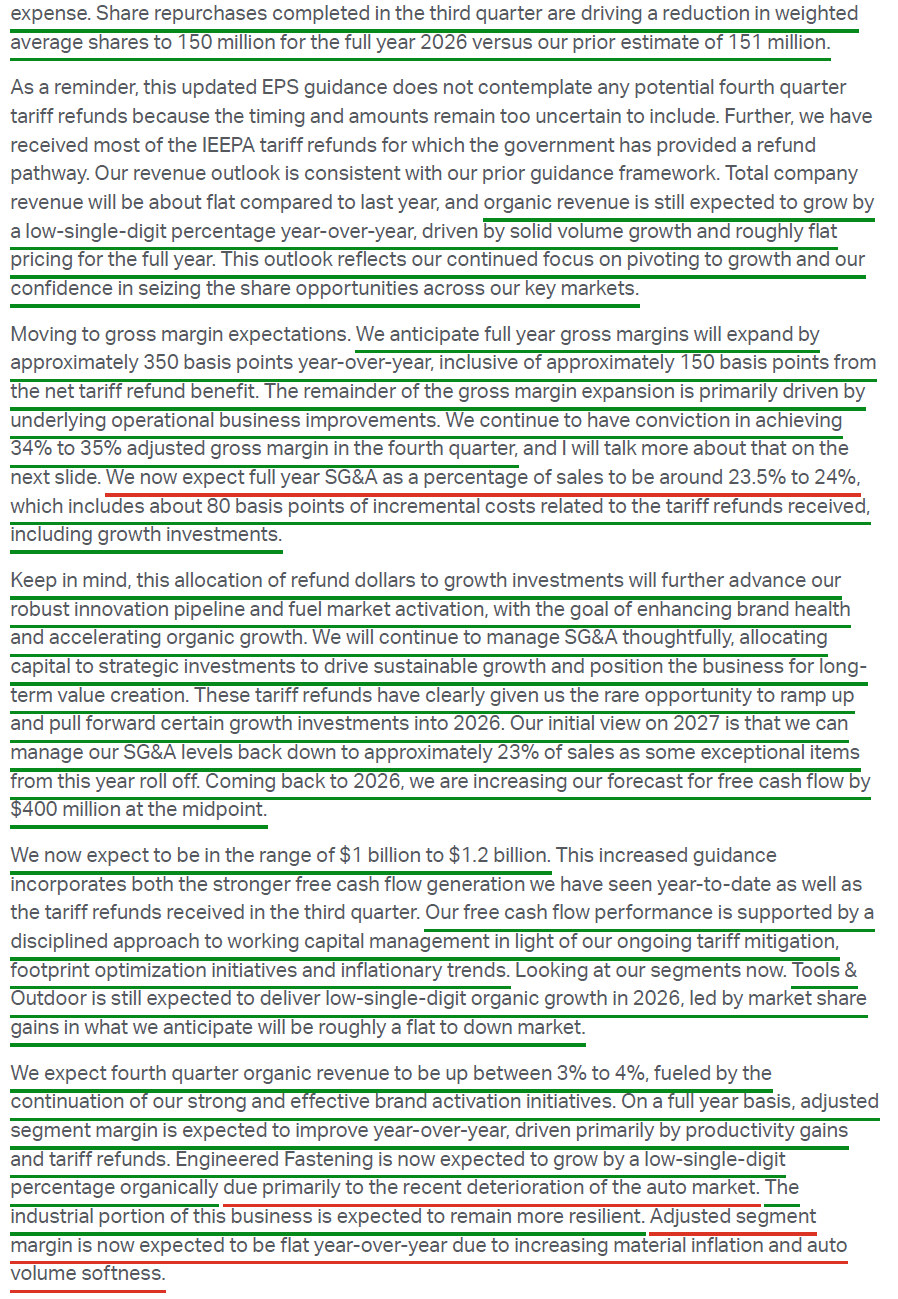
3) Adjusted gross margin reached 39.4% in Q3, up 780 bps Y/Y, with ~430 bps coming from net tariff refunds. Even excluding refunds, adjusted gross margin of ~35.1% (+350 bps Y/Y) topped consensus of ~34.3%, clearing the 35% threshold on net productivity gains and favorable product mix. That compares to ~31.2% ex-refunds in Q2, bringing YTD adjusted gross margin to 34.4% (+460 bps Y/Y). For the full year, management now expects ~350 bps of expansion off FY25’s 30.7%, including ~150 bps from net tariff refunds. Q4 remains guided to 34% to 35% (vs. 33.3% last year) on continued productivity and tariff mitigation initiatives, with the long-term target of above 35% toward 37% unchanged.
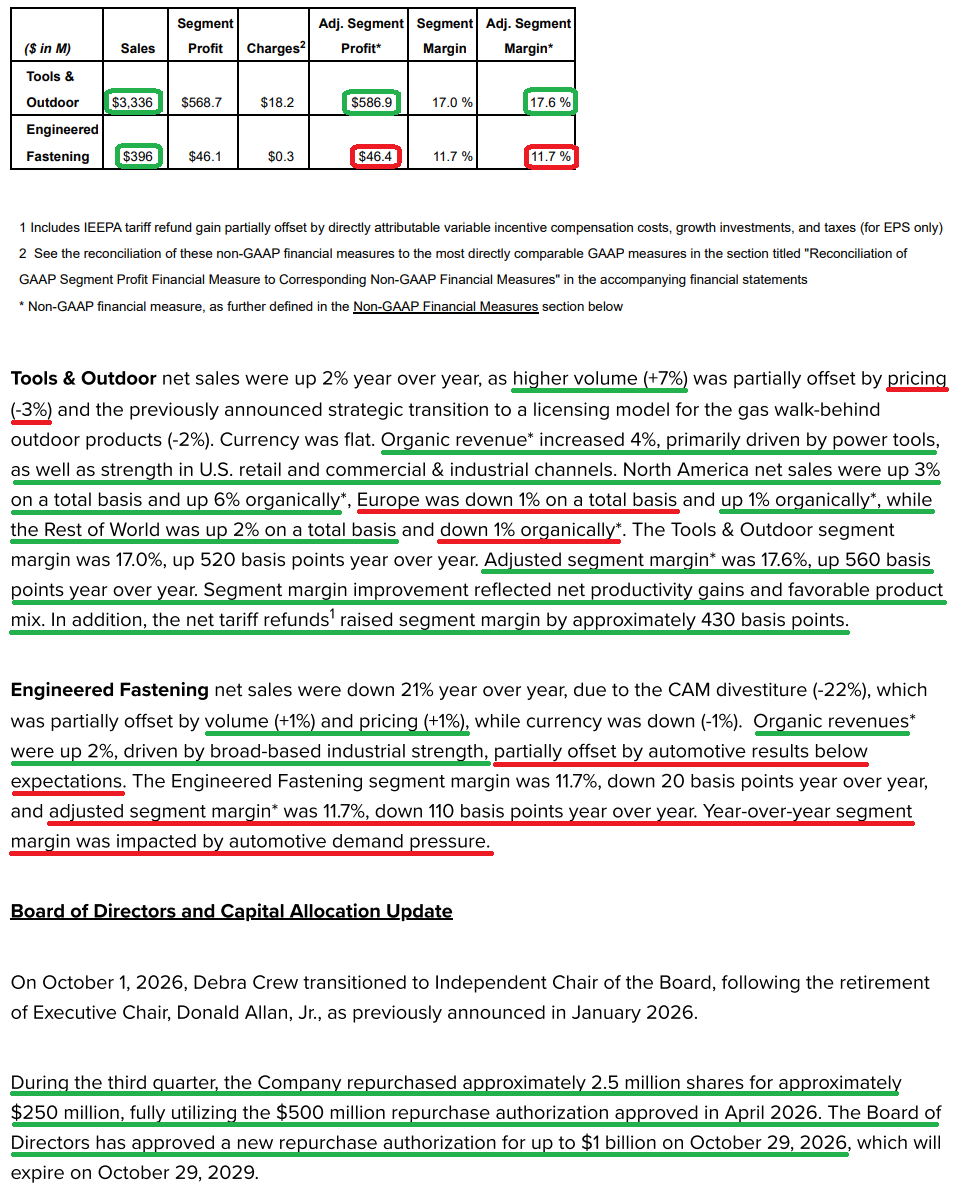
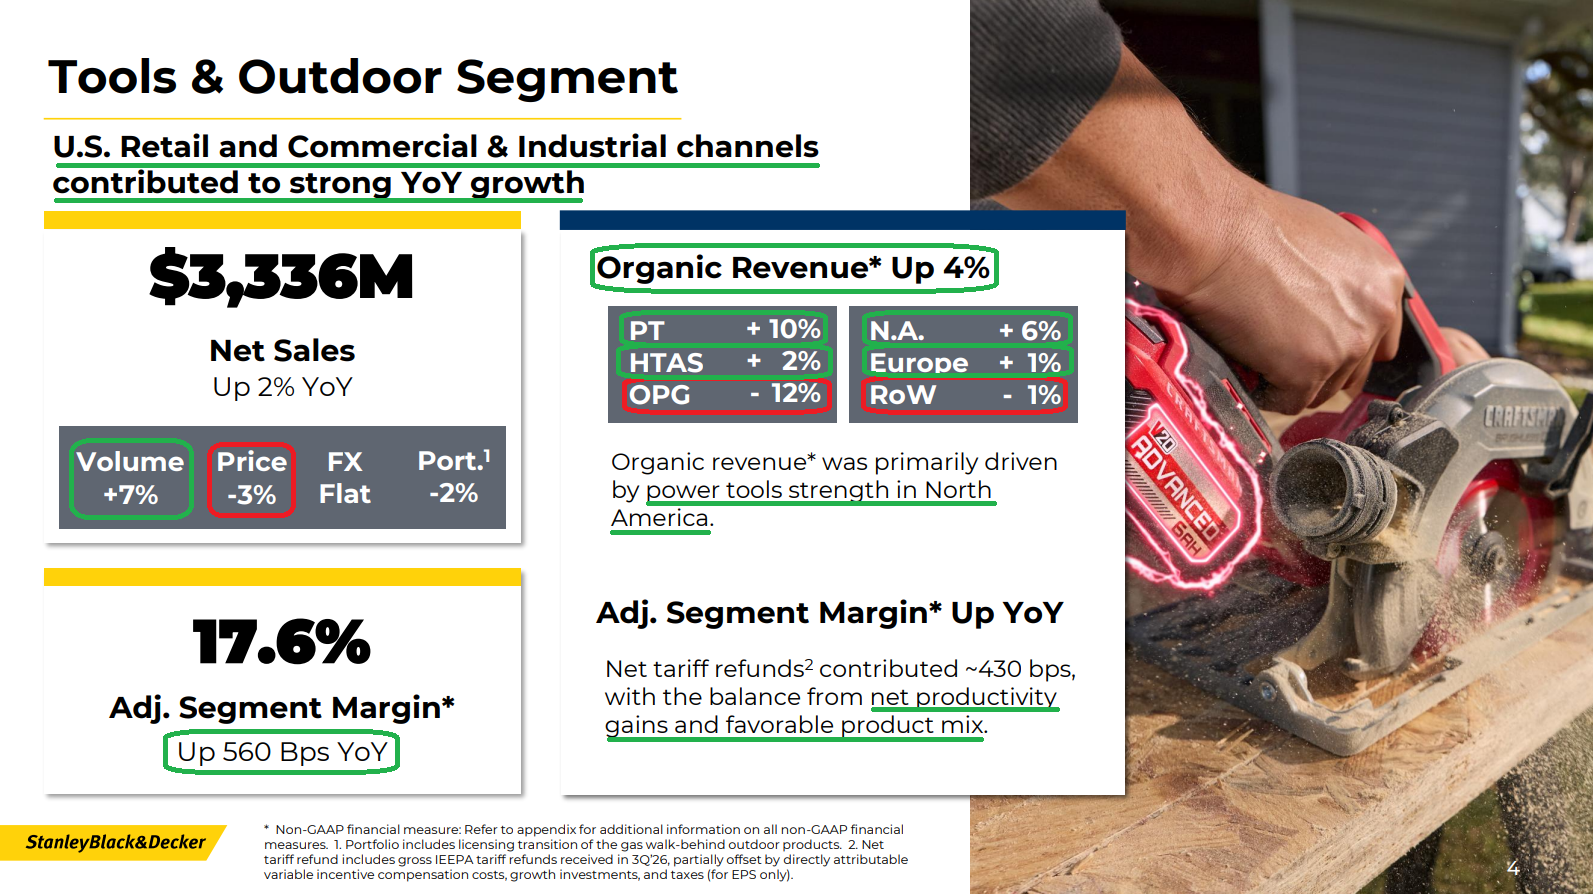
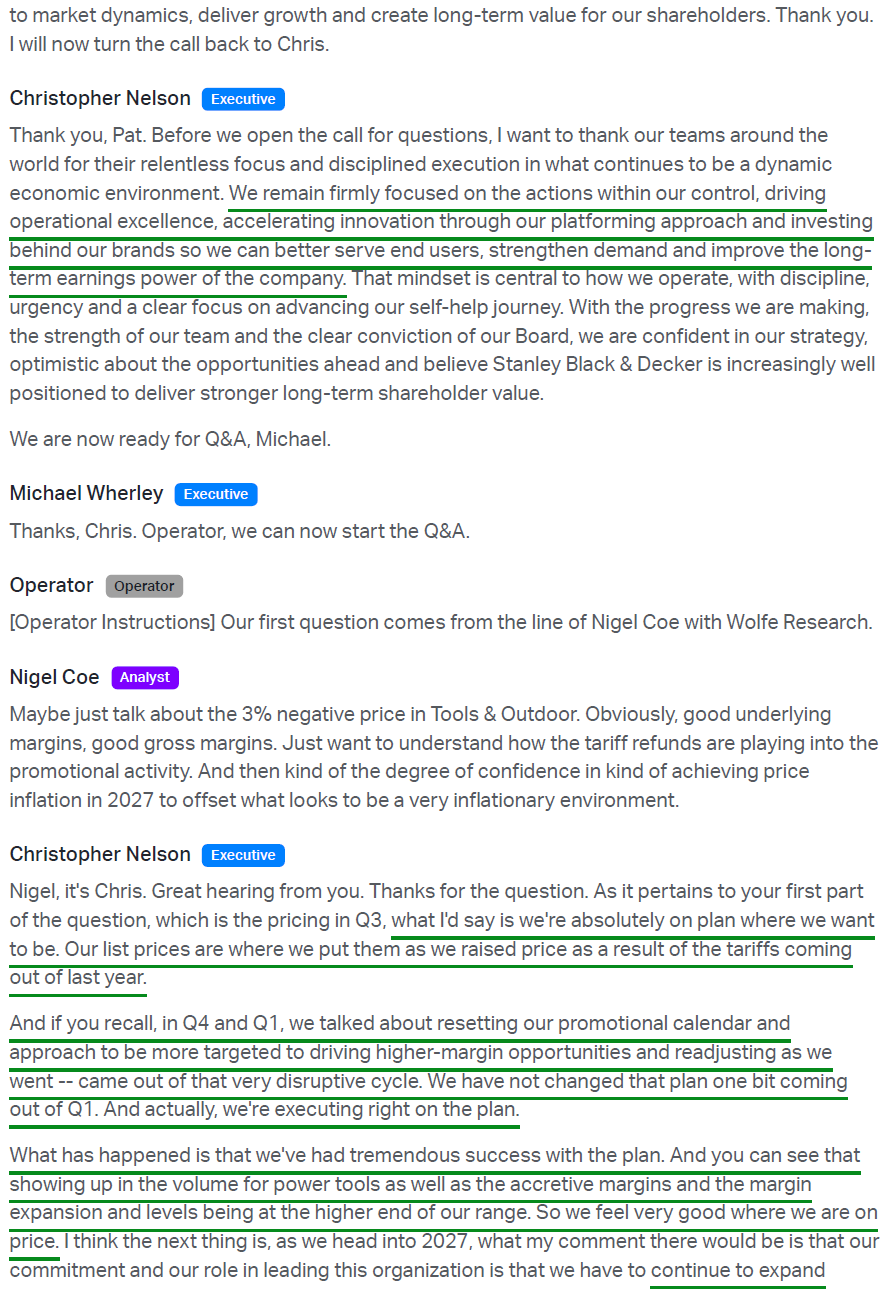
4) The Tools & Outdoor segment posted Q3 net sales of $3.34B, up 2% on a reported basis and 4% organically. Higher volume (+7%) was partially offset by lower pricing (-3%) and a 2% drag from the gas walk-behind licensing transition, with currency flat. Management noted that lower pricing reflects the promotional calendar reset running to plan, with list prices holding. Growth was led by power tools, where organic growth accelerated to +10% from +8% in Q2, alongside a 2% gain in hand tools, accessories, and storage, partially offset by a 12% decline in Outdoor on weather pressure. North America grew 6% organically on U.S. retail up mid-single digits and C&I up mid-teens. Europe grew 1%, while Rest of World declined 1% on softer Latin America, bringing YTD segment organic growth to ~2%. Adjusted segment margin of 17.6% expanded 560 bps Y/Y, with ~430 bps from net tariff refunds and the balance from net productivity and favorable mix. Management still expects low-single-digit organic growth for the segment in FY26, driven by share gains in a ~flat to down market.
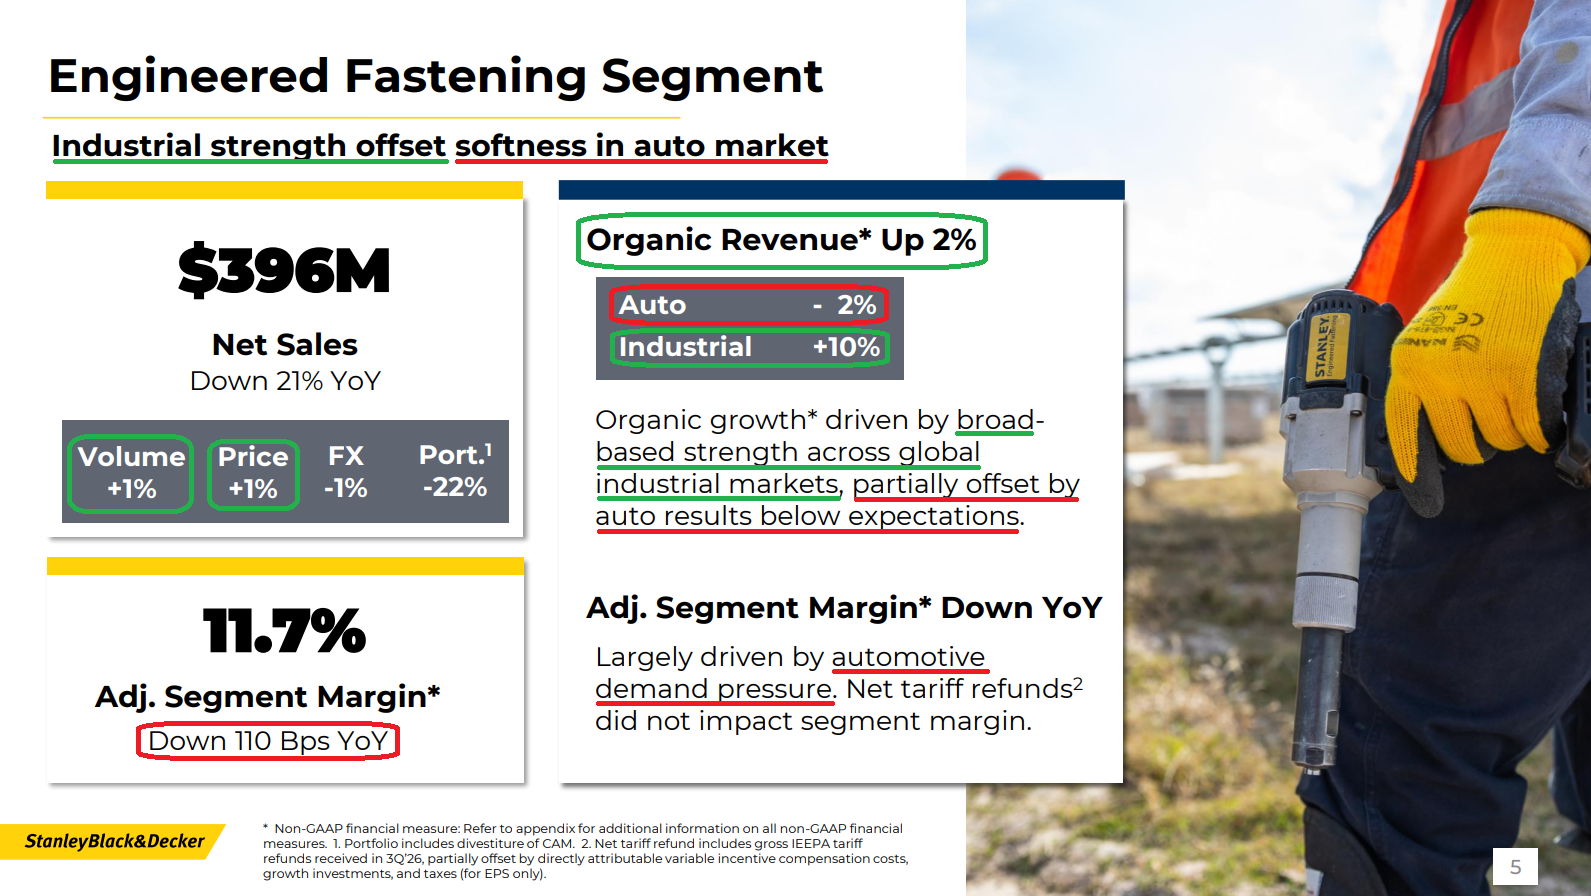
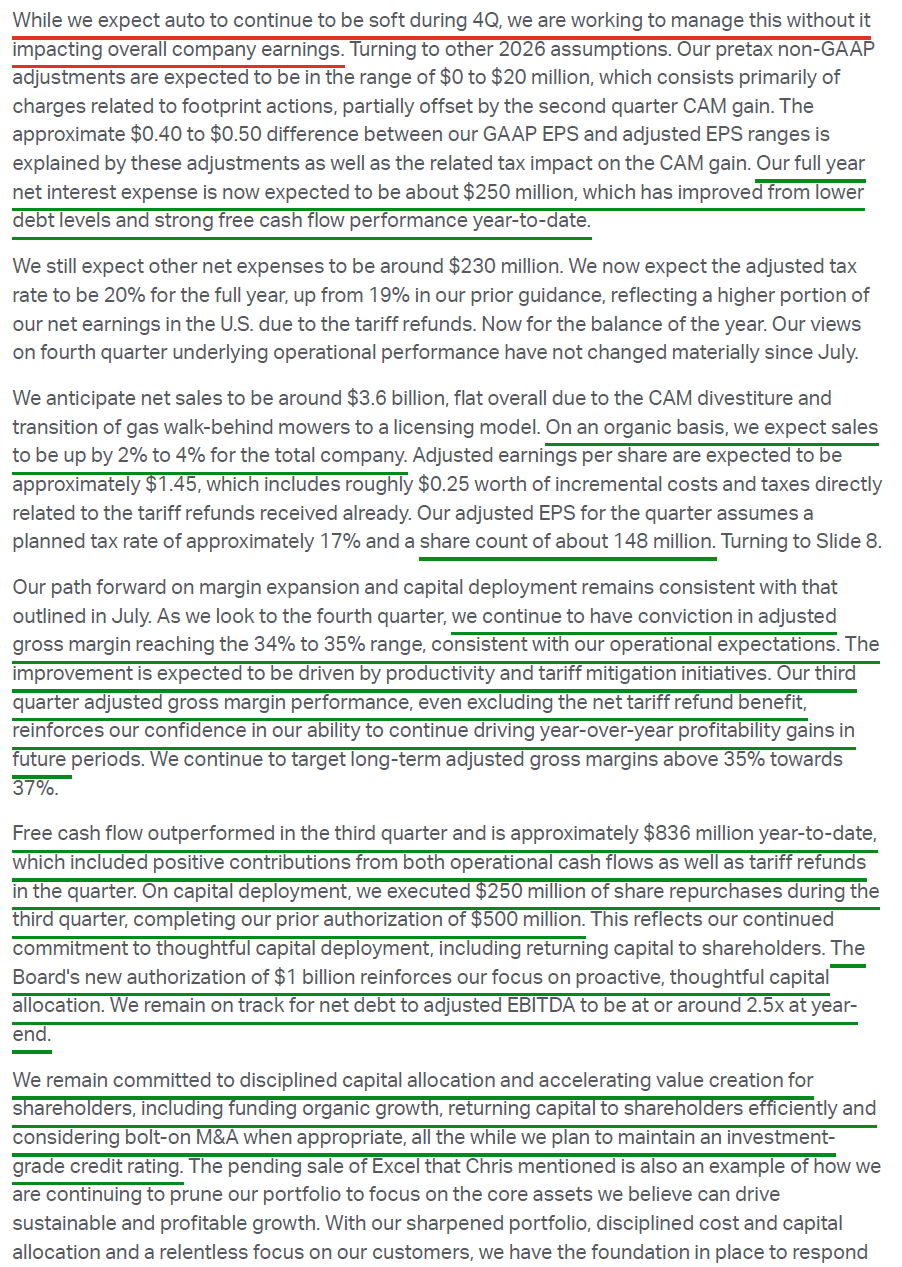
5) The Engineered Fastening segment (~11% of total sales) posted Q3 net sales of $396M, down 21% on a reported basis but up 2% organically. The CAM divestiture created a 22% headwind, partially offset by volume (+1%) and pricing (+1%), with currency down 1%. Industrial grew 10% organically on project-driven wins and solid commercial execution, more than offsetting a 2% decline in Automotive as OEM customers grew more cautious on launches, production schedules, and capital deployment. Adjusted segment margin of 11.7% declined 110 bps Y/Y on automotive demand pressure, with the segment receiving no tariff refund benefit. YTD segment organic growth stands at ~4%, helped by aerospace strength in Q1 before the CAM sale. Given the deterioration in auto, management lowered its FY26 outlook to low-single-digit organic growth (from low-to-mid single digits), with a flat Y/Y segment margin (previously positive).
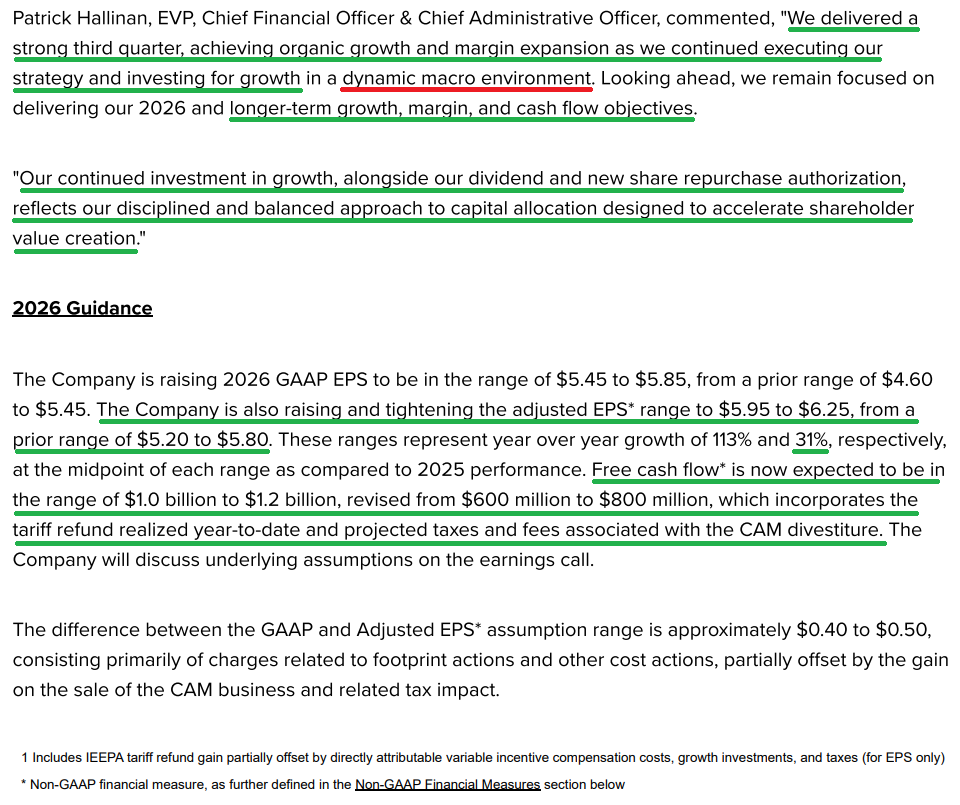
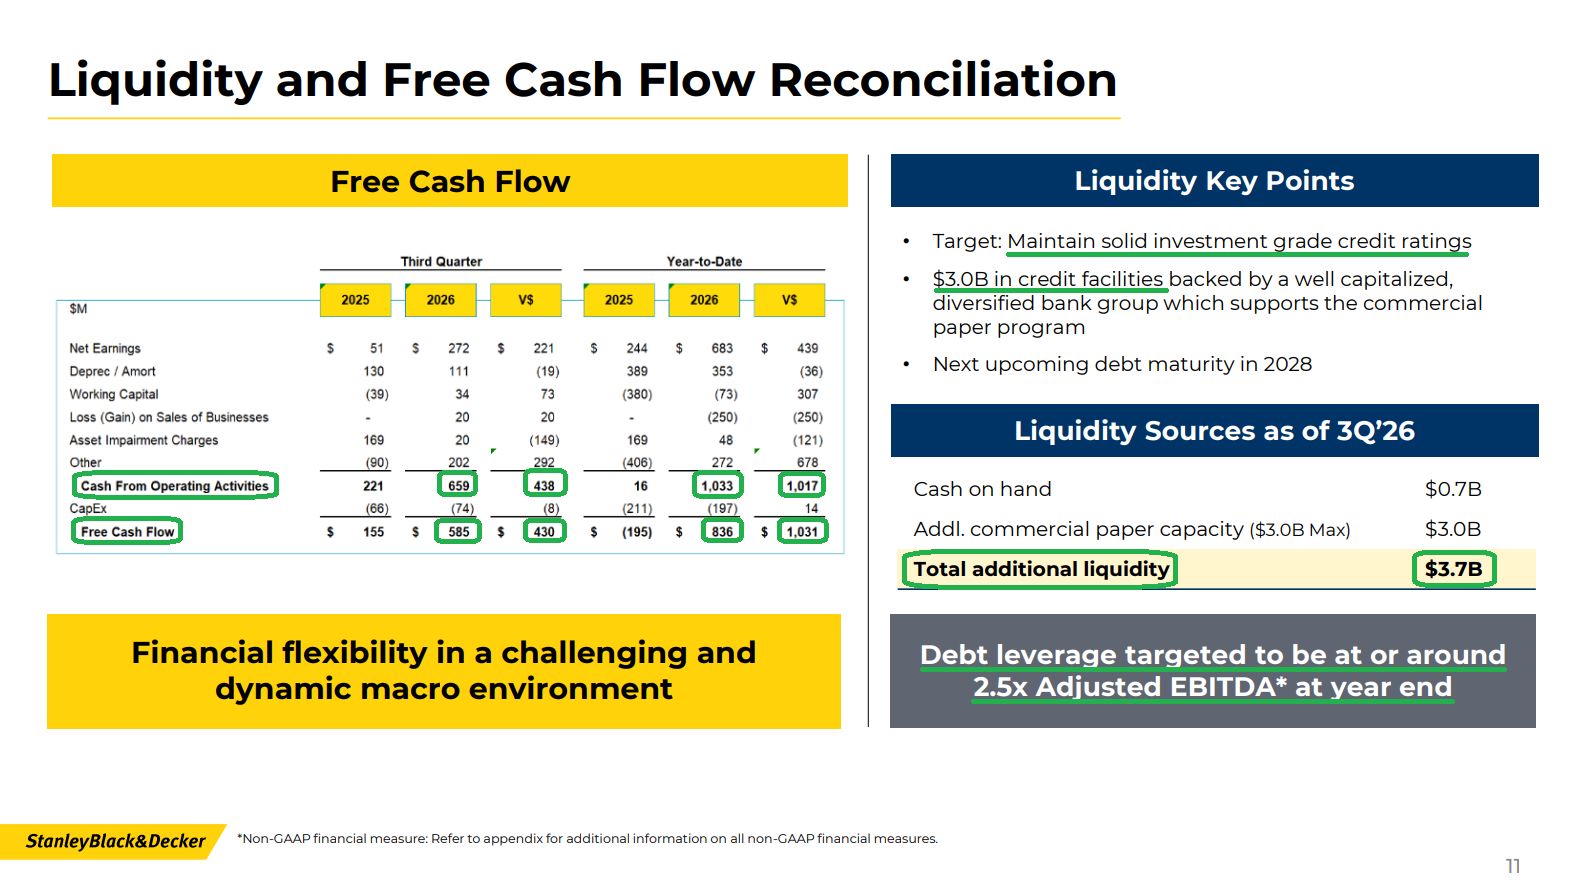
6) Cash from operating activities of $659M drove free cash flow of $585M in the quarter, up 276.7% from $155M last year and well ahead of consensus of ~$222M. Performance was supported by both operational cash generation and net tariff refunds, alongside disciplined working capital management, with inventories down to $3.84B from $4.16B at year-end. YTD free cash flow reached $836M versus an outflow of $195M a year ago, already well above FY25’s $688M. Management raised FY26 FCF guidance by $400M at the midpoint to $1.0B to $1.2B (from $600M to $800M), versus consensus of ~$775M. The new range incorporates YTD outperformance and refunds received, net of projected CAM-related taxes and fees.
7) SWK repurchased ~2.5M shares for $250M in Q3, fully utilizing the $500M authorization approved in April (~5.8M shares repurchased in total), with diluted share count down 2.2% Y/Y to ~148.6M. The Board followed with a new $1B repurchase authorization on October 29, running through October 2029. With management describing the company as being at the end of its major transformational cycle and any future portfolio moves limited to pruning around the edges, capital allocation priorities now center on funding organic growth, returning capital to shareholders, and bolt-on M&A when appropriate. On the dividend front, the quarterly payout stands at $0.84 per share (~3% yield), extending a record of 150 consecutive years of payments, alongside 59 consecutive years of increases.
8) SWK ended Q3 with $741M of cash (up from $280M at year-end) against $4.7B of long-term debt, with short-term borrowings fully paid down from $606M at year-end. Total liquidity stands at ~$3.7B, with no debt maturities until 2028. The lower debt load and strong YTD cash generation have also brought the full-year net interest expense estimate down to ~$250M from ~$255M. Management remains on track for net debt to adjusted EBITDA of ~2.5x by year-end, inclusive of buybacks, down from 5.9x at the end of 2023, with maintaining an investment-grade credit rating a stated priority.
9) SWK has now received the vast majority of the IEEPA tariff refunds it applied for, recognizing a $180.7M pretax gain in Q3 ($298.7M YTD), with FY26 adjusted EPS guidance including ~$0.60 of net refund benefit. Rather than letting the refunds fall to the bottom line, management is using them to pull forward $70M to $80M of growth investment originally planned for 2027 across field presence, brand activation, and the new product pipeline. That lifts FY26 SG&A to ~23.5% to 24% of sales (including ~80 bps of refund-related costs) before returning toward ~23% in 2027. On the cost side, the temporary period of lower tariffs since late February is still largely offsetting rising inflation in steel, electrical components, resins, battery metals, and tungsten, with tariffs assumed to return to IEEPA levels very late in the year. With inflation to address in 2027 regardless of the tariff path, management plans to pair continued productivity with a price increase likely around the turn of the year.
10) SWK raised and tightened FY26 adjusted EPS guidance to $5.95 to $6.25 from a prior range of $5.20 to $5.80, with the $6.10 midpoint implying +31% Y/Y growth versus consensus of ~$5.60. Of the $0.60 midpoint increase, ~$0.55 reflects incremental Q3 net tariff refunds. The remaining ~$0.05 comes from a lower share count (~150M from ~151M) and below-the-line items, leaving the underlying operational outlook unchanged and excluding any potential Q4 refunds. Total revenue is still expected to be ~flat Y/Y, with low-single-digit organic growth driven by solid volume and ~flat pricing. For Q4, management guided to net sales of ~$3.6B, organic growth of 2% to 4%, and adjusted EPS of ~$1.45, including ~$0.25 of incremental costs and taxes tied to refunds already received.
Earnings Call Highlights
General Market
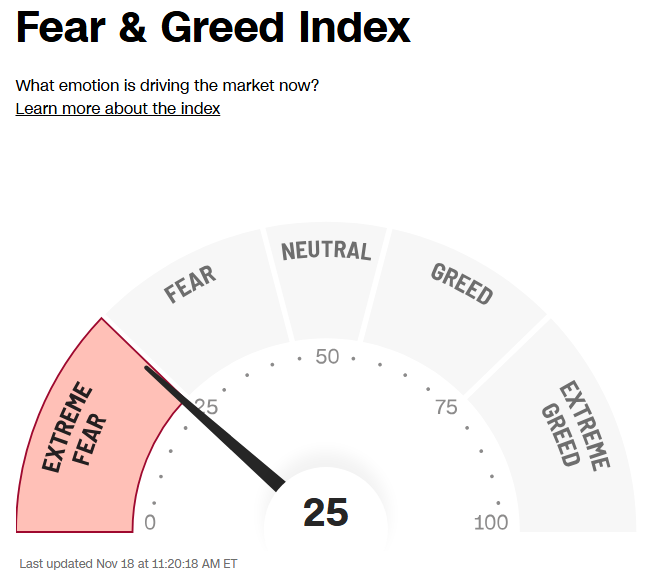
The CNN “Fear and Greed Index” ticked down to 25 this week from 37 last week. You can learn how this indicator is calculated and how it works here: (Video Explanation)
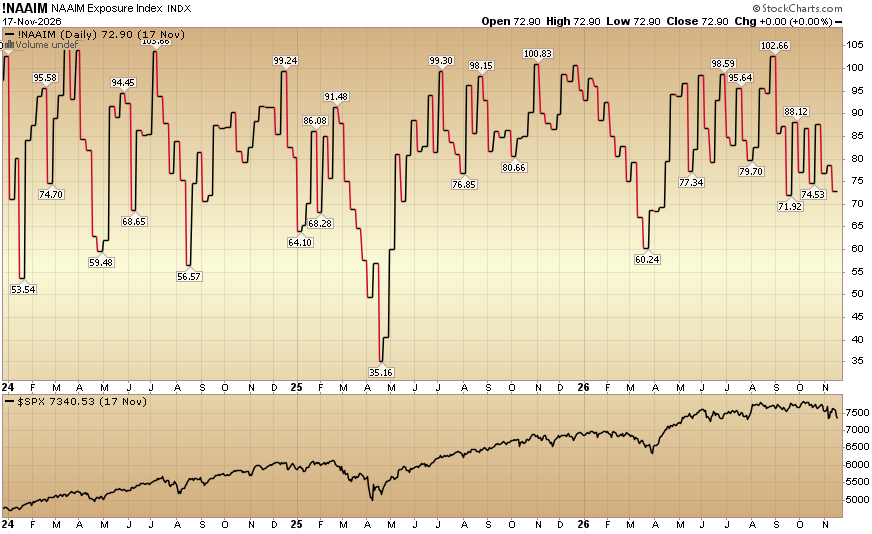
The NAAIM (National Association of Active Investment Managers Index) (Video Explanation) ticked down to 72.90% equity exposure this week from 78.62% last week.
Our podcast|videocast will be out sometime today. We have a lot of great data to cover this week. Each week, we have a segment called “Ask Me Anything (AMA)” where we answer questions sent in by our audience. If you have a question for this week’s episode, please send it in at the contact form here.

Comments
Log in or sign up to join the conversation.