


Key Market Outlook(s) and Pick(s)
On Tuesday, I joined the great Ash Webster on Fox Business’ Varney & Co. to discuss markets, the economy, outlook, tech, staples, healthcare, Midterms, Pfizer (PFE), and a lot more. Thanks to Stuart Varney, Maggie Edwards, Nick Palazzo, and Ash for having me on:
Video Length: 00:03:28
Alibaba (BABA) Update
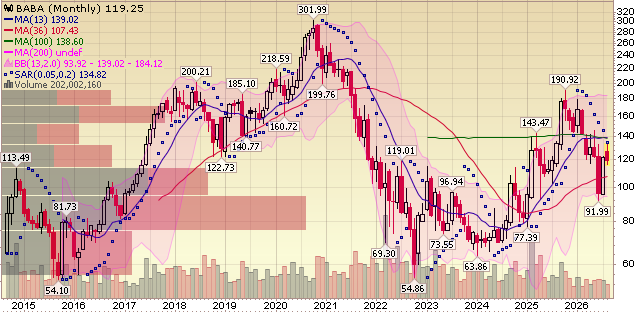
For newer readers, here’s a quick overview of the key drivers behind our thesis on Alibaba, the toll taker of the Chinese consumer recovery and the cheapest way to play AI globally:
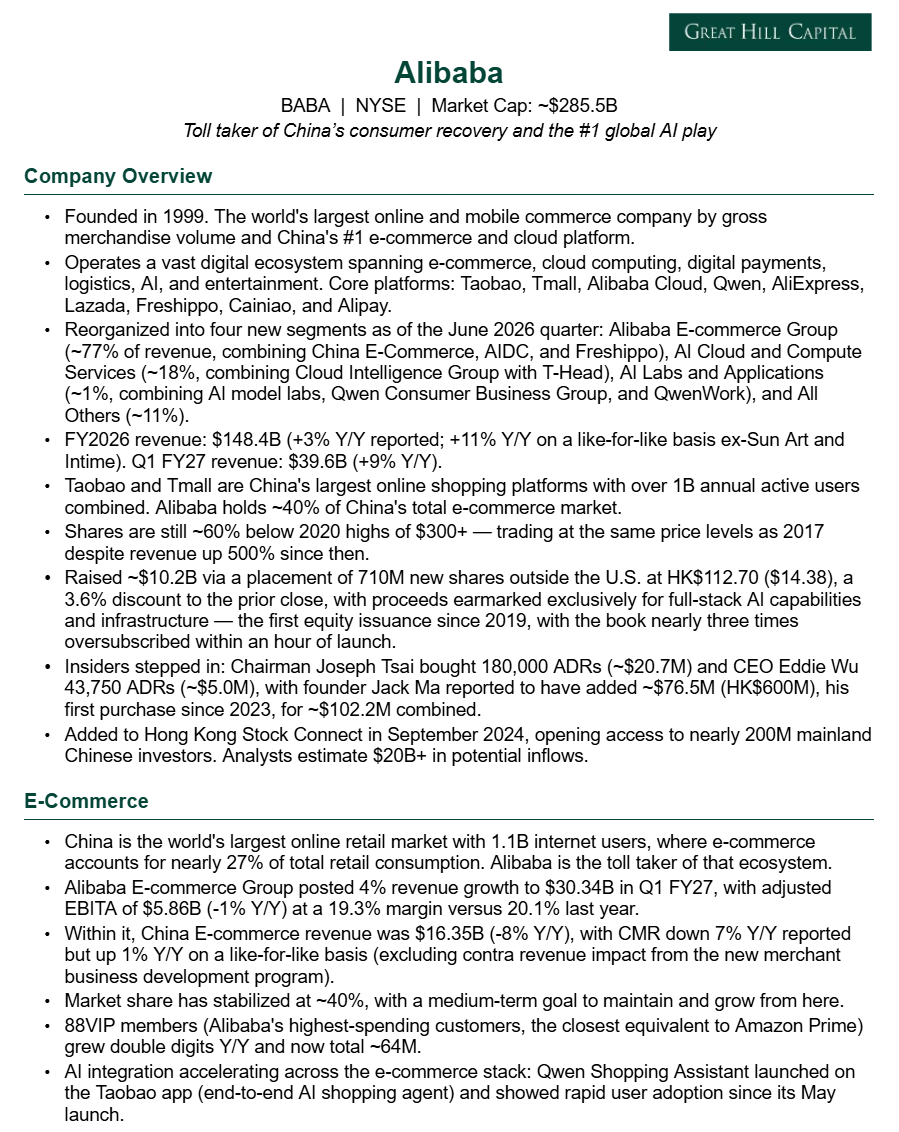
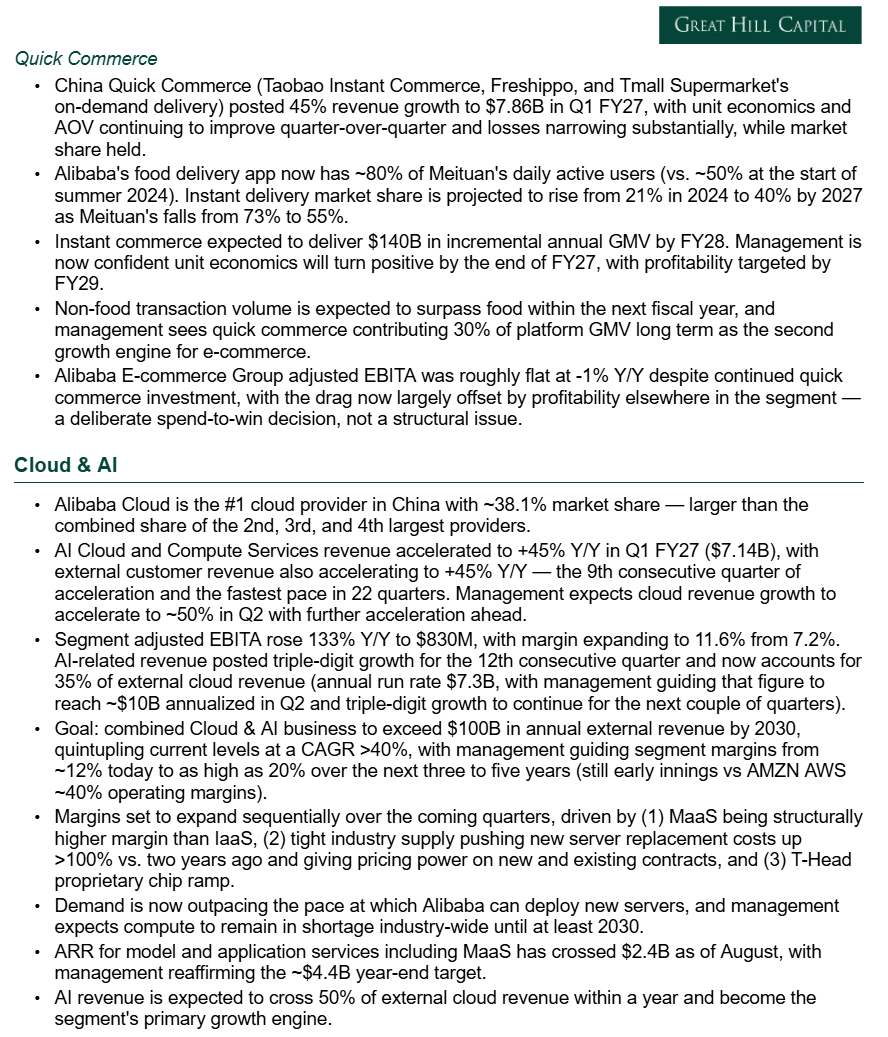
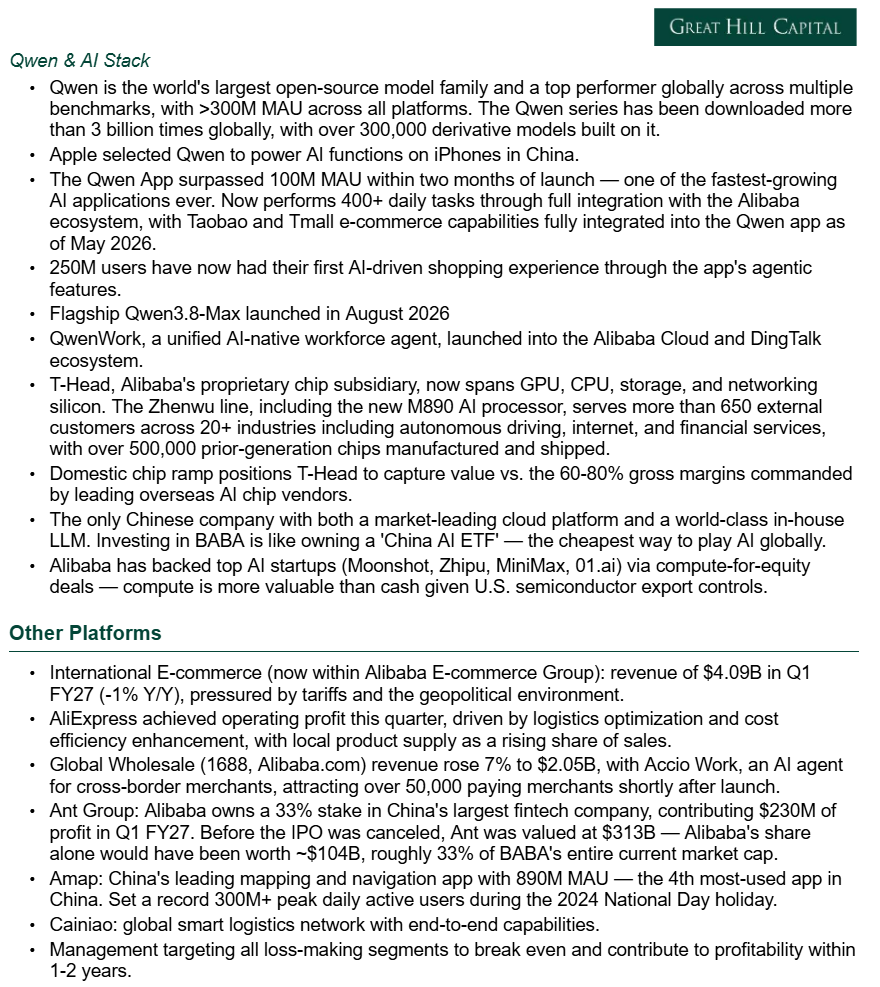
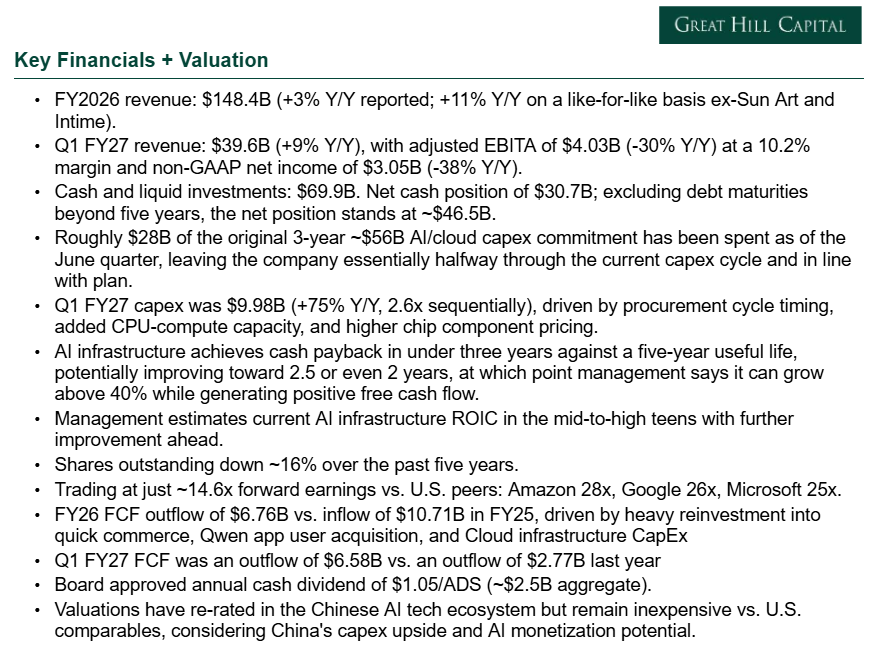
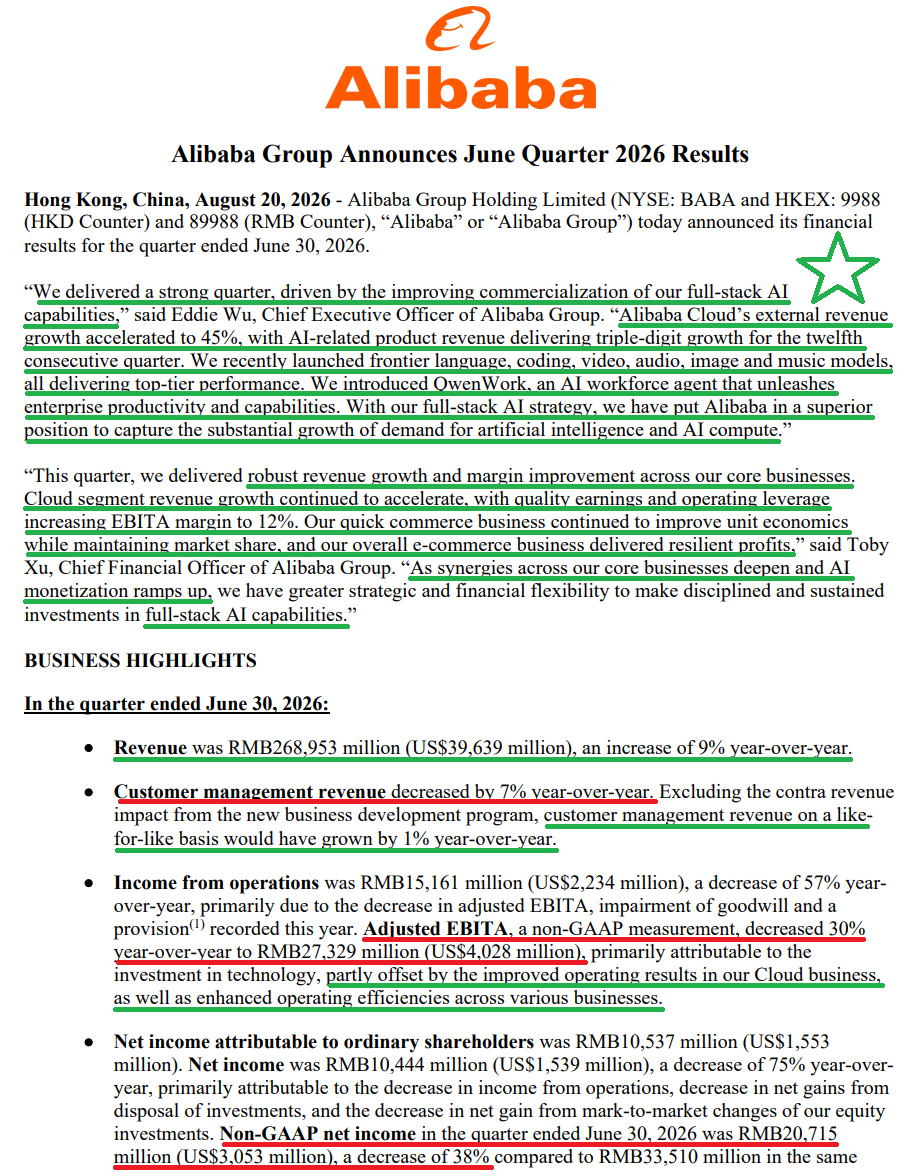
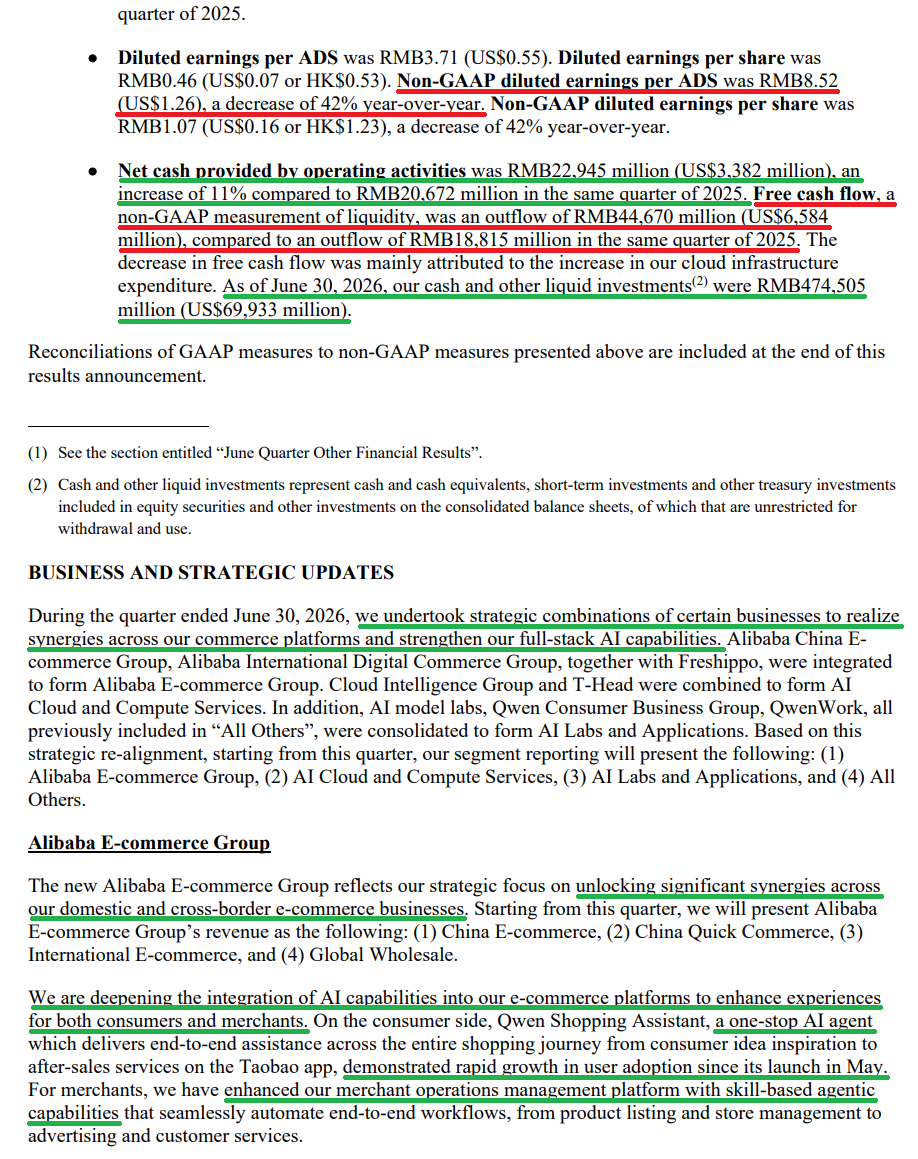
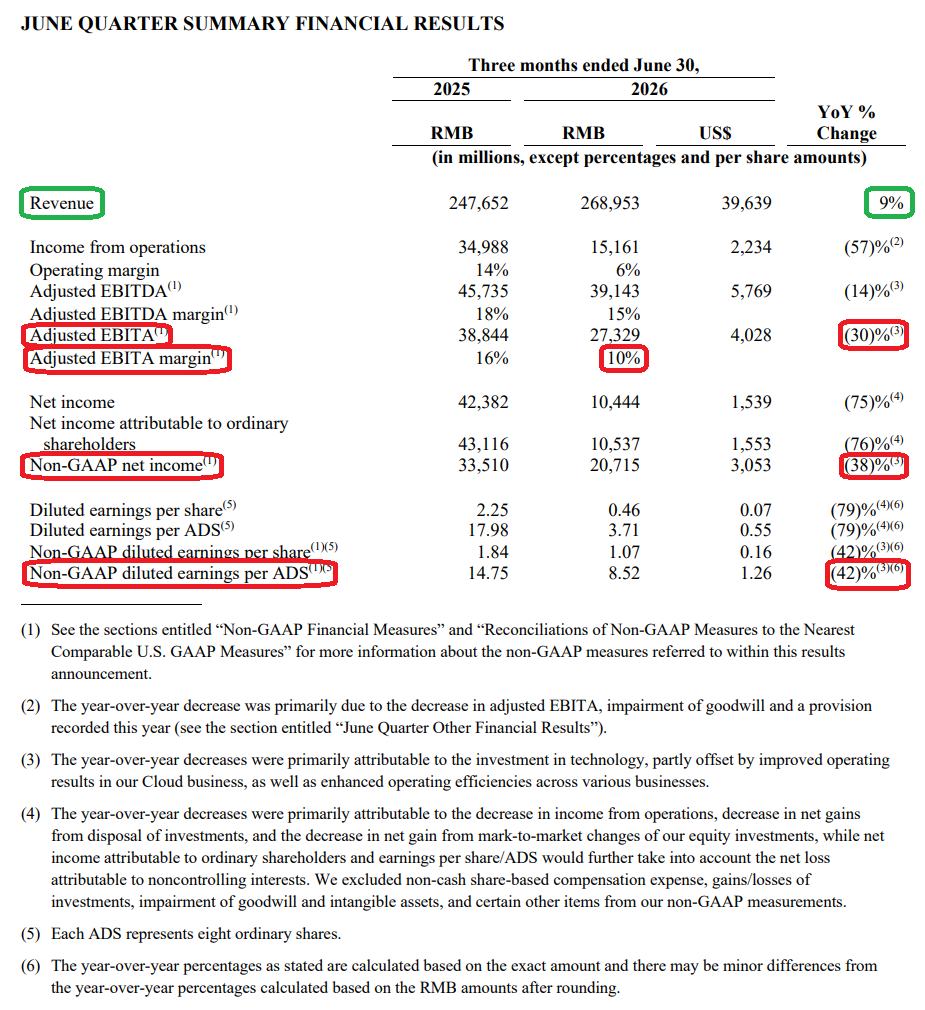
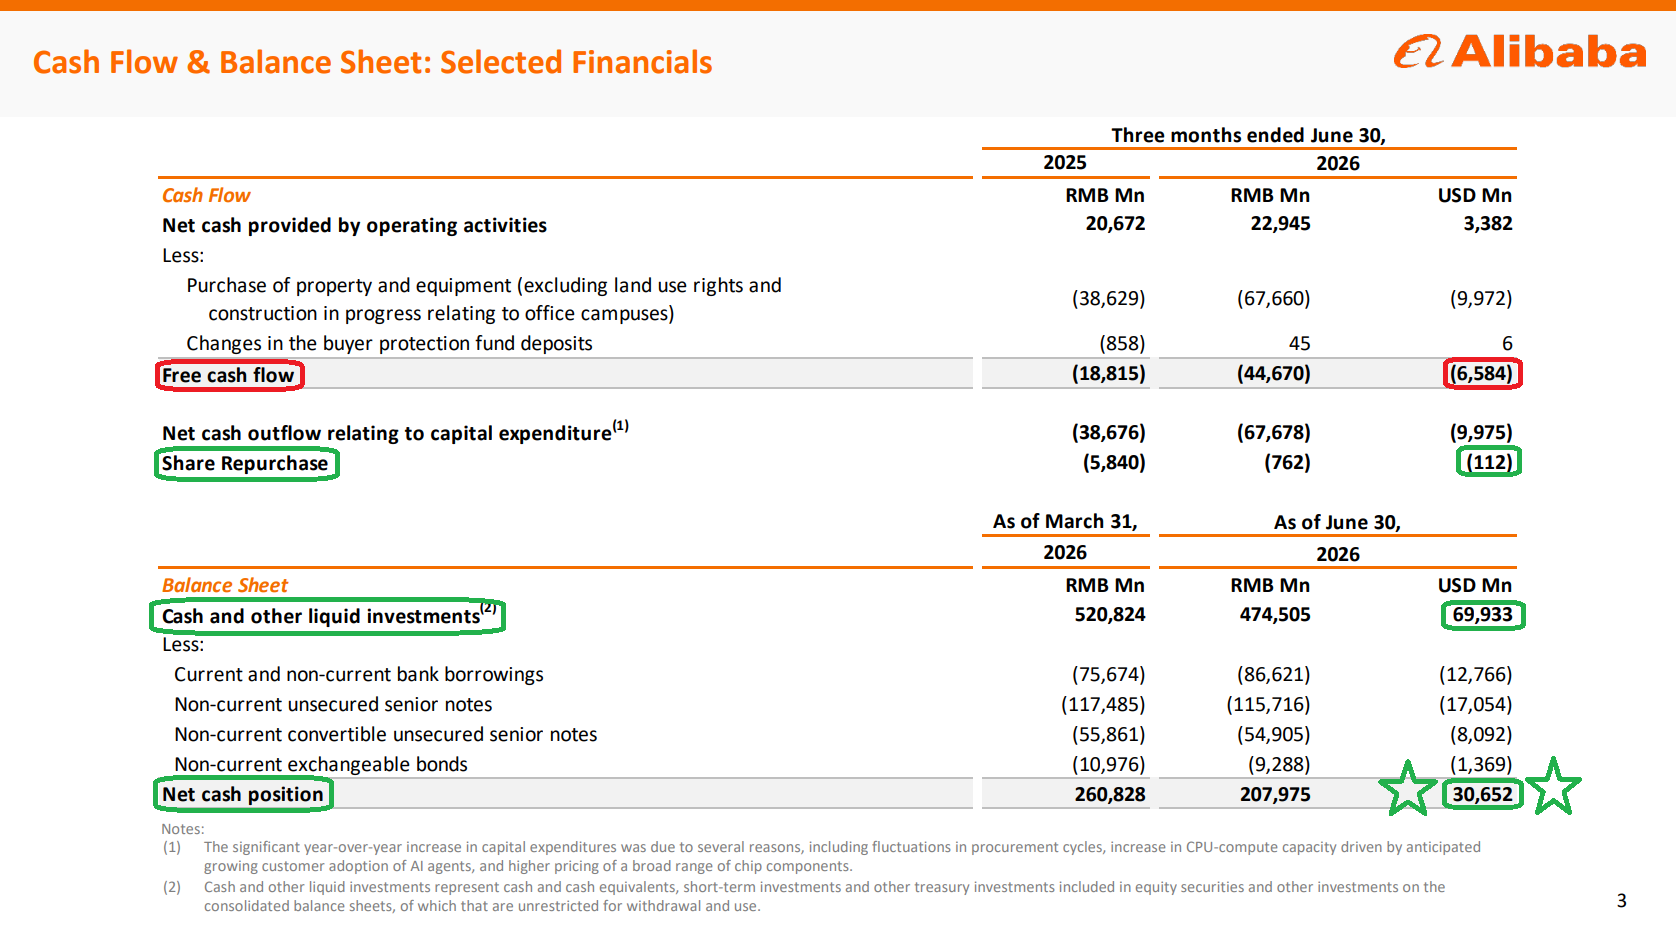
Alibaba reported Q1 results last Thursday, and for anyone who has followed the name for long, the headlines were predictable. Adjusted EBITA fell 30% year over year to $4.03B, with margins compressing to 10.2% from 15.7%. Adjusted EPS fell 42% to $1.26. Free cash flow swung to a $6.6B outflow on $10B of capex, up 75% from last year and 2.6x sequentially. With profits under pressure and lumpy capex timing driving an outflow well above consensus expectations, the financial media had plenty to run with.
While those numbers make for some good headlines, digging into the underlying results, something few investors seem willing to do, tells a very different story.
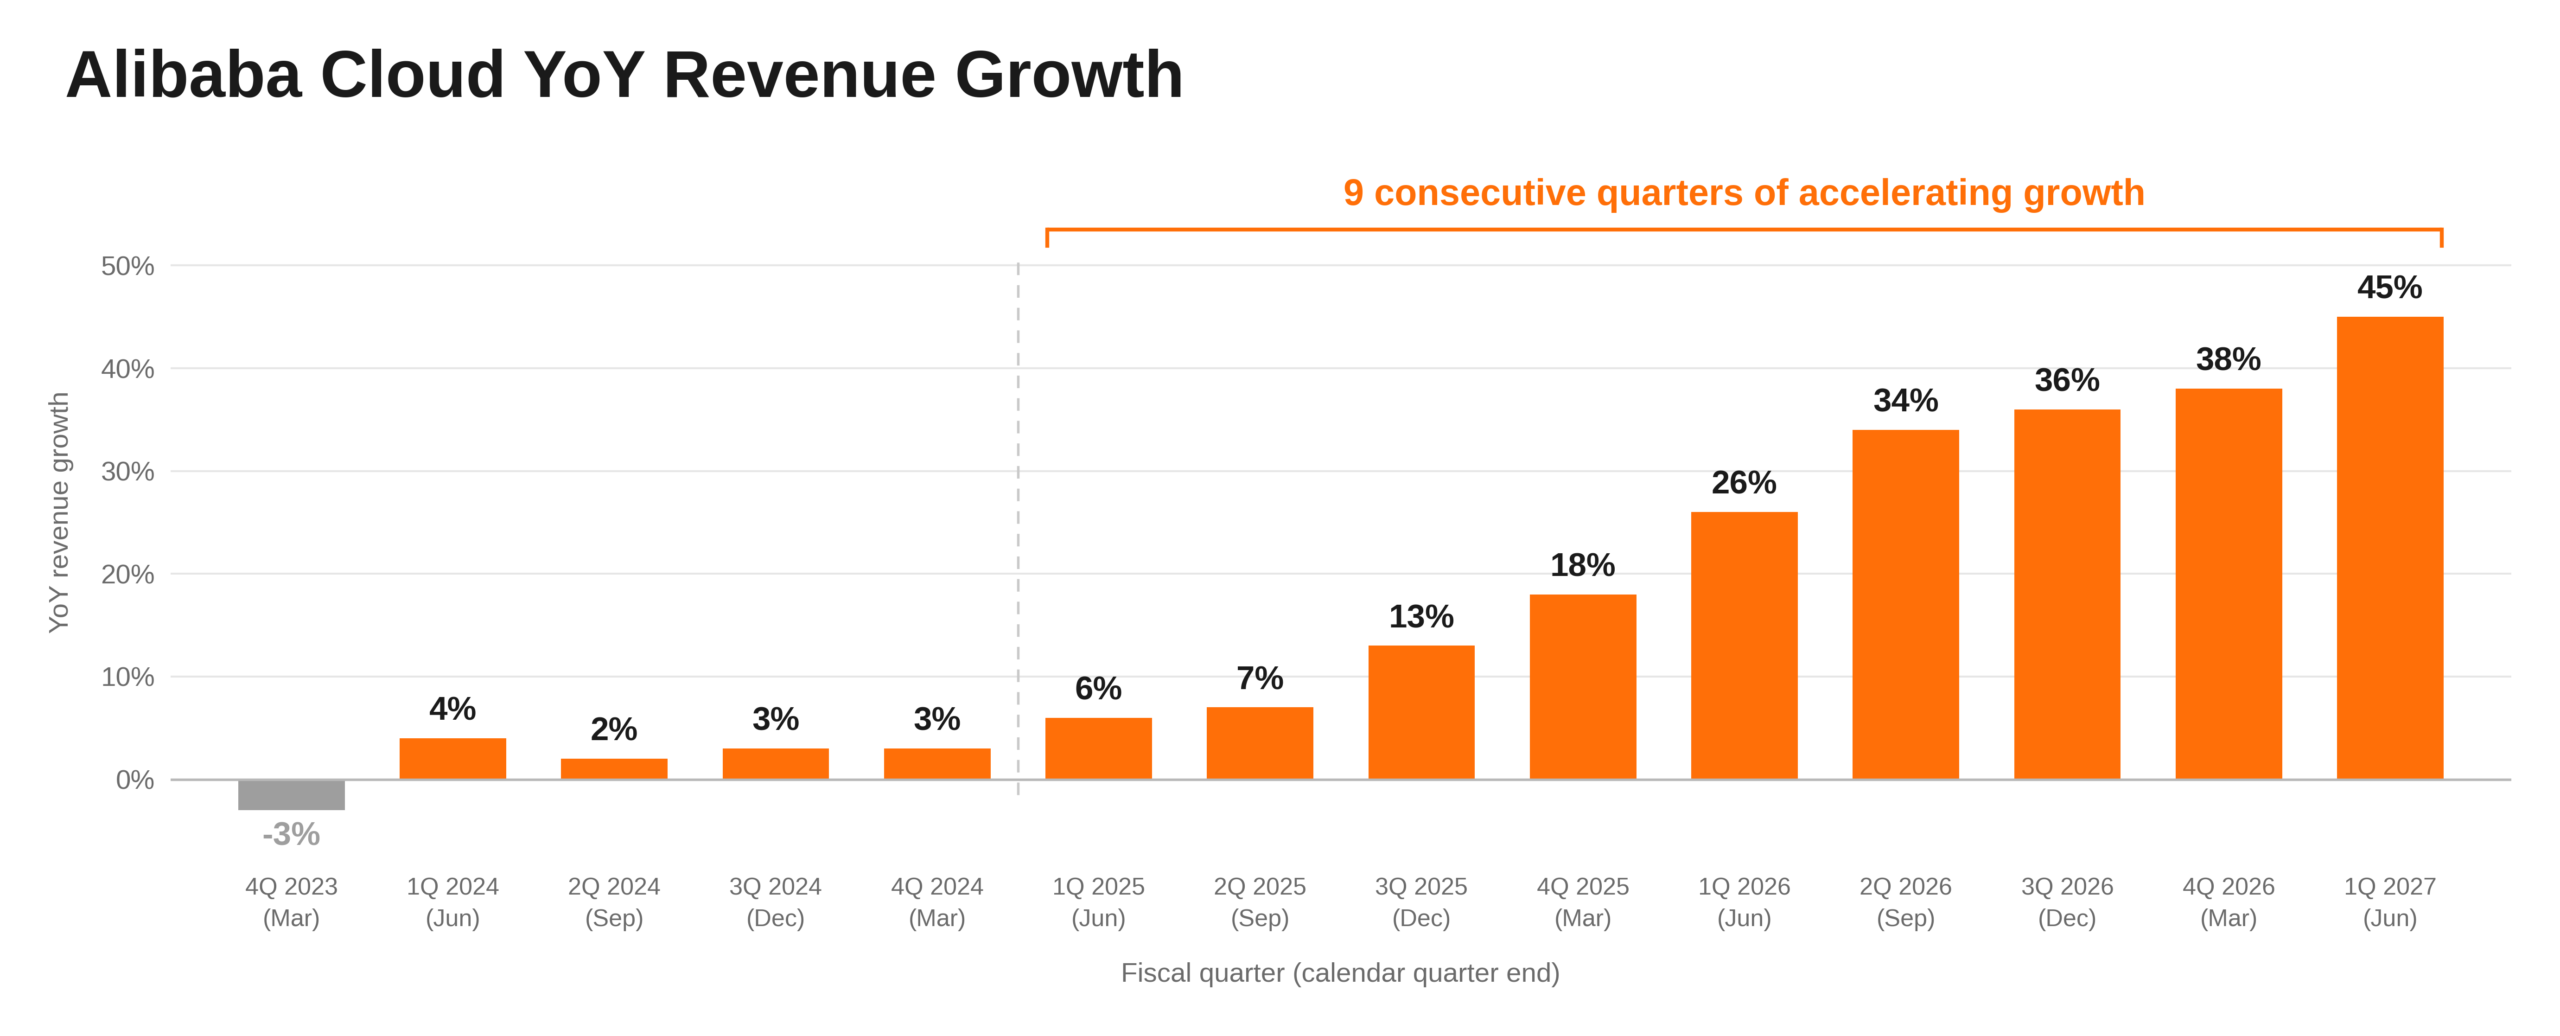
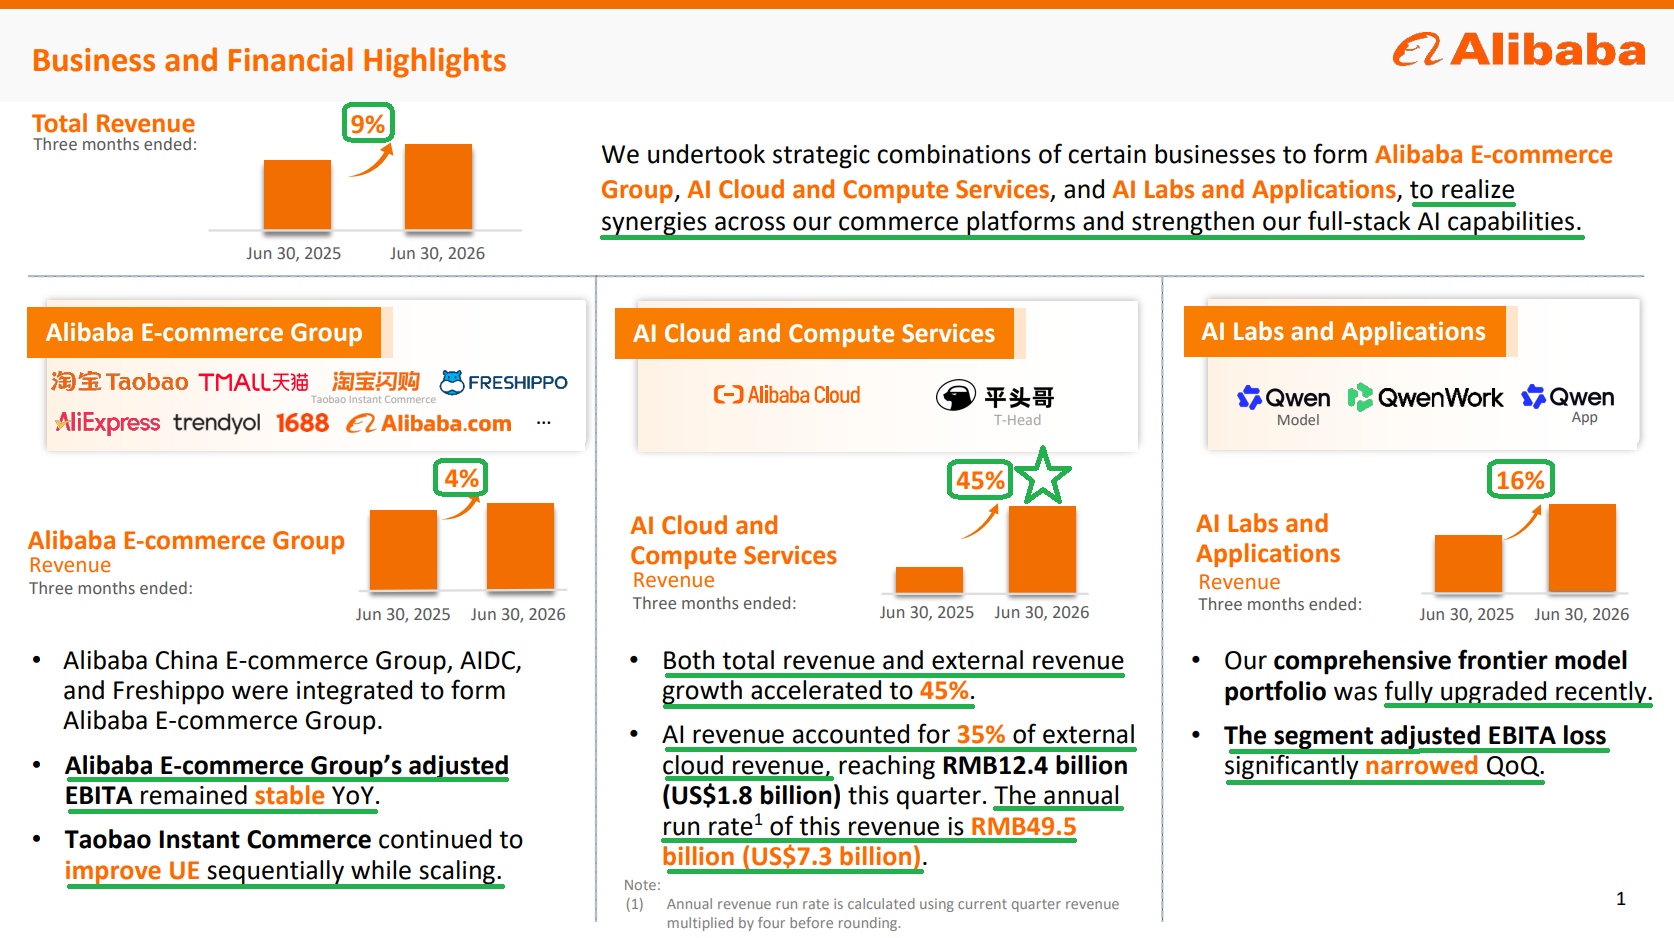
Cloud and Compute revenue accelerated to 45%, the ninth consecutive quarter of acceleration and the fastest pace in 22 quarters. AI-related product revenue reached $1.82B, marking a 12th straight quarter of triple-digit growth that can no longer be dismissed as a small-base phenomenon.
Meanwhile, the e-commerce business grew 4% while holding profits essentially flat at $5.86B, all while absorbing a quick commerce business that has grown from ~18.5% of segment revenue a year ago to nearly 26% today, a testament to narrowing losses and improving unit economics.
None of this progress got much time in the spotlight. The day after earnings, reports of a possible equity raise pushed the quarterly results straight to the back burner and sent the stock down 9%. On Sunday, Alibaba confirmed a $10.2B equity placement of 710 million new shares outside the U.S. at $112.70 per share, its first issuance since 2019.
We have never been fans of shareholder dilution and have been outspoken about it. Every new share reduces the ownership stake of existing holders, and any management team that resorts to equity frequently or indiscriminately deserves scrutiny.
That said, if a company is going to raise equity, Alibaba is doing it about as well as it can be done, with its track record over the past several years earning management the benefit of the doubt.
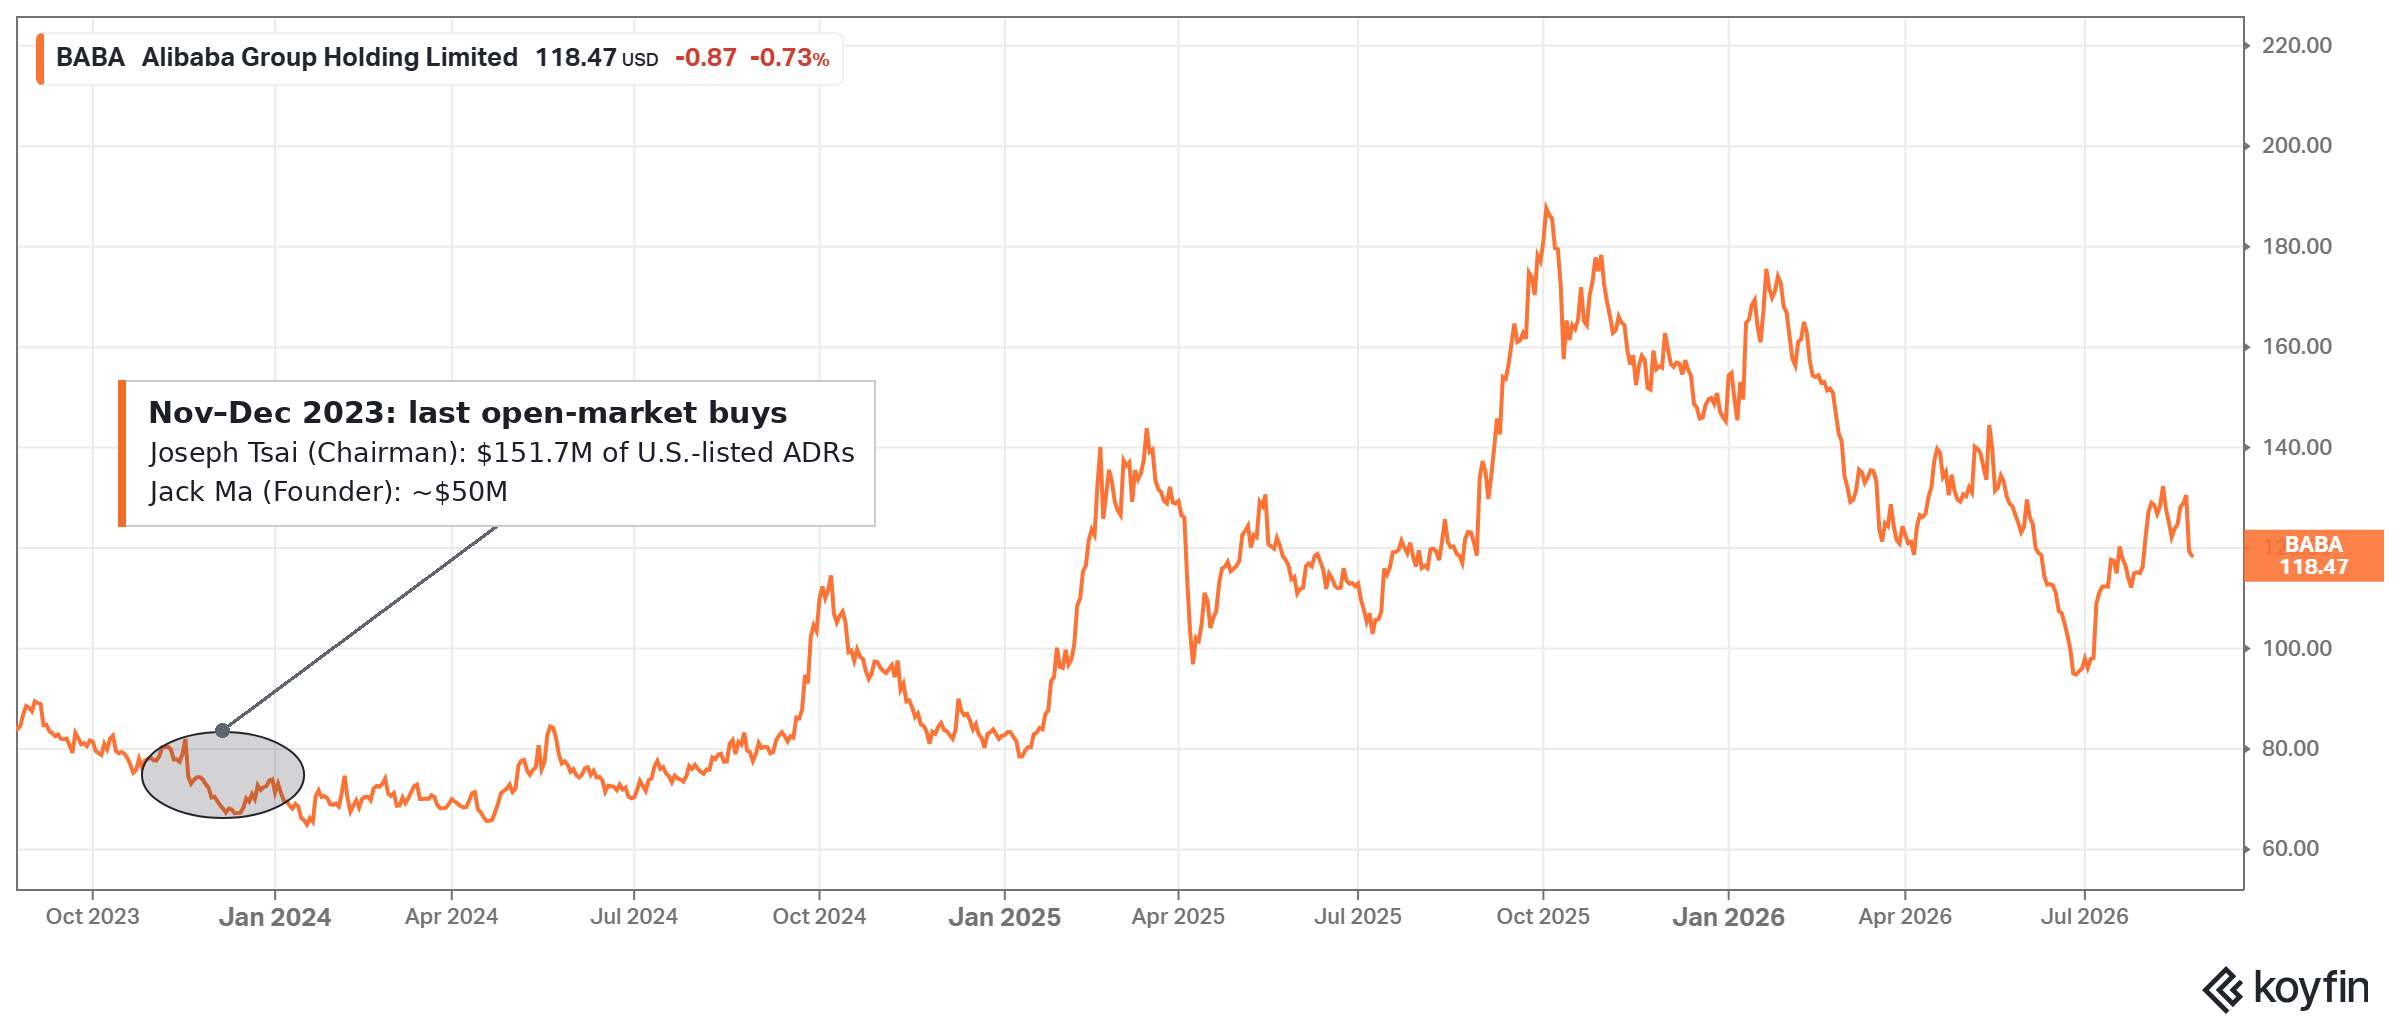
From 2022 through 2025, Alibaba retired $44.9B of stock cumulatively, averaging $11.2B annually. Those buybacks were concentrated with shares trading well below $100 and as low as $59, back when China had been written off as uninvestable and few investors wanted anything to do with the name. We were buying right alongside management until our fingers bled.
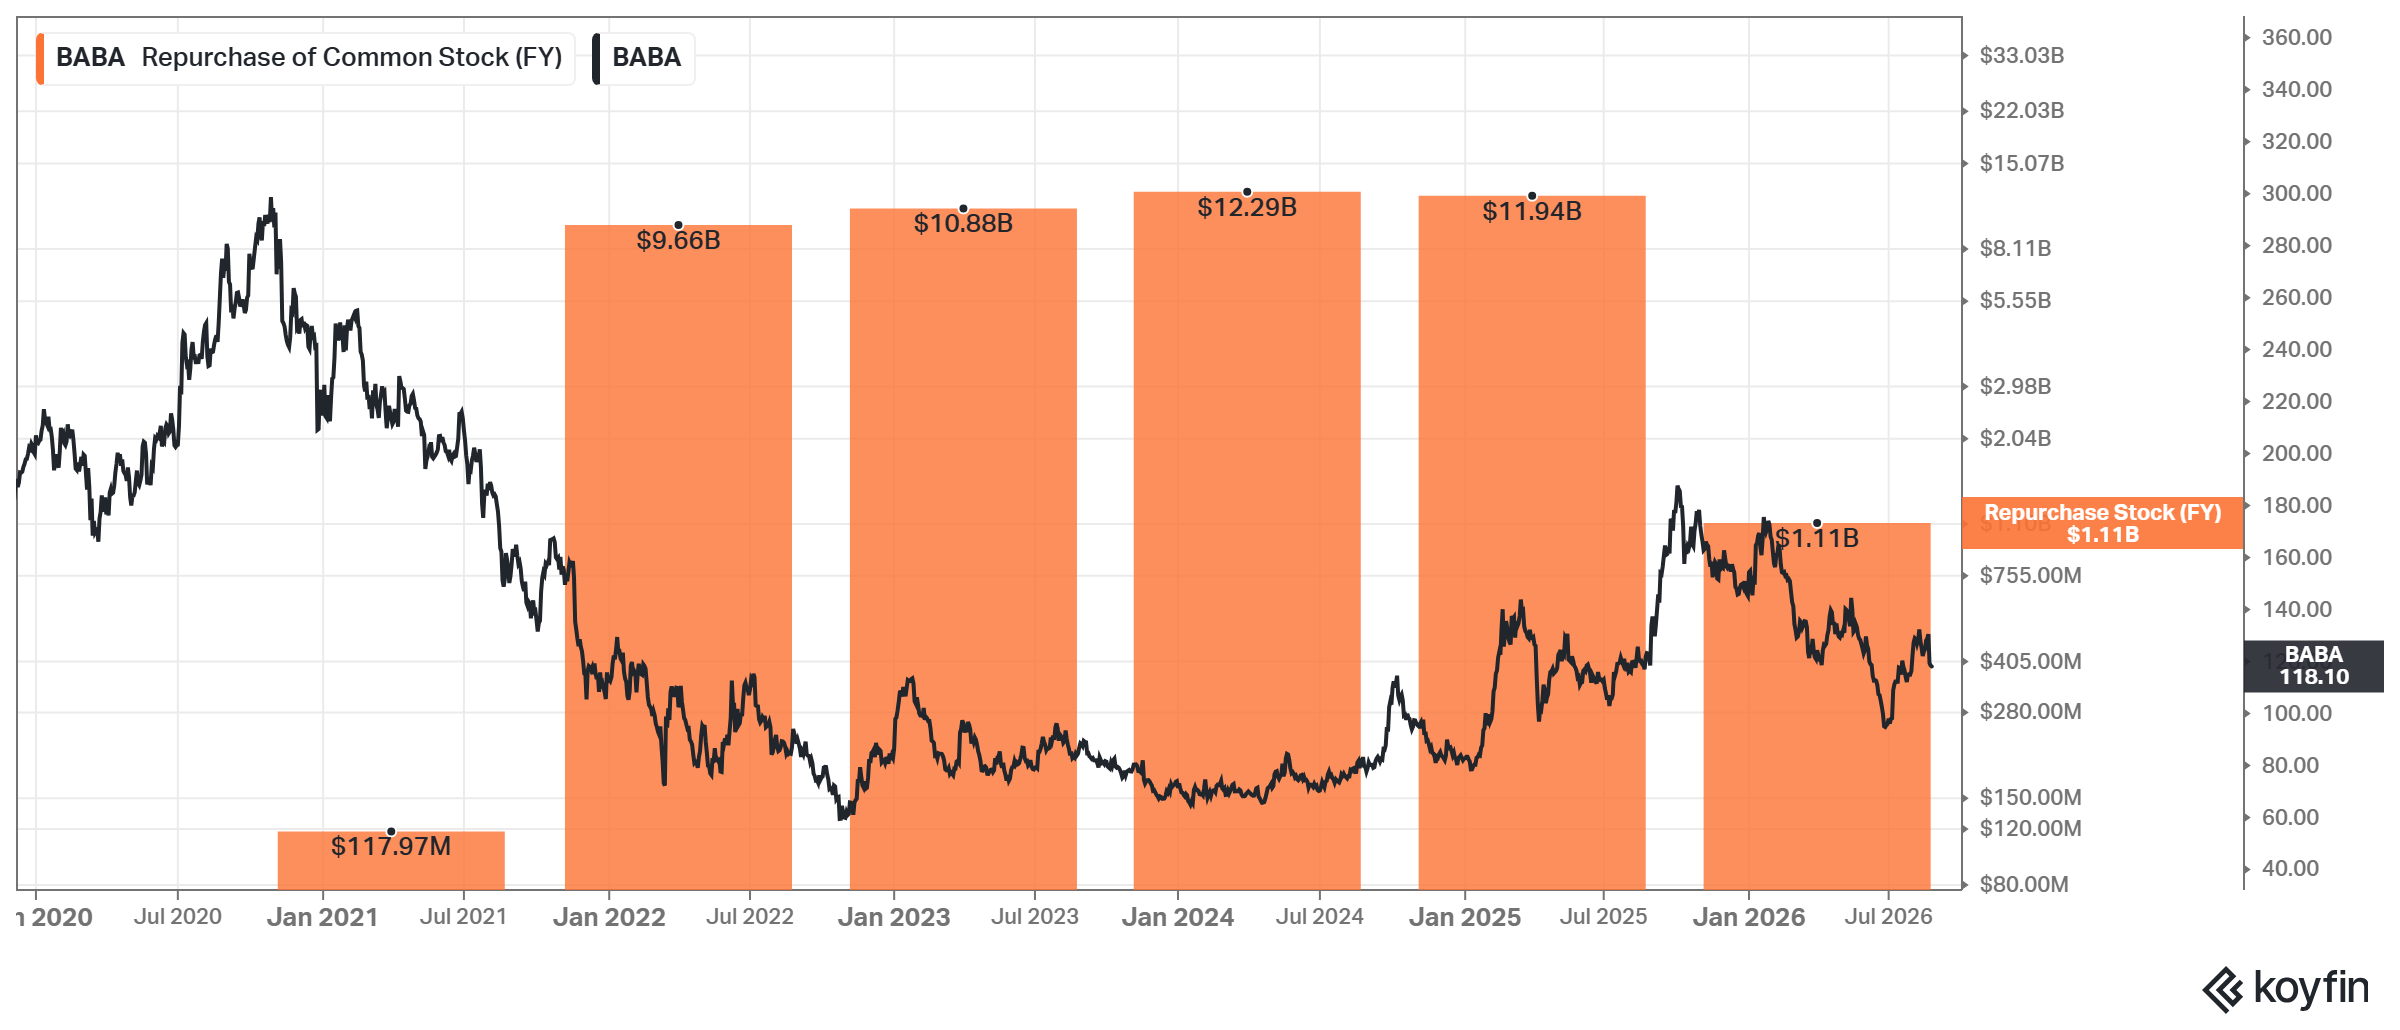
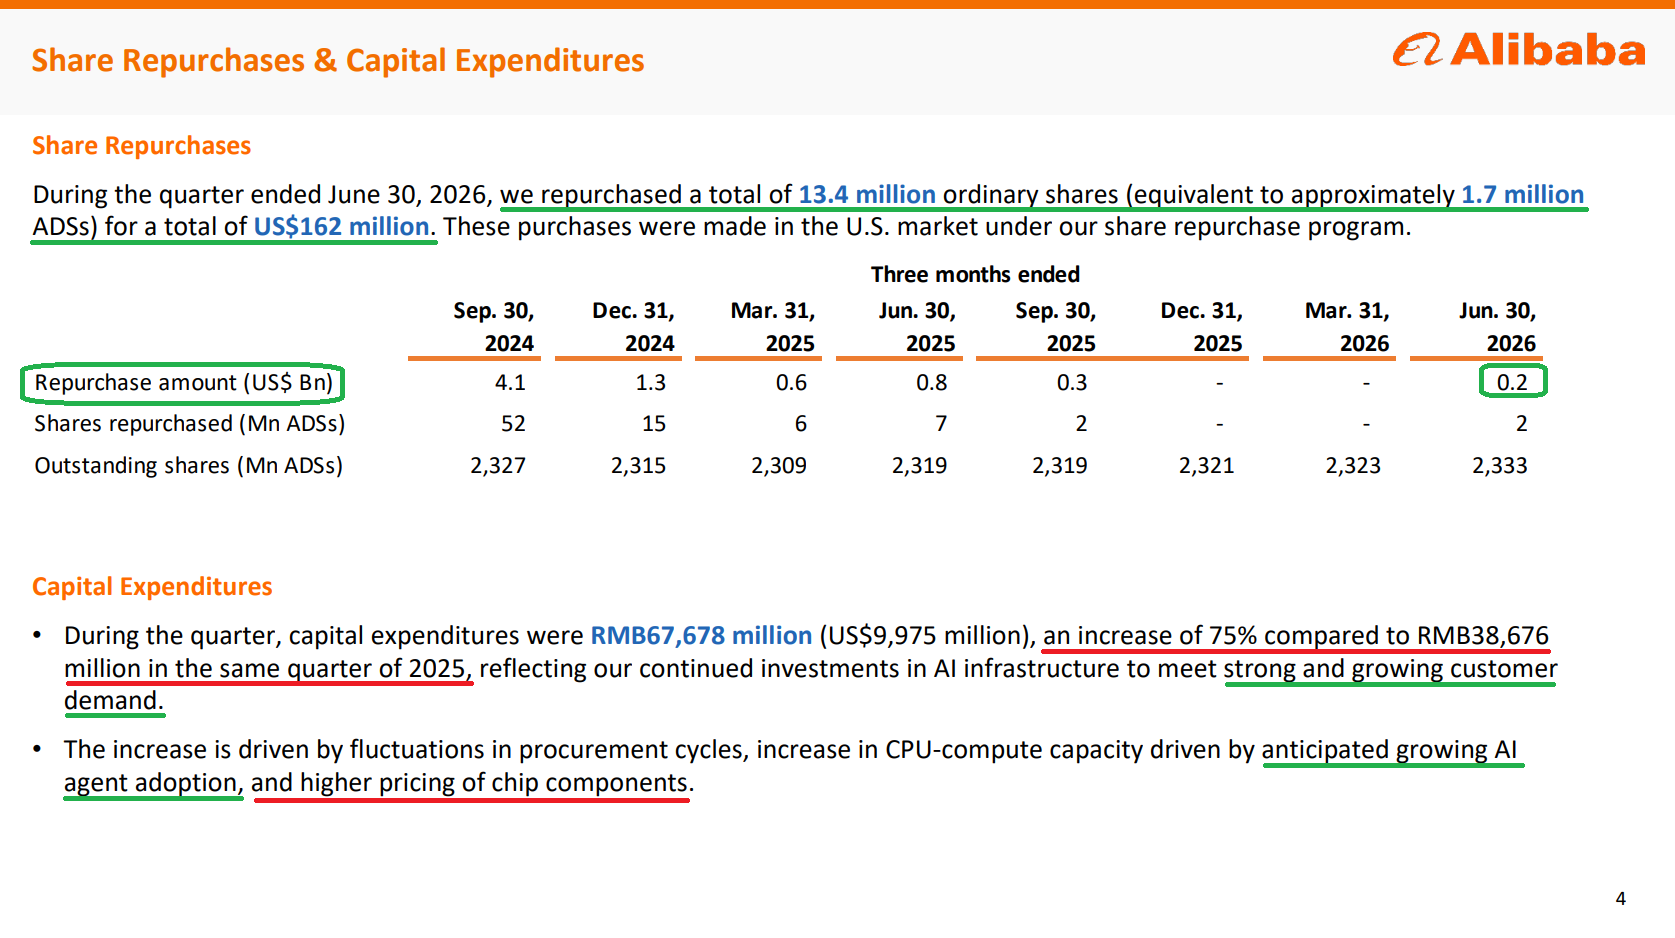
As the stock recovered and more than doubled off those lows, management eased its foot off the buyback pedal, repurchasing zero shares in two of the last three quarters. The $162M spent this quarter came only after the market got silly again and the stock briefly traded back below $100.
In other words, Alibaba bought heavily when the shares were left for dead, stepped back when the price no longer justified it, and is now raising $10.2B of capital after retiring more than 4x that amount at a fraction of today’s price, effectively playing the capital arbitrage game.
That is the exact opposite of the unfortunate but far more common playbook, where buybacks peak near the highs and management goes quiet or reaches for the equity market when the stock is actually cheap, ultimately destroying shareholder value rather than creating it.
If management’s capital allocation track record wasn’t enough, the days following the placement provided another vote of confidence. Chairman Joe Tsai purchased 180,000 ADRs for ~$20.7M, CEO Eddie Wu bought 43,750 ADRs for ~$5.0M, and founder Jack Ma was separately reported to have added ~$76.5M to his already large ~4% stake. Combined, that represents more than $100M of personal capital committed alongside the issuance.
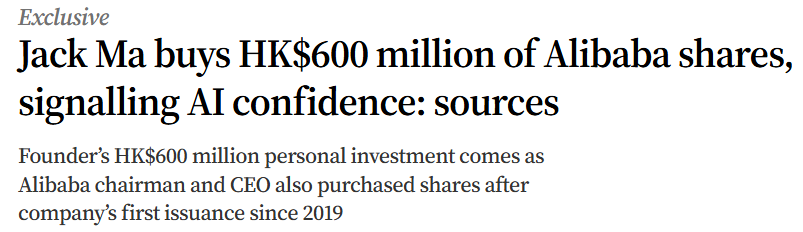
This was also Ma’s first open-market purchase since Q4 2023, when he invested ~$50M alongside Tsai’s ~$151.7M as the stock traded below $80, which proved to be a timely investment.
When the management team, which knows more about the business than anyone else, issues stock and then personally buys that same stock in the open market days later, it tells you everything you need to know about the returns they expect to generate on that capital.
Which brings us to what that capital is actually funding.
Alibaba has now spent ~$28B of its ~$56B three-year Cloud & AI capex commitment, putting it essentially halfway through the plan. For a company that has historically been relatively capex-light, averaging just under $6B of annual capex from 2020-2024, that sounds like an enormous number. Until you put it next to what the U.S. hyperscalers are committing in capex this year alone.
Amazon (AMZN) just raised its 2026 capex guidance to $220B from $200B. Google (GOOGL) now expects to spend $195B to $205B, up from $180B to $190B. Microsoft (MSFT) is running at ~$175B on a lease-adjusted basis, or ~$190B unadjusted, while Meta (META) expects to spend $137.5B.
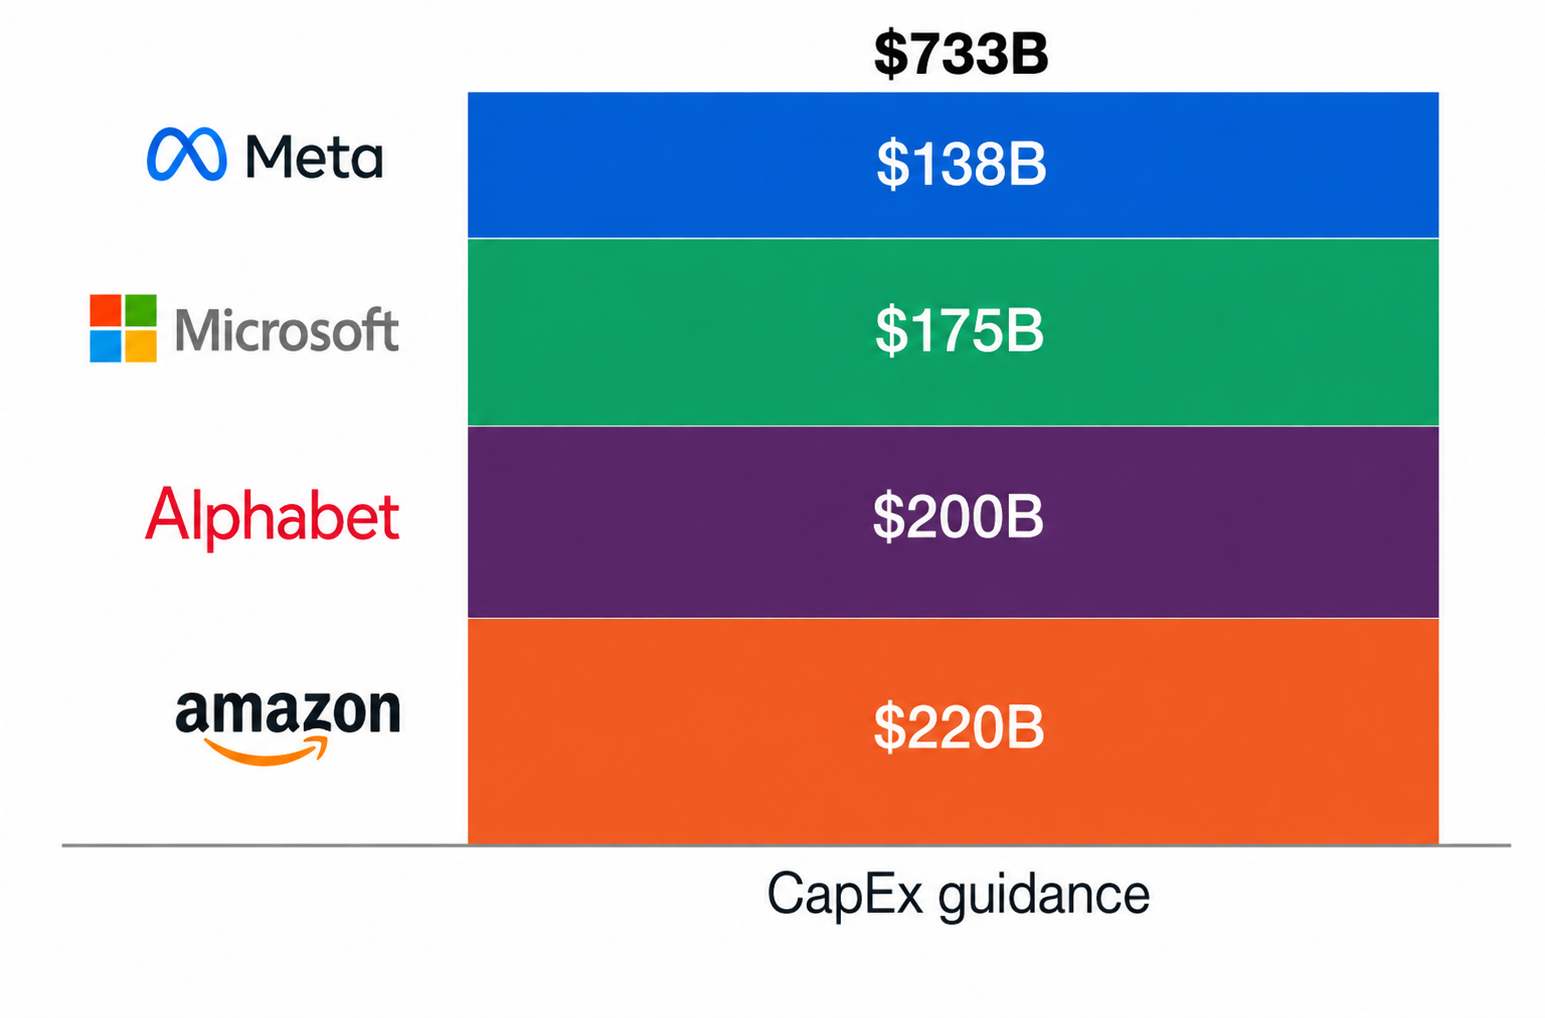
In fact, Alibaba’s entire three-year commitment is roughly on par with what Amazon spent on capex in Q2 alone.
However, there is a second distinction that, in our view, matters far more than the sheer difference in spending. Ask the U.S. hyperscalers what returns they are earning on this infrastructure and you get plenty of qualitative answers: demand exceeds supply, and the opportunity is generational. What they rarely provide are the actual economics: a specific return on invested capital or a payback period.
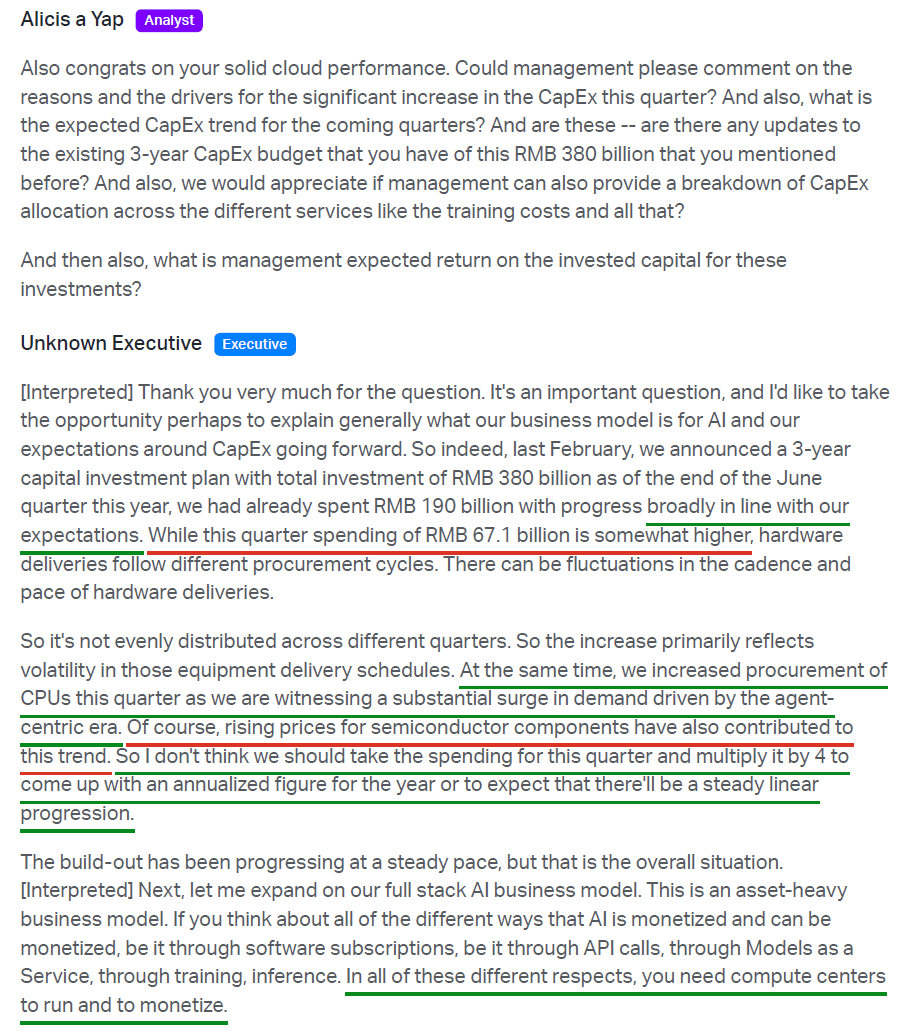
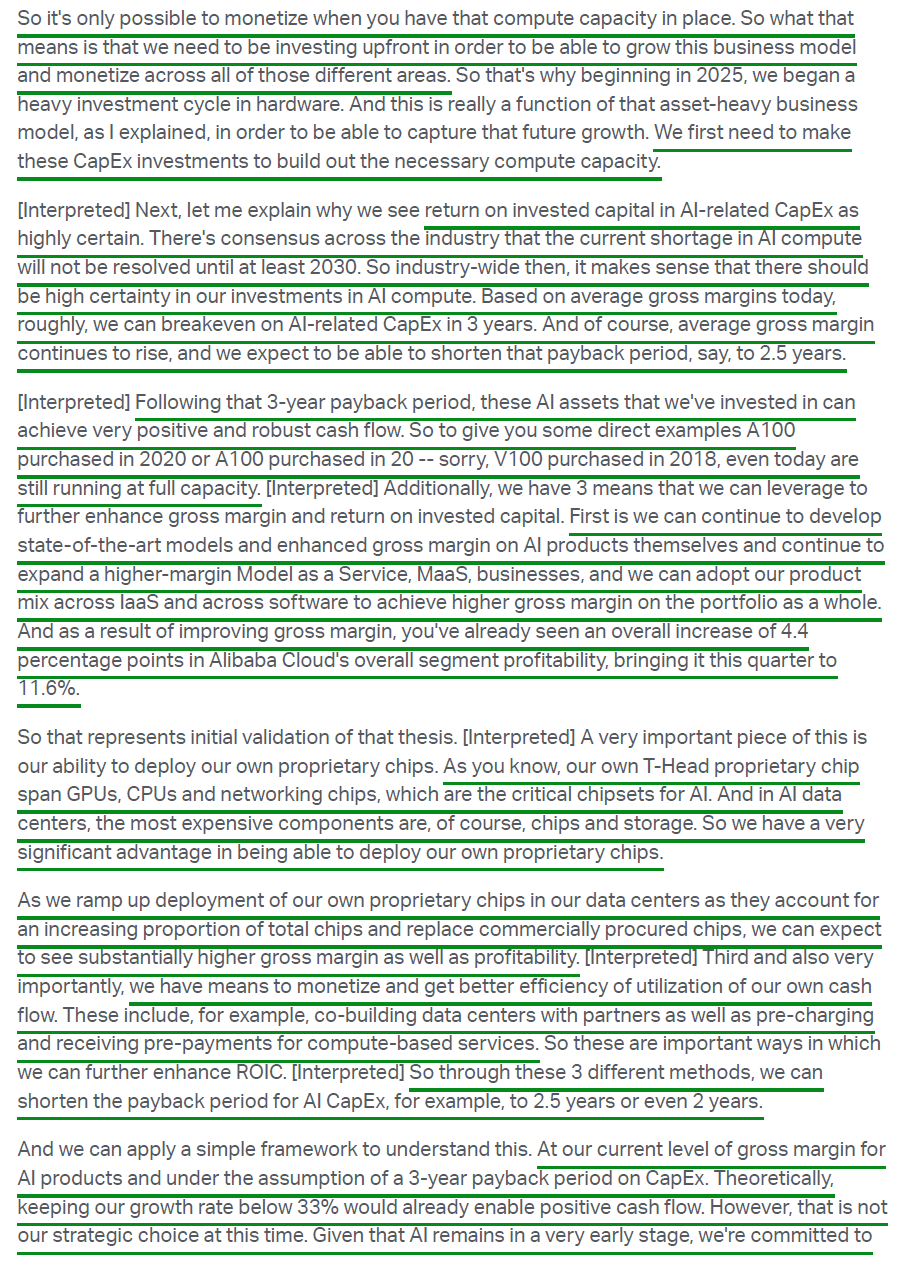
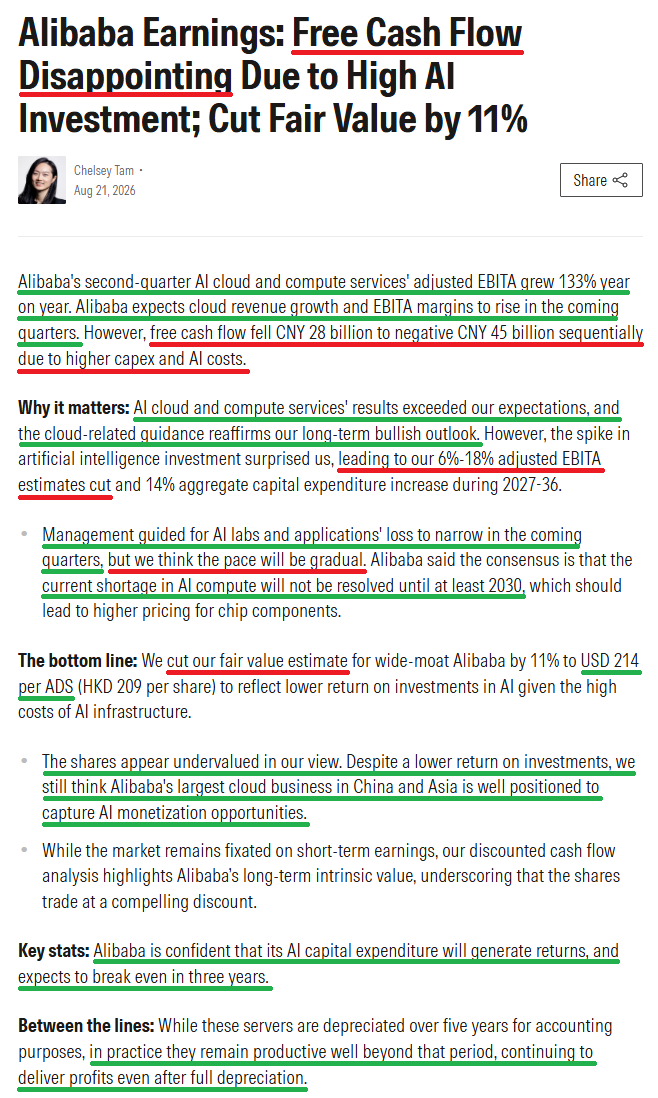
Alibaba put concrete numbers around the economics on the call. Management estimates current ROIC on AI infrastructure in the mid-to-high teens, with further improvement expected in the years ahead. Cash payback on servers equipped with AI chips is under three years today, falling toward 2.5 years or even as low as two years as gross margins rise and Alibaba increasingly uses its own chips. With a five-year useful life, that means at least two years of positive free cash flow after breakeven. In practice, these assets remain productive well beyond their accounting life, with management pointing to GPUs purchased in 2018 that are still running at full capacity.
The reason Alibaba can be that specific, rather than simply pointing to a “generational opportunity,” is the position it has spent years building across the AI stack.
Alibaba is the only true full-stack AI player in China, with a platform spanning cloud infrastructure at 38.1% market share, the world’s largest open-source model family in Qwen, and advanced proprietary silicon through T-Head. Rather than betting on which layer of the AI stack ultimately captures the value, Alibaba has invested to participate in all of them. More importantly, each layer feeds demand into the others.
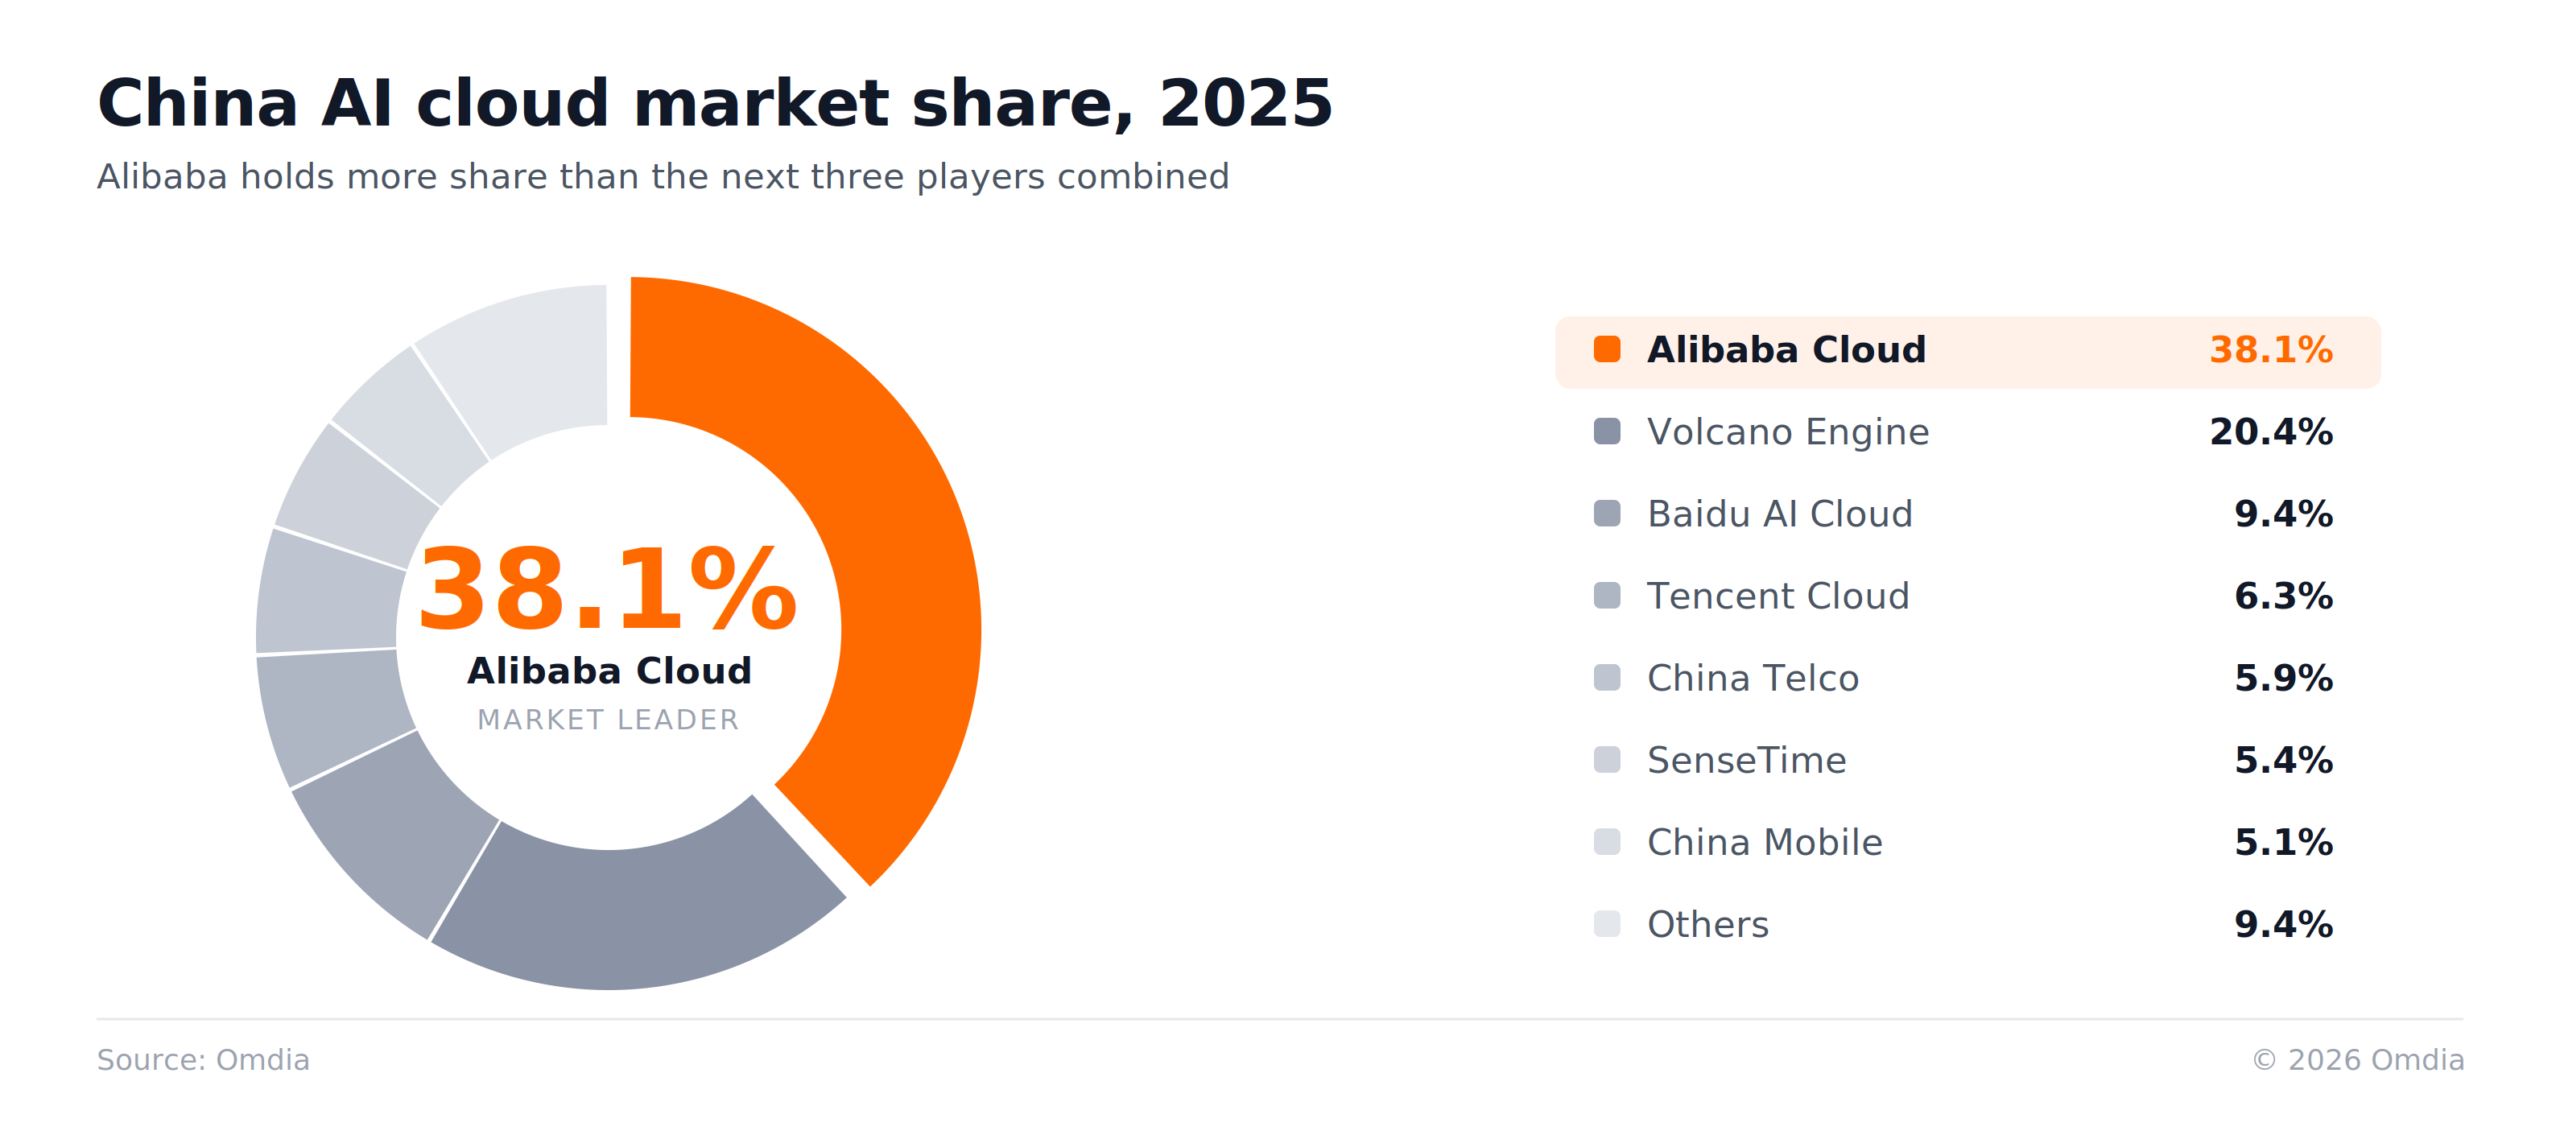
That flywheel is already visible in today’s results. Compute demand is running far ahead of what Alibaba can deploy, driving cloud revenue growth to 45% this quarter, with management guiding to growth above 50% next quarter and further acceleration ahead. AI-related products are driving that growth, rising to 35% of external cloud revenue and expected to cross 50% within a year.
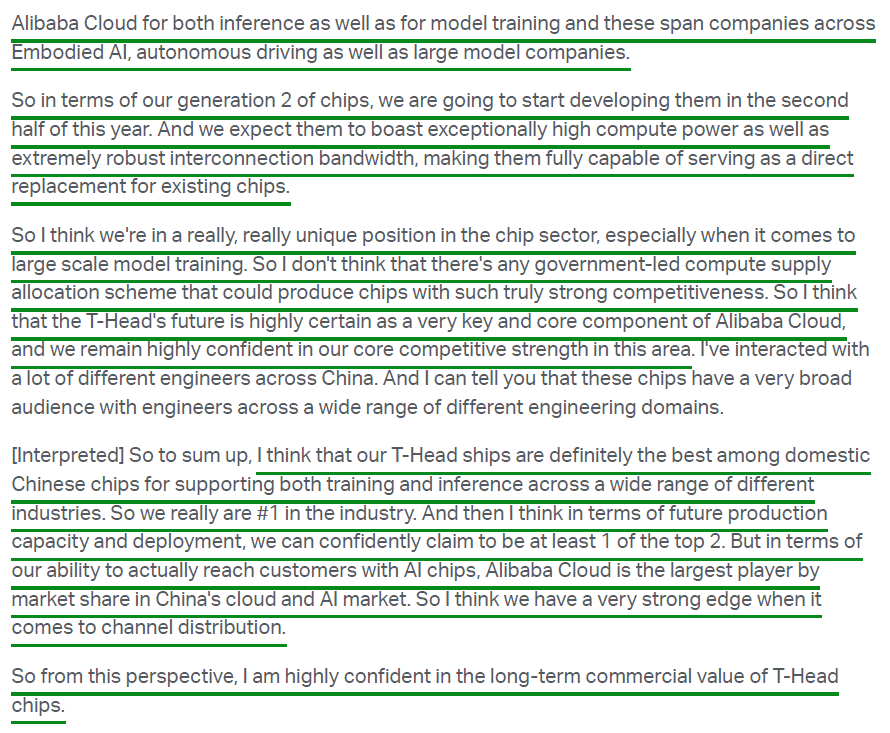
Alibaba is then meeting that demand with its own silicon. T-Head’s Zhenwu line now spans GPU, CPU, storage and networking chips, serving more than 650 external customers with over 500,000 units already shipped. Every proprietary chip deployed is one that no longer has to be purchased from an overseas vendor commanding 60%-80% gross margins.
That internal chip substitution, alongside the significantly higher margins of AI-related products, is a primary driver behind cloud segment adjusted EBITA rising 133% to $830M this quarter, with margins expanding to 11.6% from 7.2% a year ago. Management is targeting 20% margins over the next three to five years, which still looks like early innings compared with peer AWS at ~39% operating margins.
Sitting on top of the hardware are the models, which pull demand back through the entire stack. The Qwen series has now been downloaded more than 3 billion times globally in the past six months, more than double China’s population, while ranking among the world’s top performers across multiple benchmarks. Every model download, every agent deployed and every token consumed drives incremental demand for compute, which runs on Alibaba’s infrastructure and is powered by Alibaba’s chips.
That flywheel underpins Alibaba’s long-term target of $100B in annual external cloud revenue, a near quintupling of FY26 levels, against a total company market capitalization of just $285B today.
And keep in mind, we’ve gotten this far without discussing the core business that funds all of it.
Alibaba E-commerce Group generated $30.34B of revenue, up 4% Y/Y, and $5.86B of adjusted EBITA, roughly flat year over year. Holding profits stable is impressive on its own against China’s weak consumption backdrop, but considerably more so given how much larger quick commerce has become within the mix.
Quick commerce grew 45% during the quarter to $7.86B, with losses continuing to narrow and unit economics improving on higher average order values and greater fulfillment efficiency, while market share held throughout. Most importantly, management still expects quick commerce to deliver $140B of incremental annual GMV by FY28, with unit economics turning positive by the end of FY27 and profitability expected in FY29.
Which brings us to what we think the market continues to underestimate.
Alibaba is running two simultaneous major buildouts: one in cloud and AI infrastructure and another in quick commerce. Together, they have temporarily depressed near-term profits, driving the negative headlines each quarter and contributing to the 56.9% decline in EPS in FY26.
What those headlines fail to capture is what the business looks like on the other side, once the cloud and AI infrastructure has been built and monetized and quick commerce reaches scale and profitability.
The earnings trajectory already points to that inflection. Consensus calls for 71.99% earnings growth in FY27, 39.92% in FY28 and 27.91% in FY29, taking EPS to just under $12.
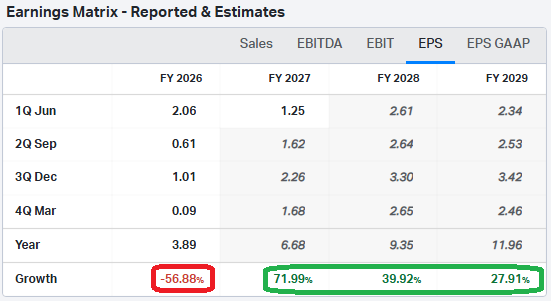
That kind of growth is difficult to find anywhere in the world, let alone at just over 14x earnings, which is why we continue to view Alibaba as the cheapest way to play AI globally and are more than happy to look through the near-term earnings noise.
Q1 Earnings Breakdown
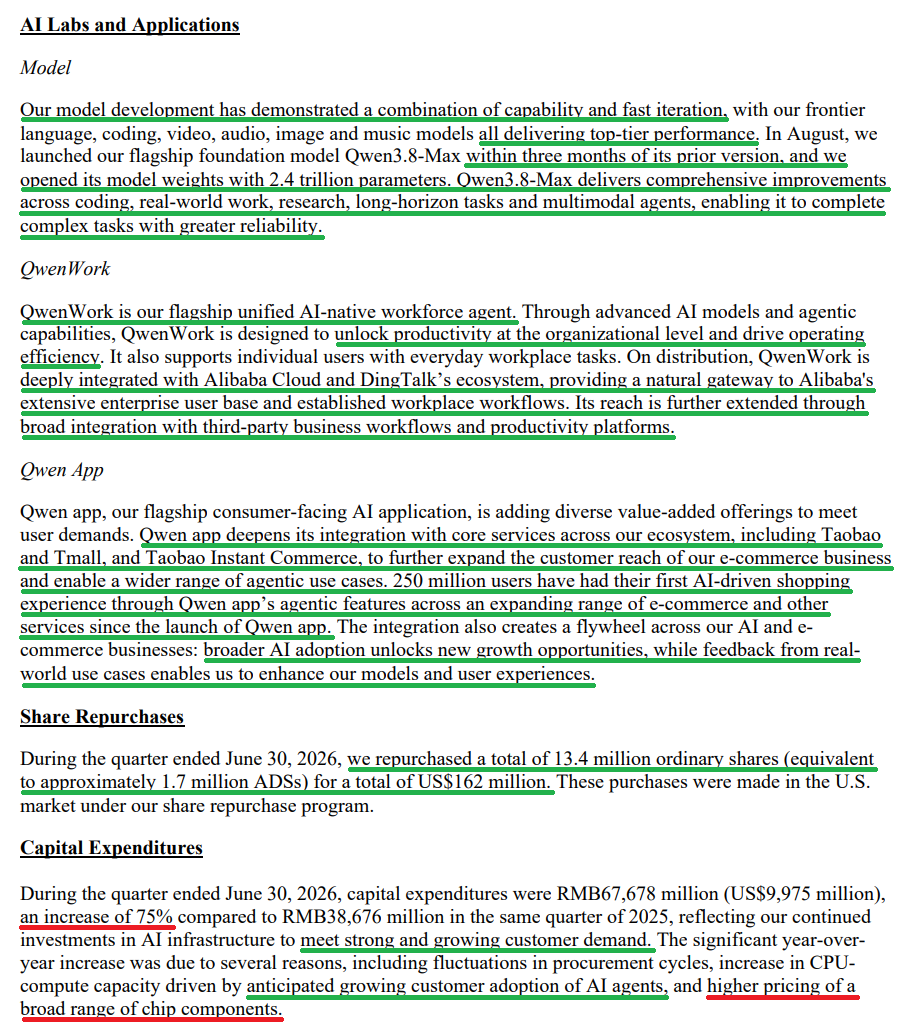
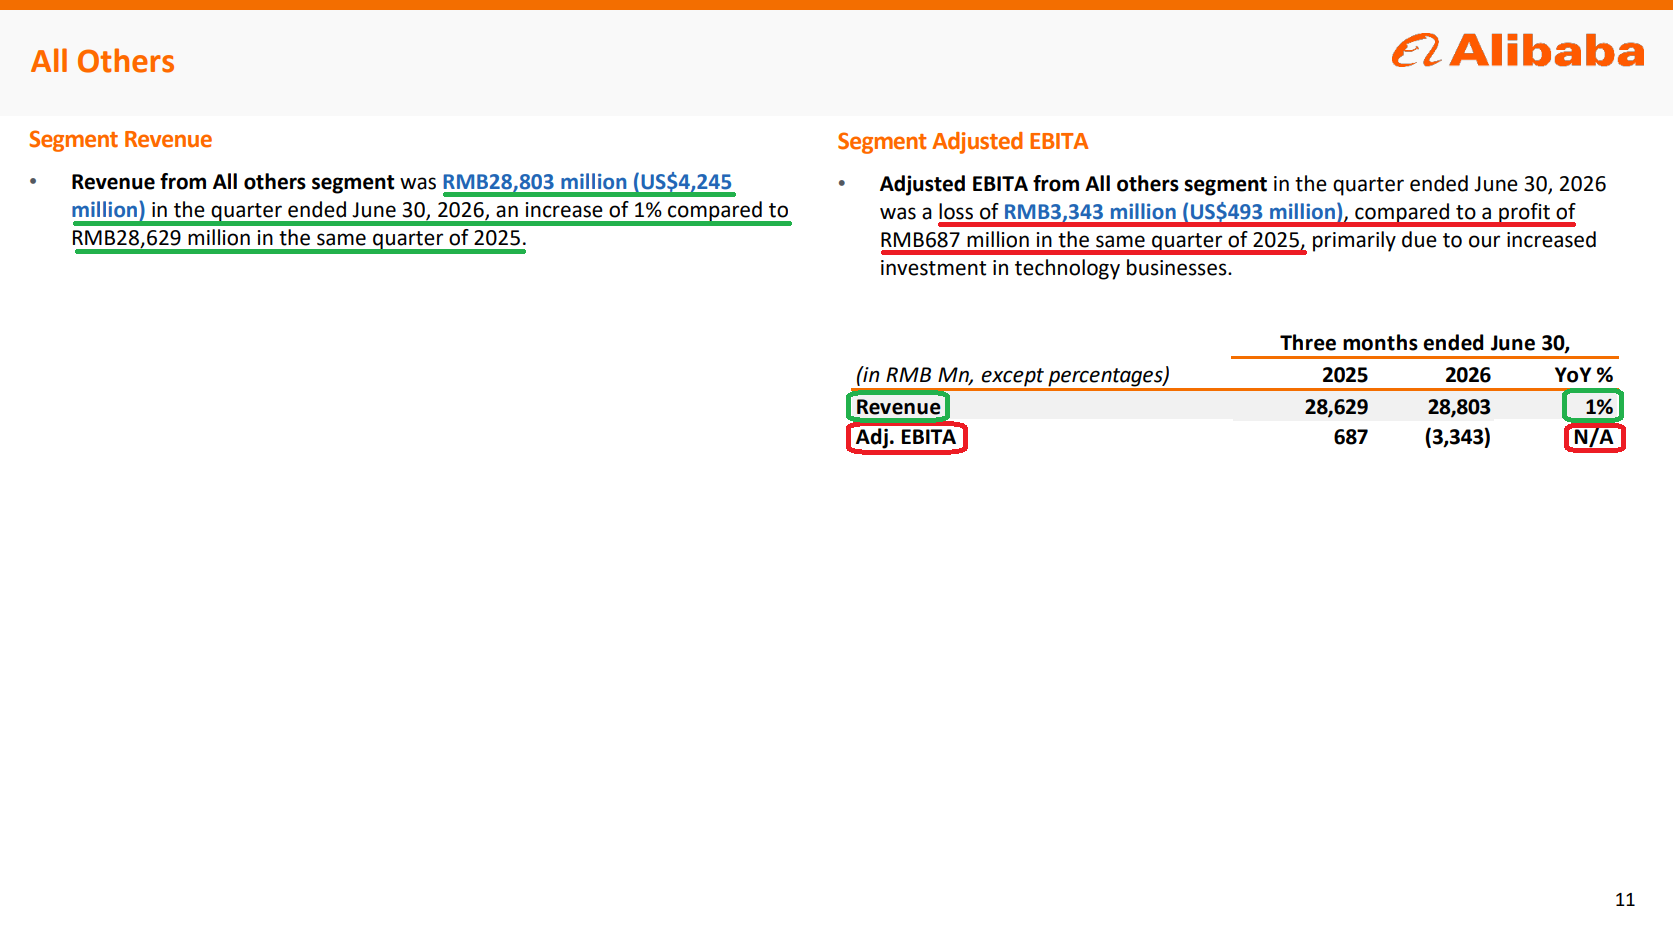
10 Key Points
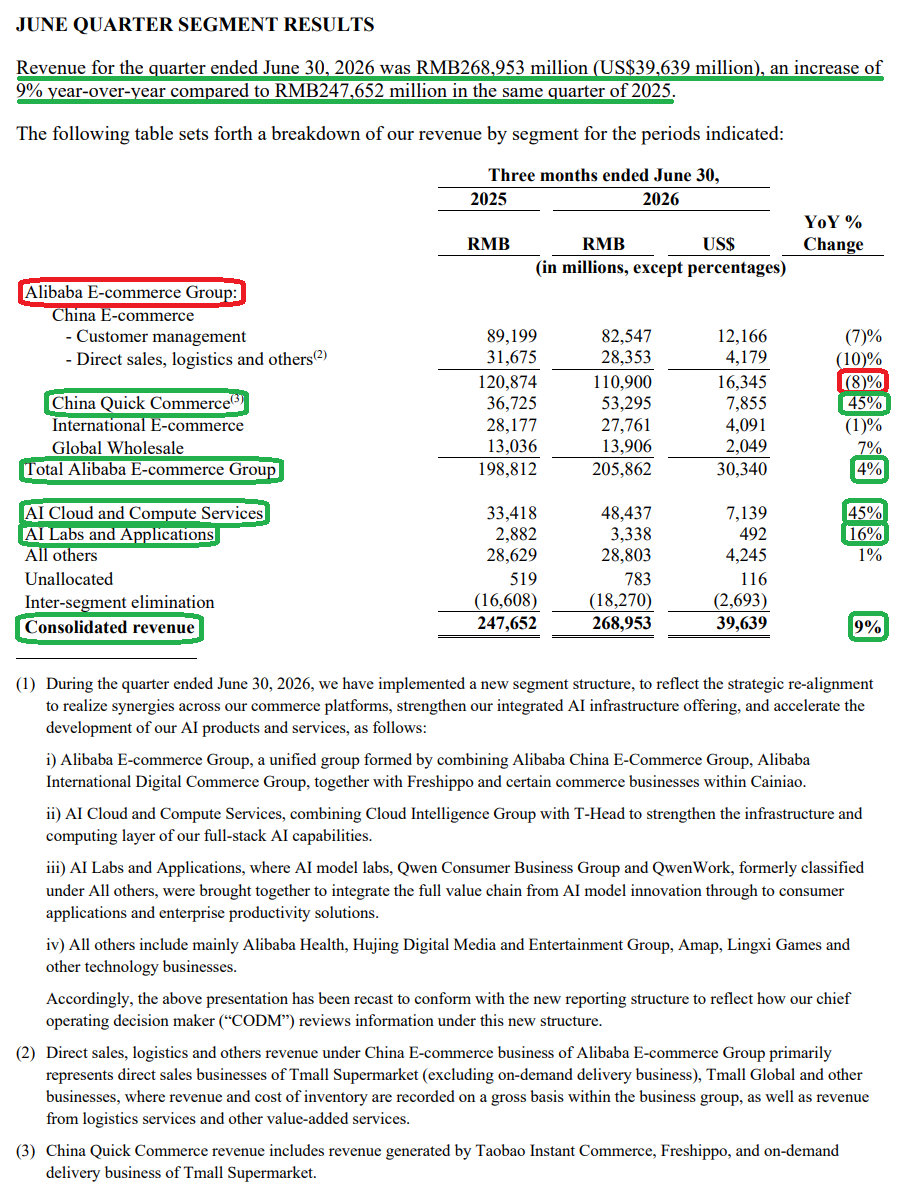
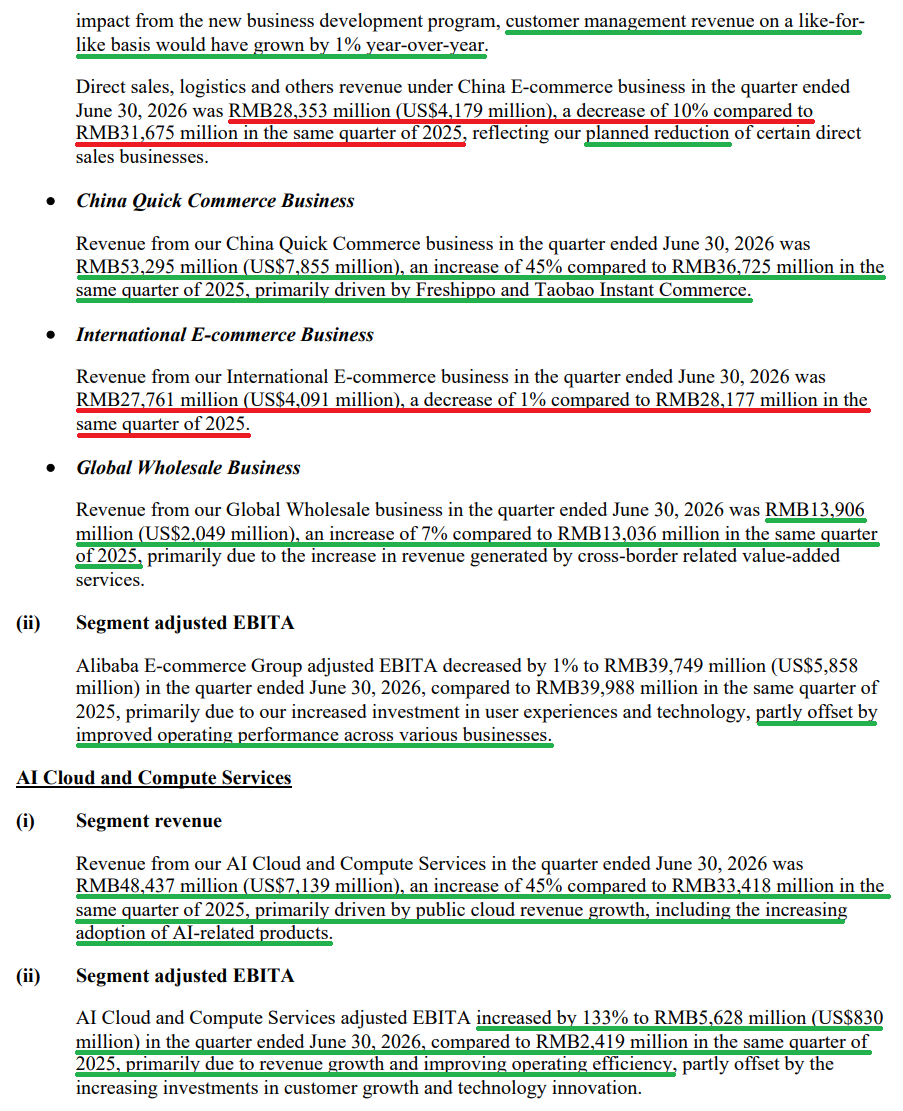
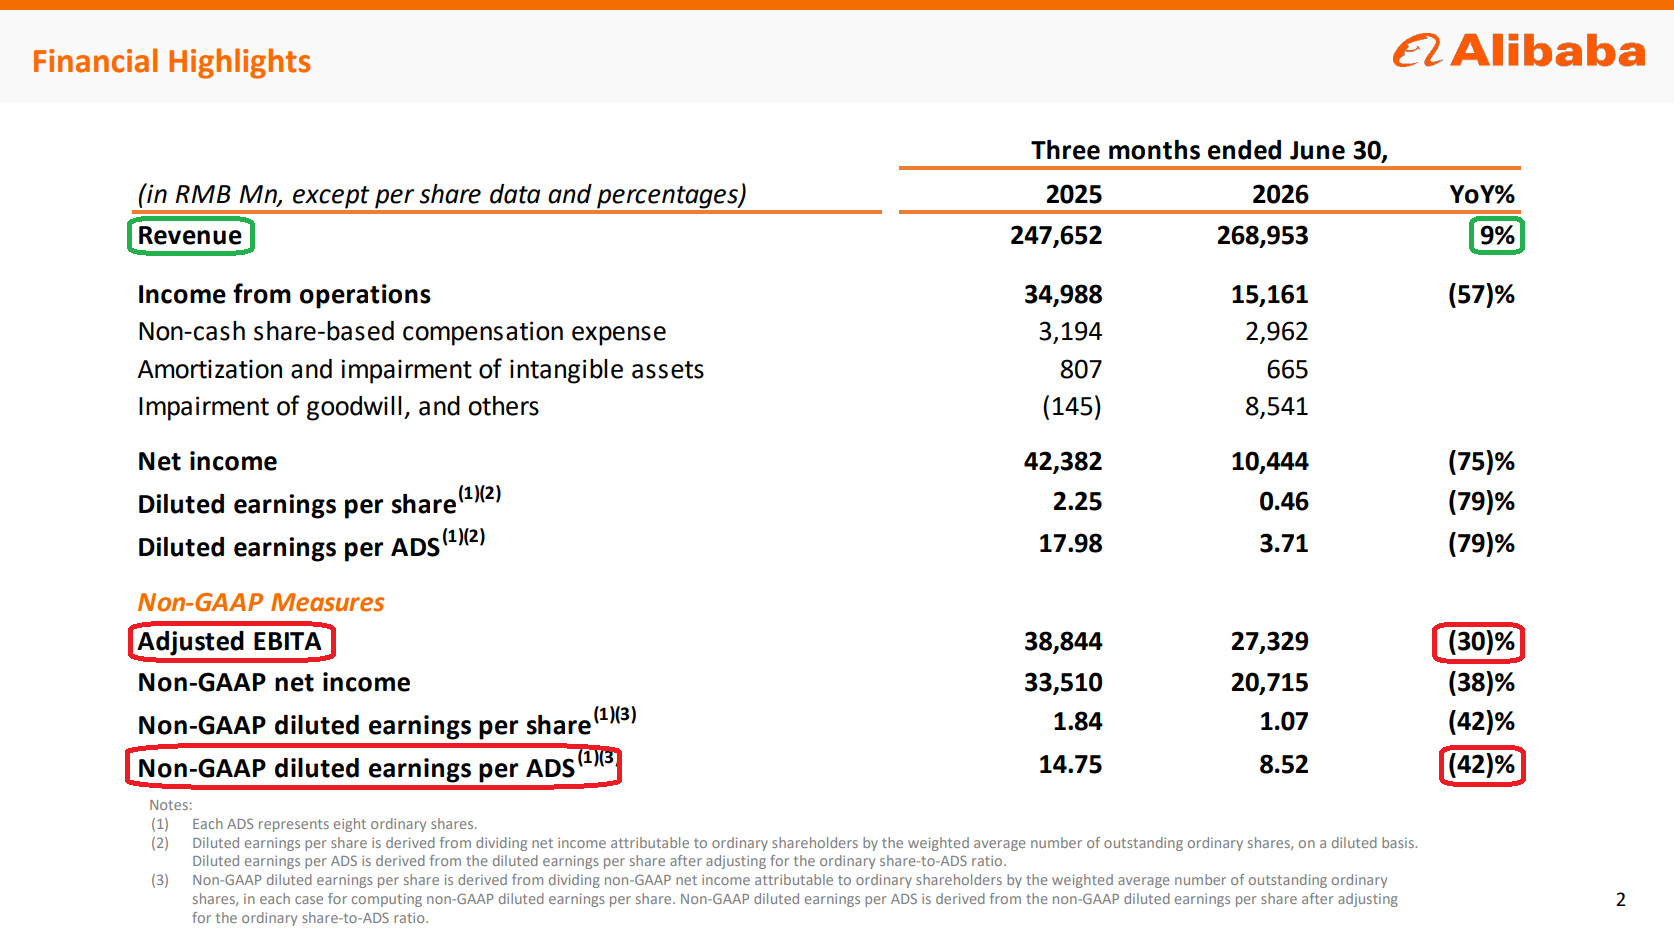
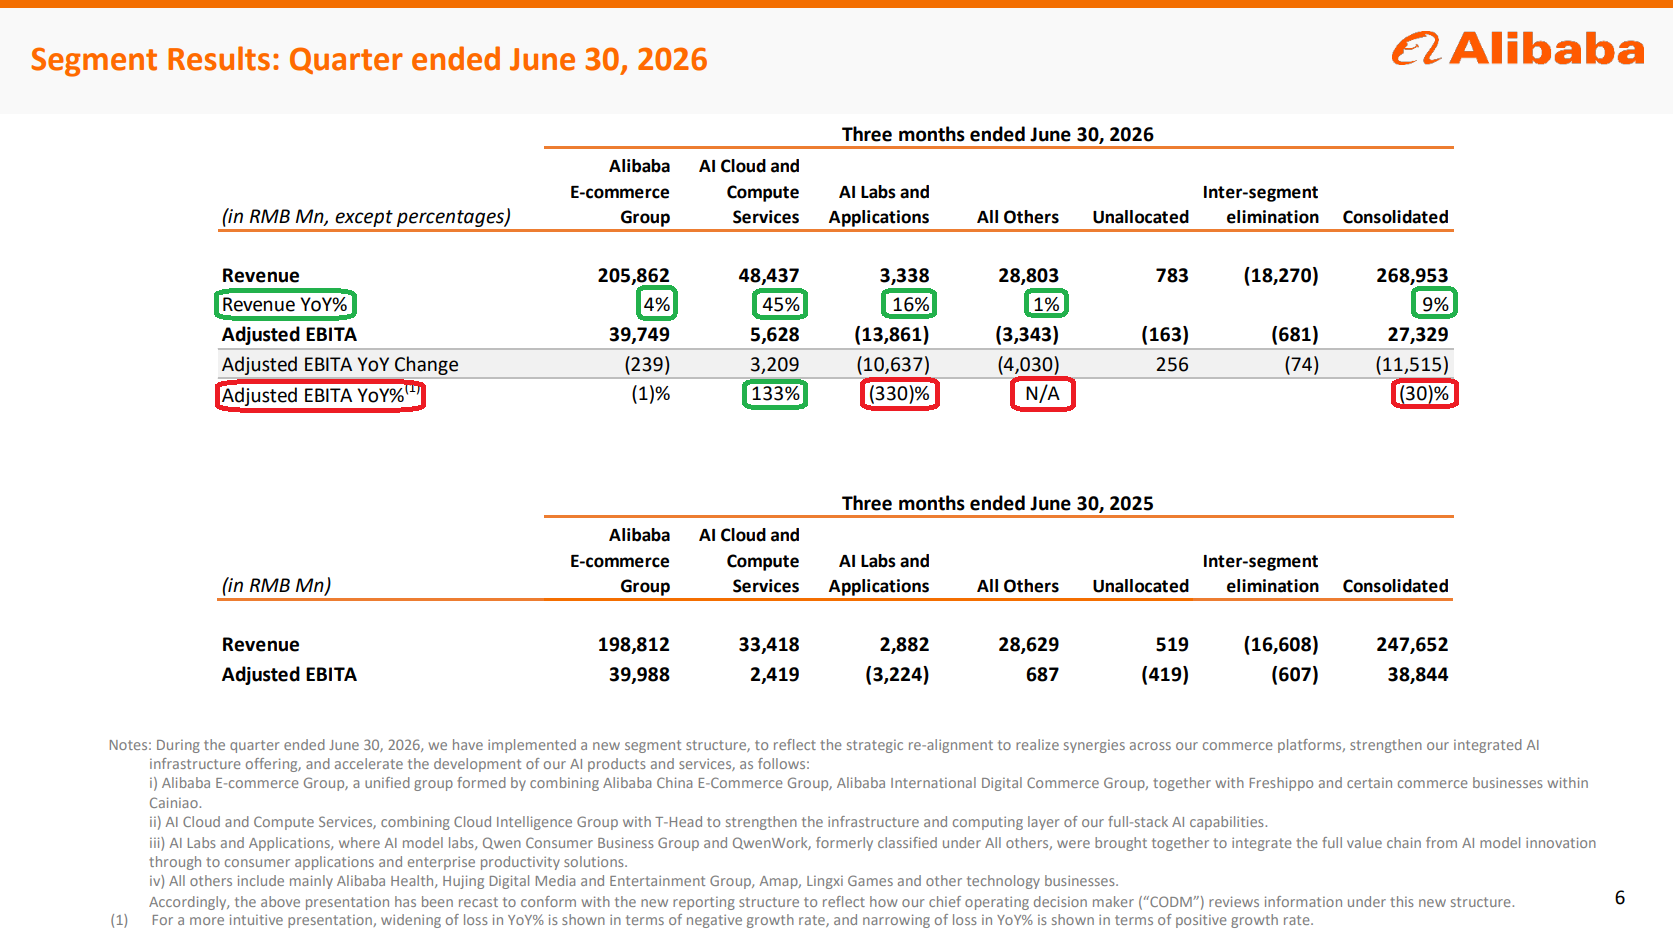
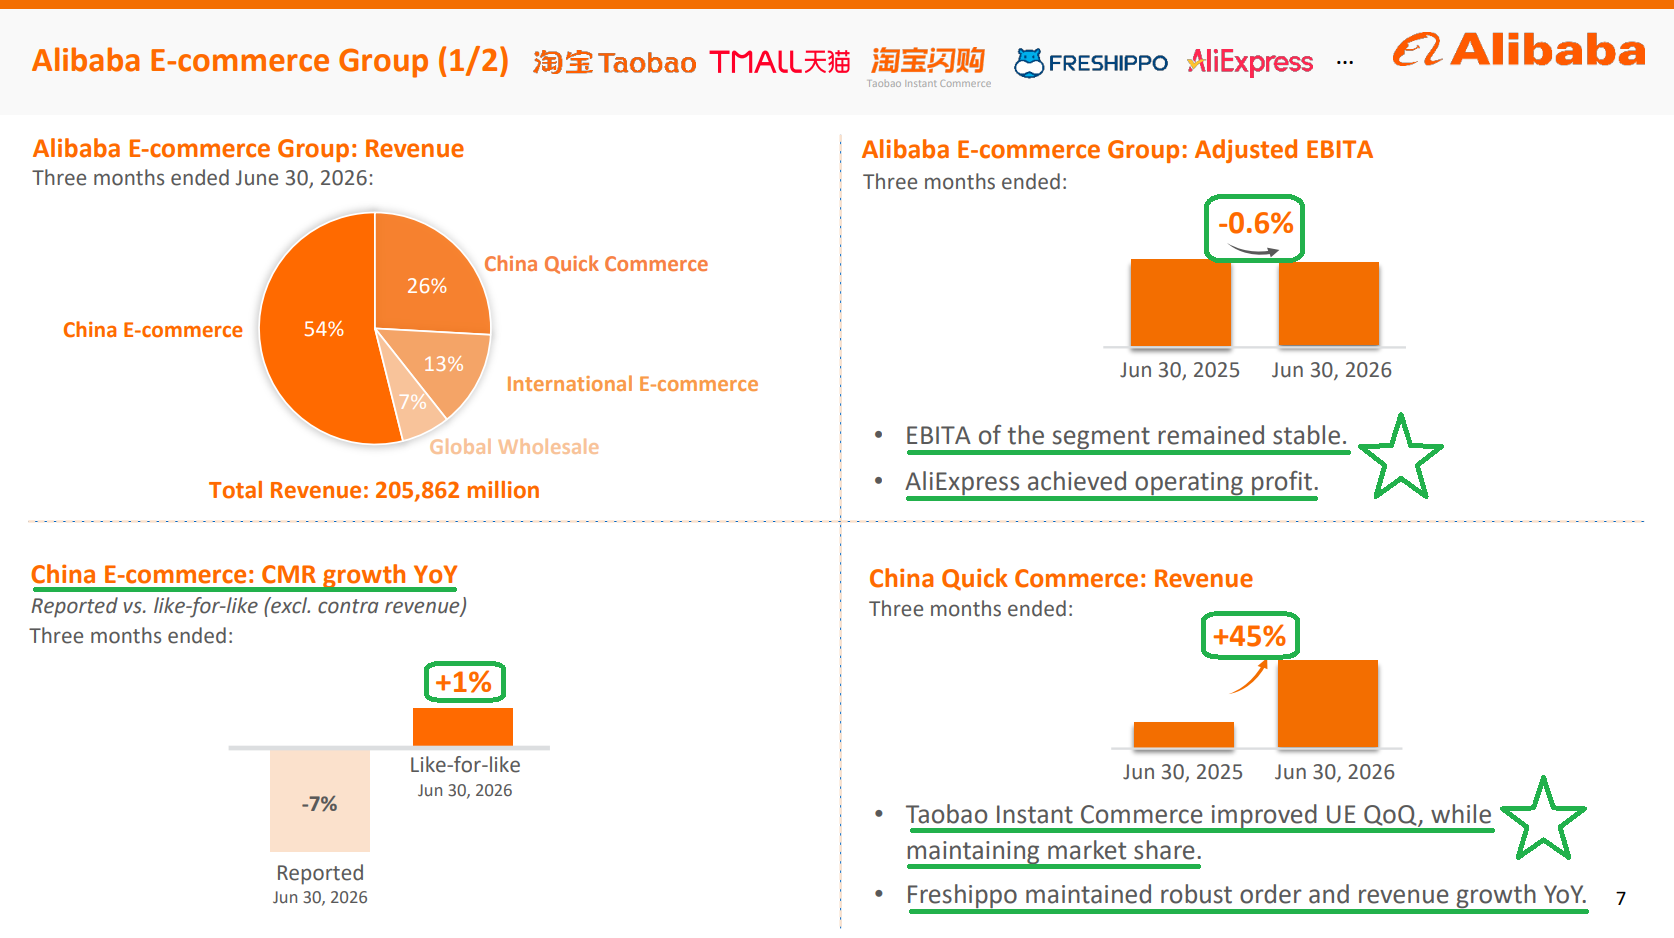
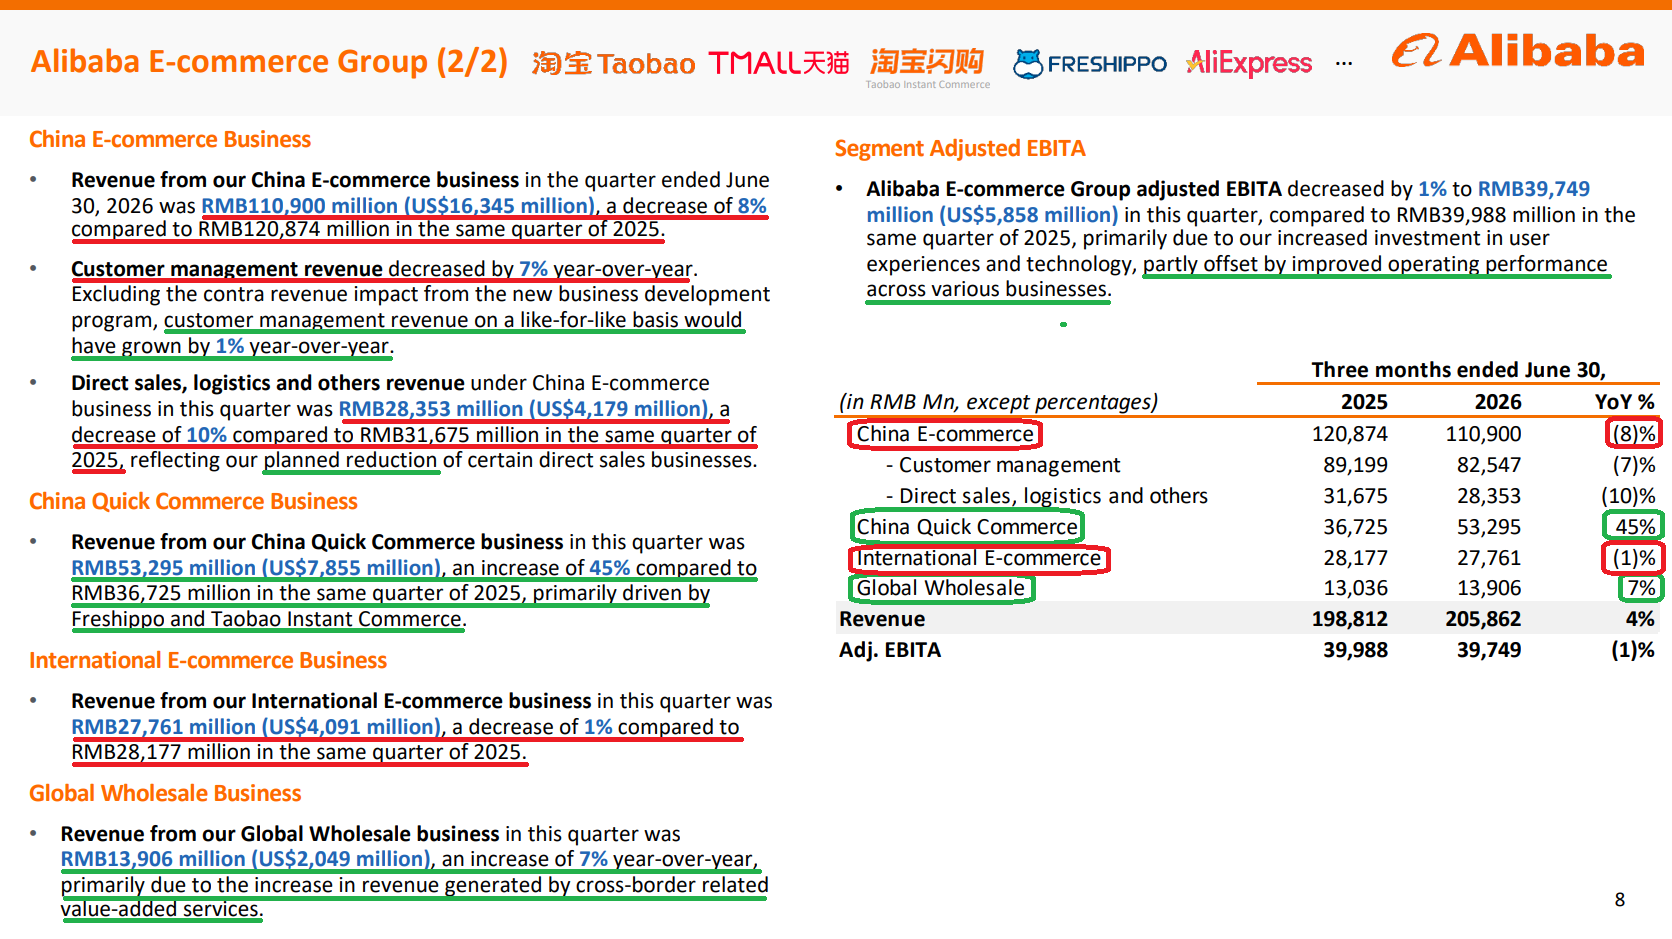
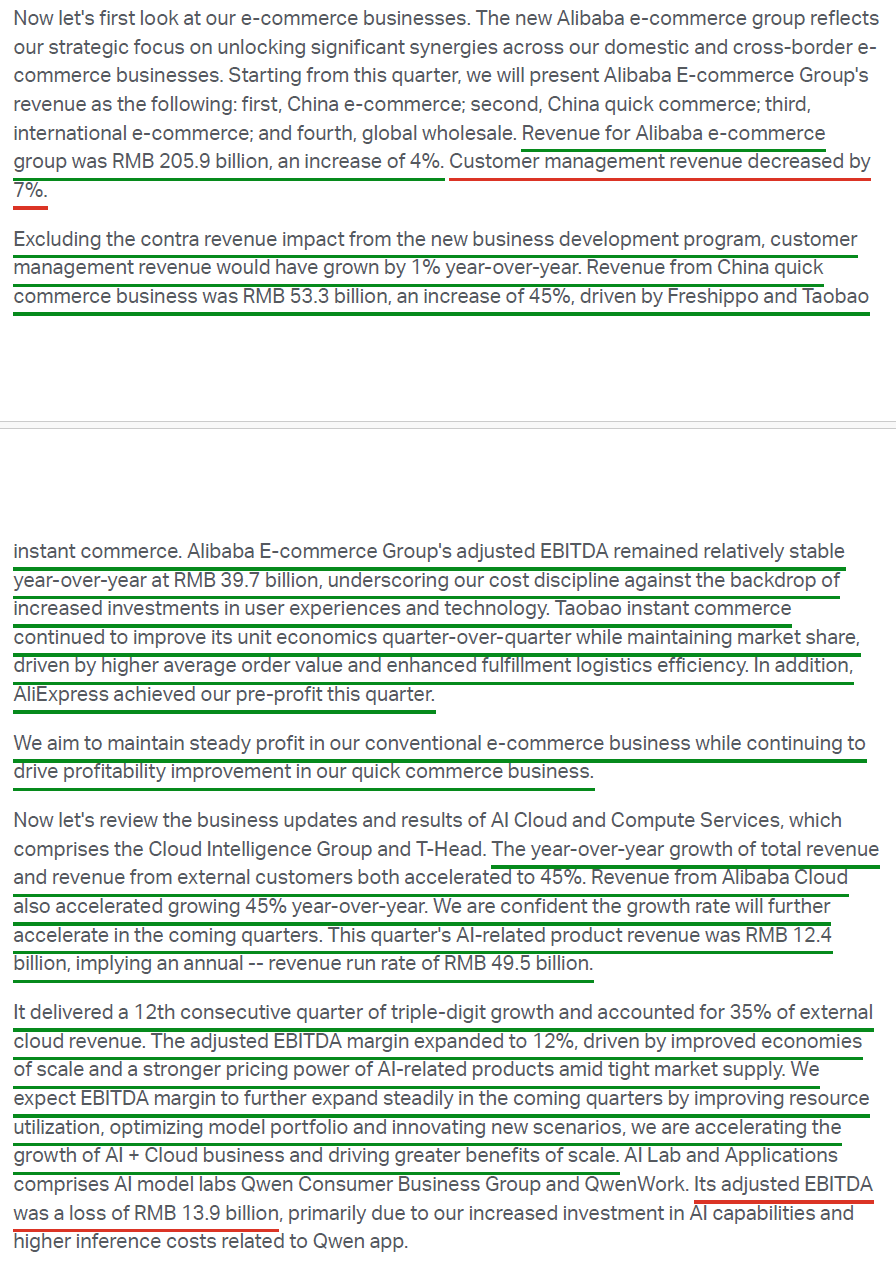
1) Revenue came in at $39.6B (+9% Y/Y), slightly below the ~$39.7B consensus, with growth driven by AI Cloud and Compute Services and China Quick Commerce, both up 45% Y/Y, offsetting an 8% decline in China E-commerce.
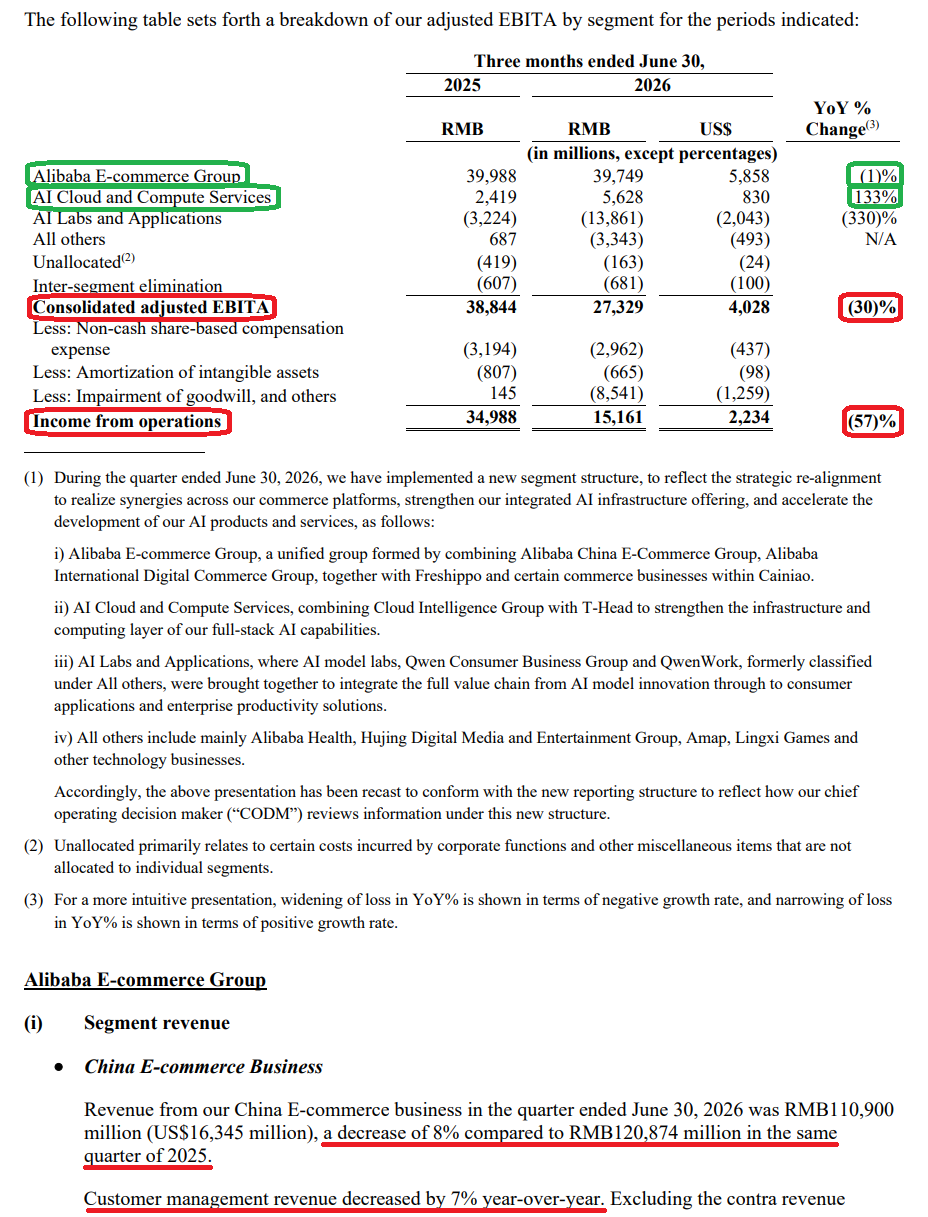
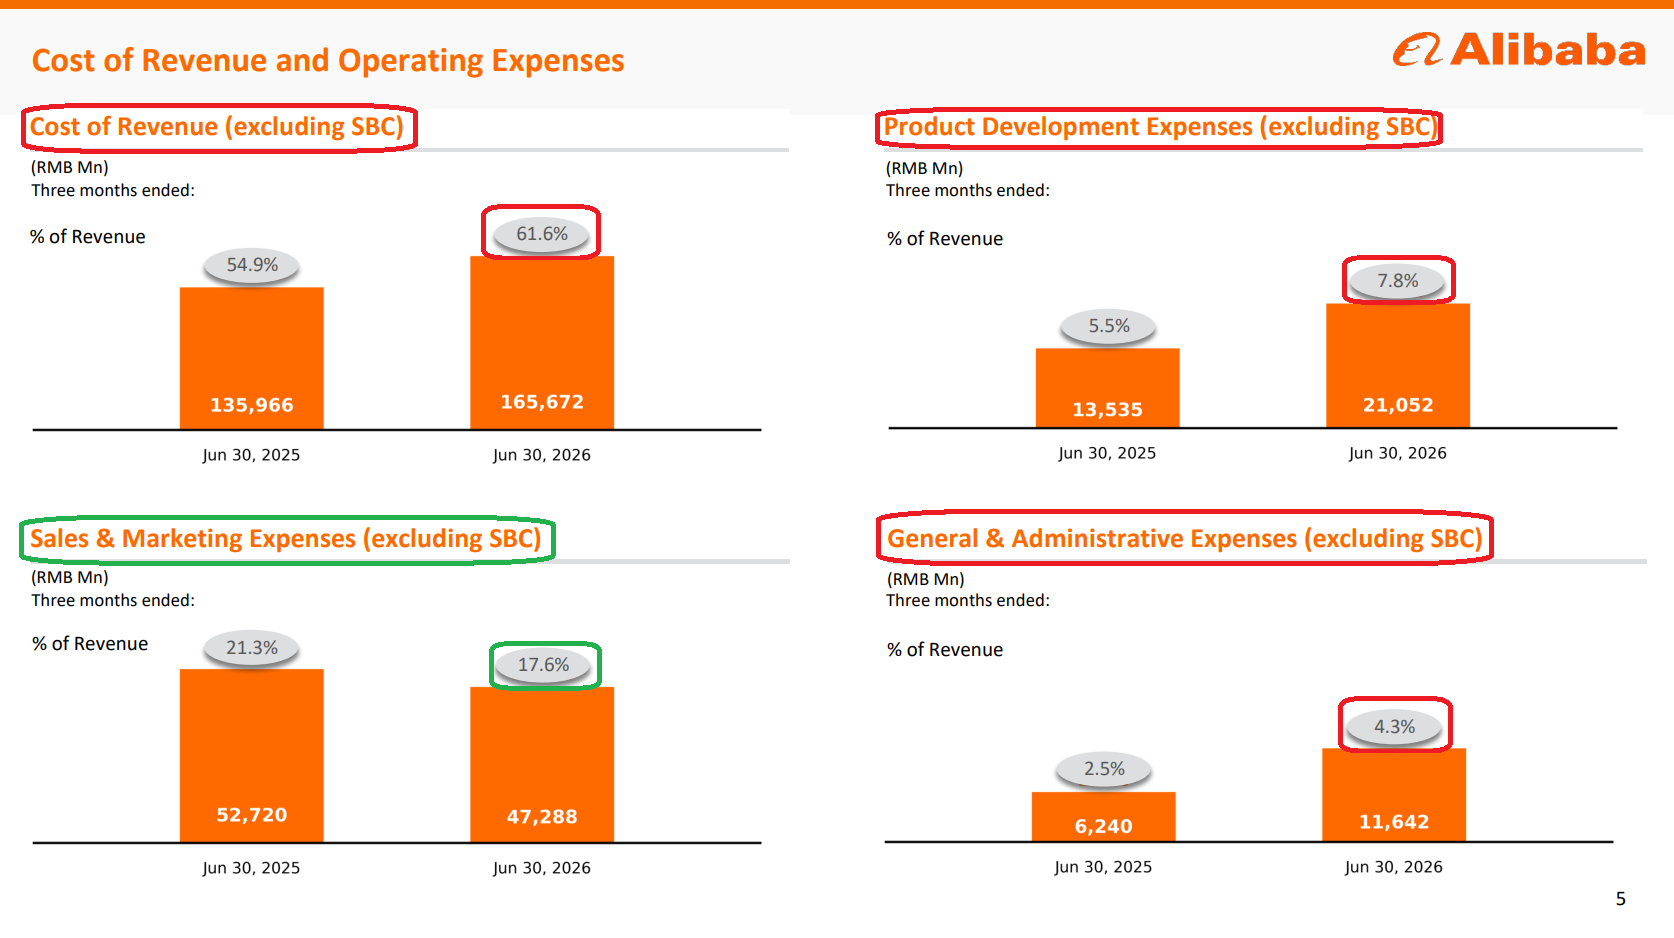
2) Adjusted EBITA fell 30% Y/Y to $4.03B, with margin compressing to 10.2% from 15.7% in the prior-year period, driven by technology investment and higher Qwen app inference costs, partially offset by improved cloud results. Product development rose to 7.8% of revenue ex-SBC from 5.5% on infrastructure spend, while G&A rose to 4.3% from 2.5% on the €550M European Commission Digital Services Act fine, which is excluded from adjusted EBITA. Sales and marketing fell to 17.6% of revenue from 21.3% as subsidies shifted to contra revenue under the new business development program, alongside more efficient Taobao Instant Commerce spend.
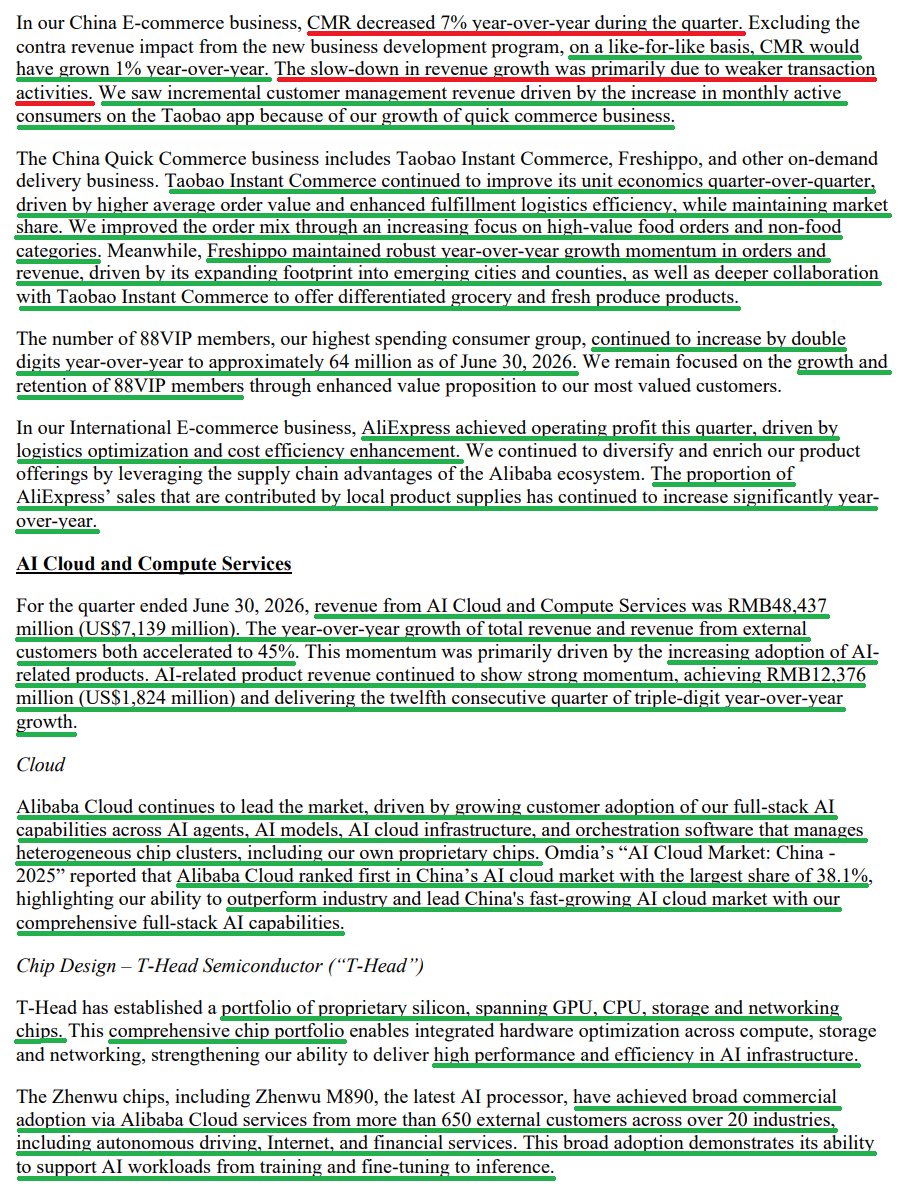
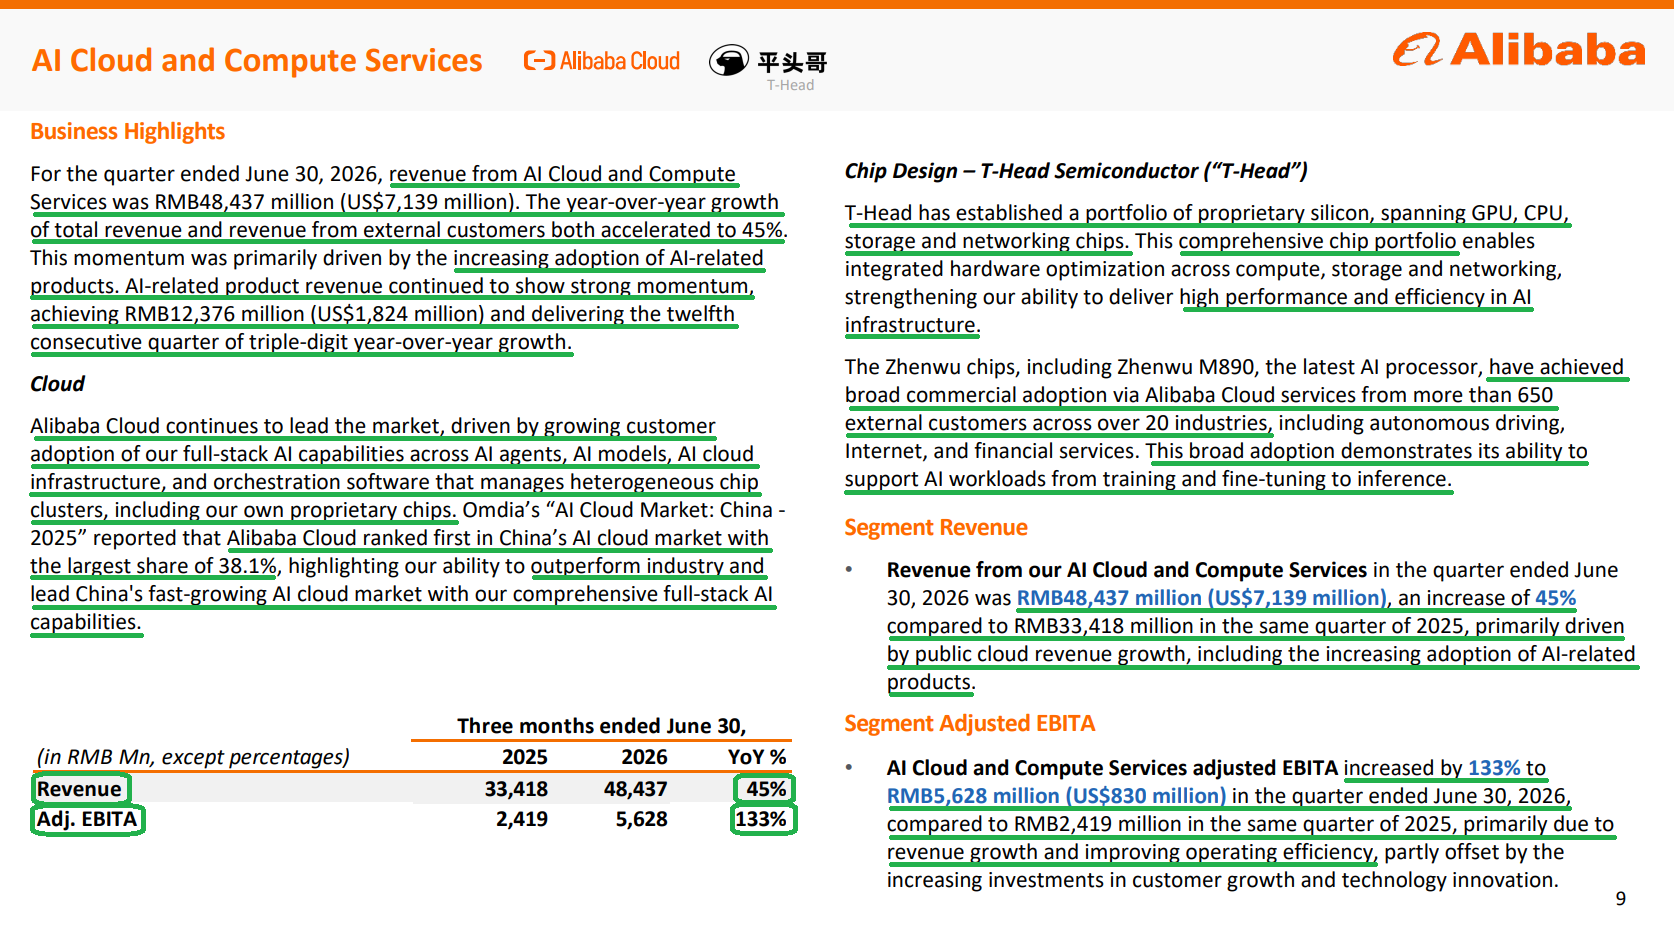
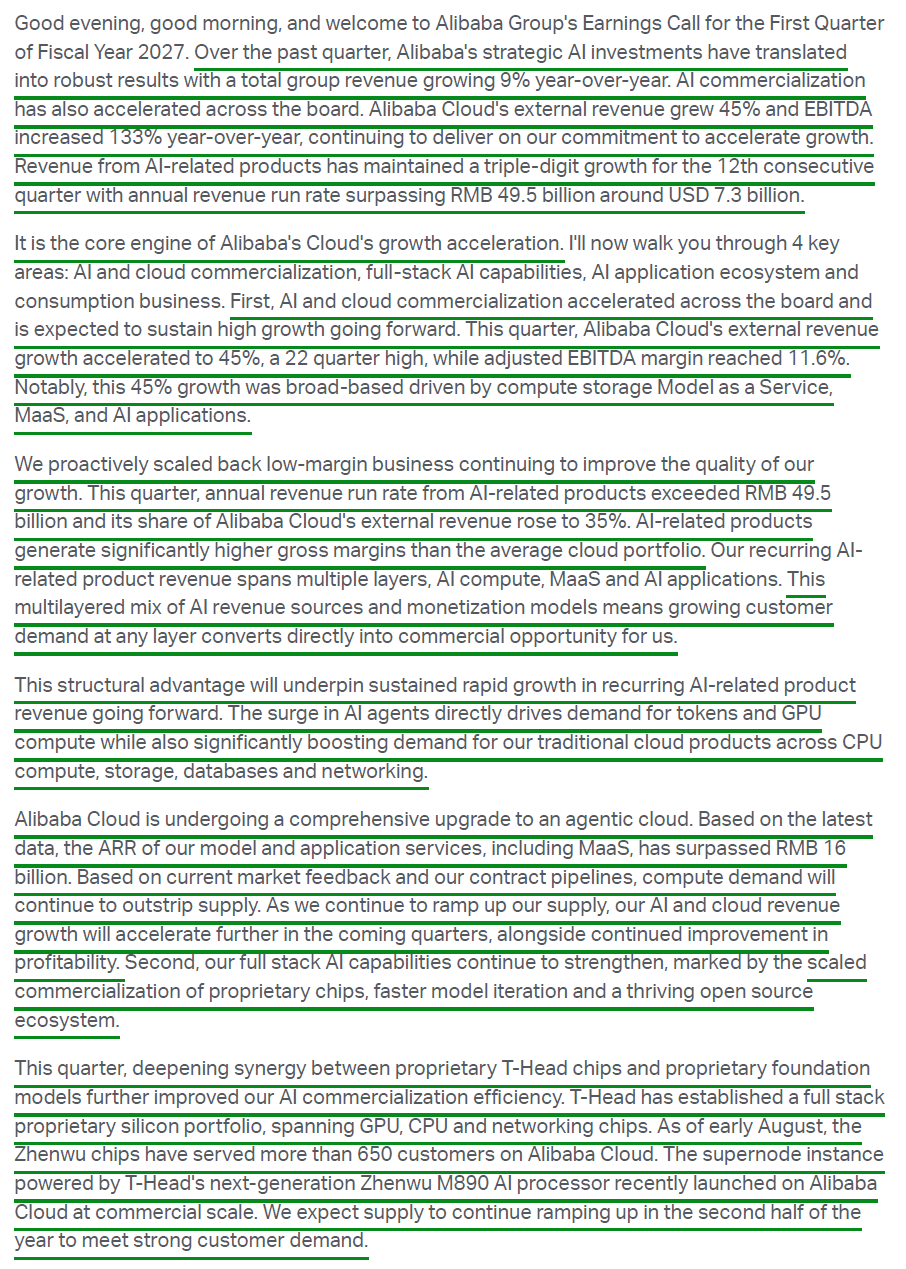
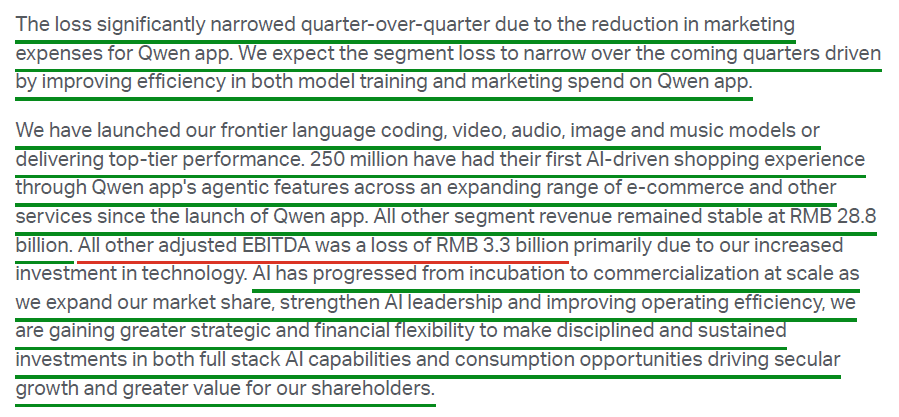
3) AI Cloud and Compute Services revenue grew 45% Y/Y to $7.14B, with total and external customer revenue both accelerating to 45%, the fastest pace in 22 quarters and the ninth consecutive quarter of acceleration. Segment adjusted EBITA rose 133% Y/Y to $830M, with margin expanding ~440 bps to 11.6% from 7.2%. Management guided to further top-line acceleration in coming quarters alongside sequential margin expansion from better resource utilization, model portfolio optimization, and rising proprietary chip substitution, with the long-term target of $100B+ in annual external cloud revenue by 2030 unchanged and management citing visibility into a 20% segment margin over the next three to five years.
4) AI-related product revenue reached $1.82B, the twelfth consecutive quarter of triple-digit growth, now accounting for 35% of external cloud revenue, up from 30% last quarter and on track to exceed 50% within the next year. The annual run rate reached $7.3B from ~$5.3B a quarter ago, with management forecasting that figure will approach $10B next quarter. ARR for model and application services, including MaaS, exceeded $2.4B as of August against a reaffirmed year-end target of ~$4.4B. Management noted that AI-related products carry meaningfully higher gross margins than the average cloud portfolio, the primary driver behind the segment margin expansion.
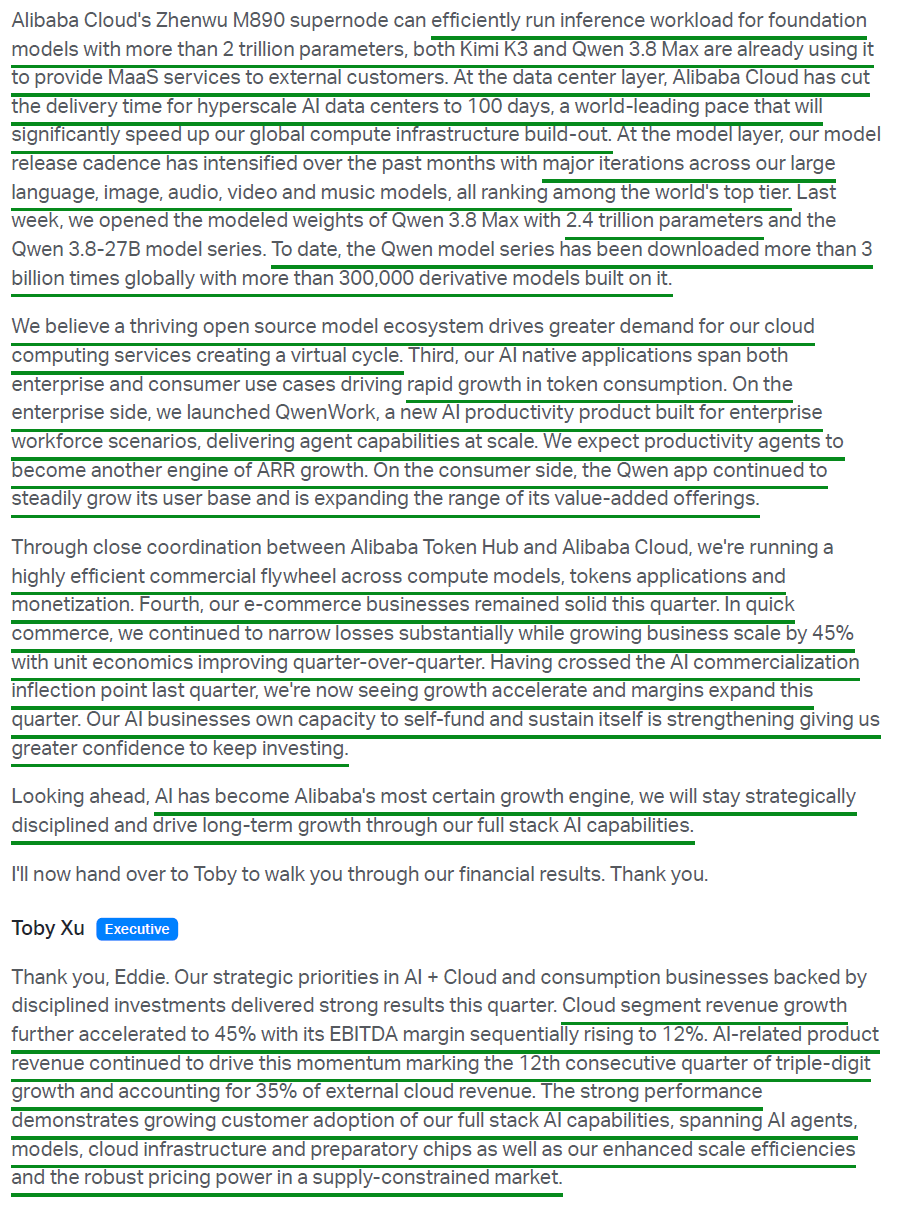
5) T-Head, Alibaba’s proprietary chip subsidiary, now spans GPU, CPU, storage, and networking silicon. The Zhenwu line, including the new M890 processor, serves more than 650 external customers across 20+ industries, including autonomous driving, internet, and financial services, with over 500,000 prior-generation chips shipped to date. The M890 launched commercially on Alibaba Cloud this quarter and can run the largest Qwen models, with supply ramping through the back half and second-generation development beginning in 2H. Management called in-house silicon one of the primary levers for cloud margin expansion, since every chip deployed replaces a commercial GPU bought at a premium.
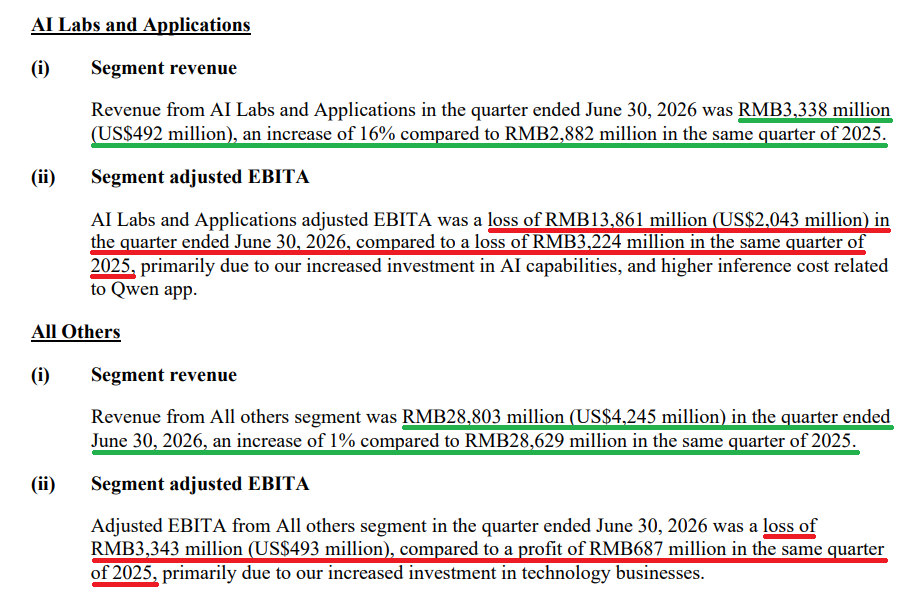
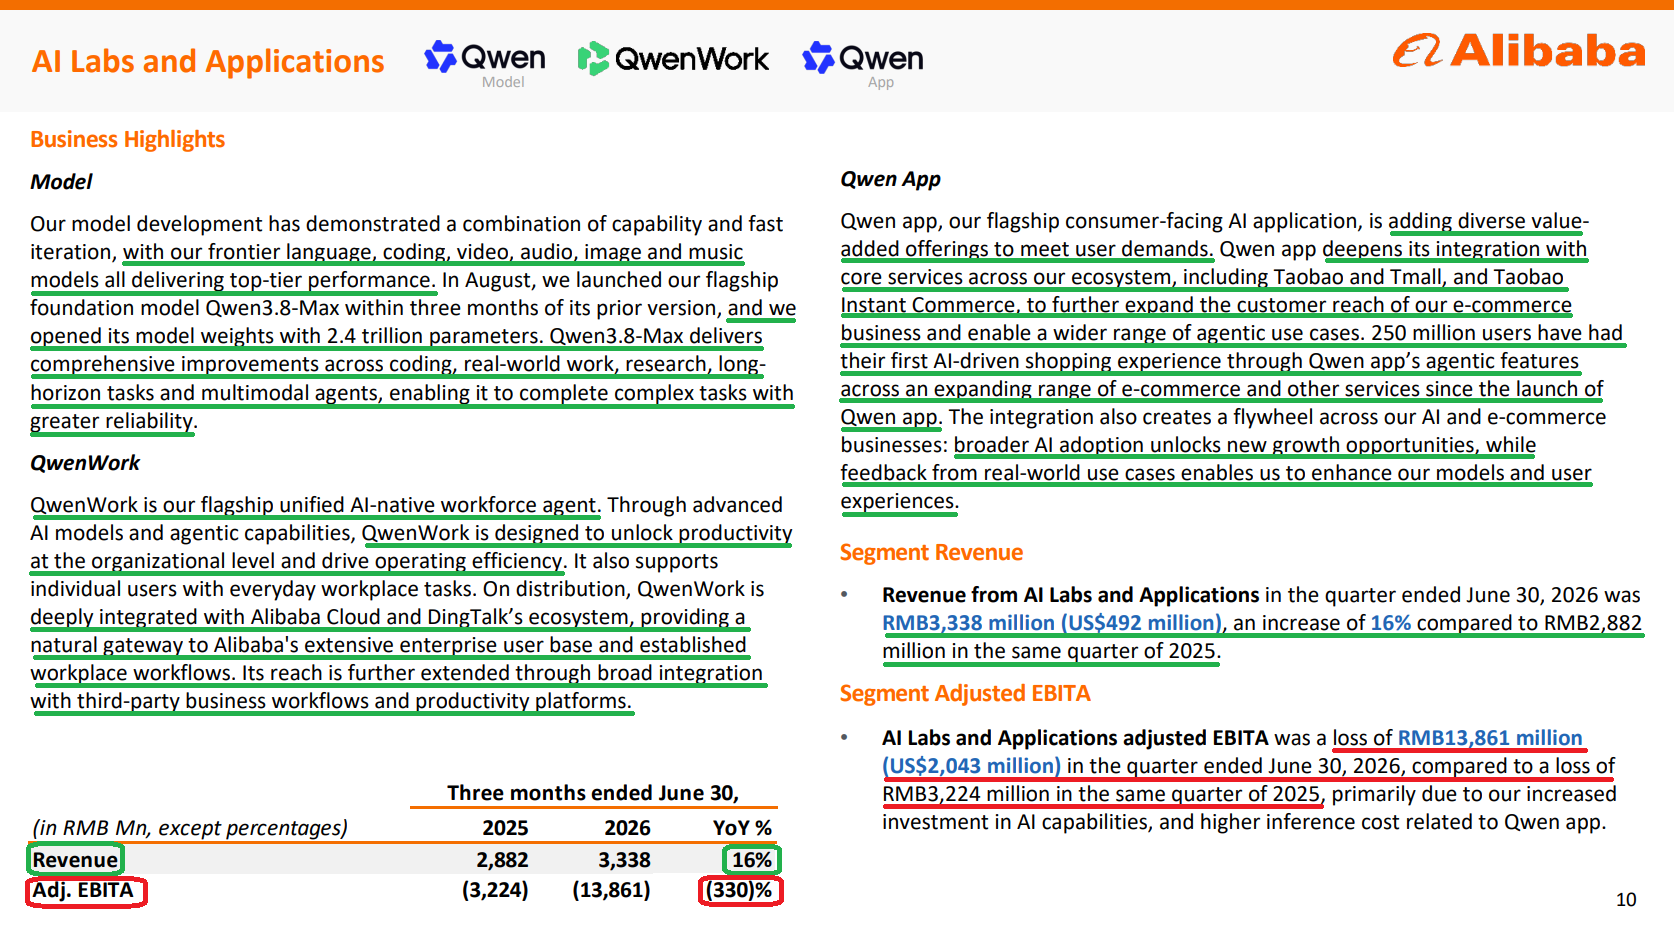
6) AI Labs and Applications, the newly created segment housing the model labs, Qwen app, and QwenWork, posted revenue of $492M, with adjusted EBITA a loss of $2.04B versus a $475M loss a year ago on heavier AI investment and higher Qwen app inference costs. The loss narrowed sequentially as Qwen app marketing spend came down, with management guiding to further narrowing from training efficiency and more disciplined marketing. The Qwen model series has now been downloaded more than 3 billion times globally, with over 300,000 derivative models built on it, while 250 million users have had their first AI-driven shopping experience through the app’s agentic features.
7) Alibaba E-commerce Group revenue grew 4% Y/Y to $30.34B, with adjusted EBITA effectively flat at $5.86B (-1% Y/Y) and margin of 19.3% versus 20.1%, ~80 bps of compression amid continued quick commerce investment. China E-commerce revenue was $16.35B (-8% Y/Y, 54% of the segment), with CMR down 7% Y/Y on a reported basis but up 1% on a like-for-like basis excluding the contra revenue impact from the new business development program. Direct sales, logistics, and others fell 10% to $4.18B on a planned reduction in certain direct sales businesses. 88VIP members, Alibaba’s highest-spending cohort and closest equivalent to Amazon Prime, grew double digits Y/Y to ~64 million.
8) China Quick Commerce revenue grew 45% Y/Y to $7.86B (26% of the e-commerce segment), driven by Freshippo and Taobao Instant Commerce. Management said unit economics improved sequentially and losses narrowed substantially on higher average order value and better fulfillment logistics efficiency, all while holding market share. Non-food transaction volume is expected to exceed food within the next fiscal year, with overall profitability targeted for FY29 and management seeing quick commerce contributing 30% of platform GMV long term as the second growth engine for e-commerce.
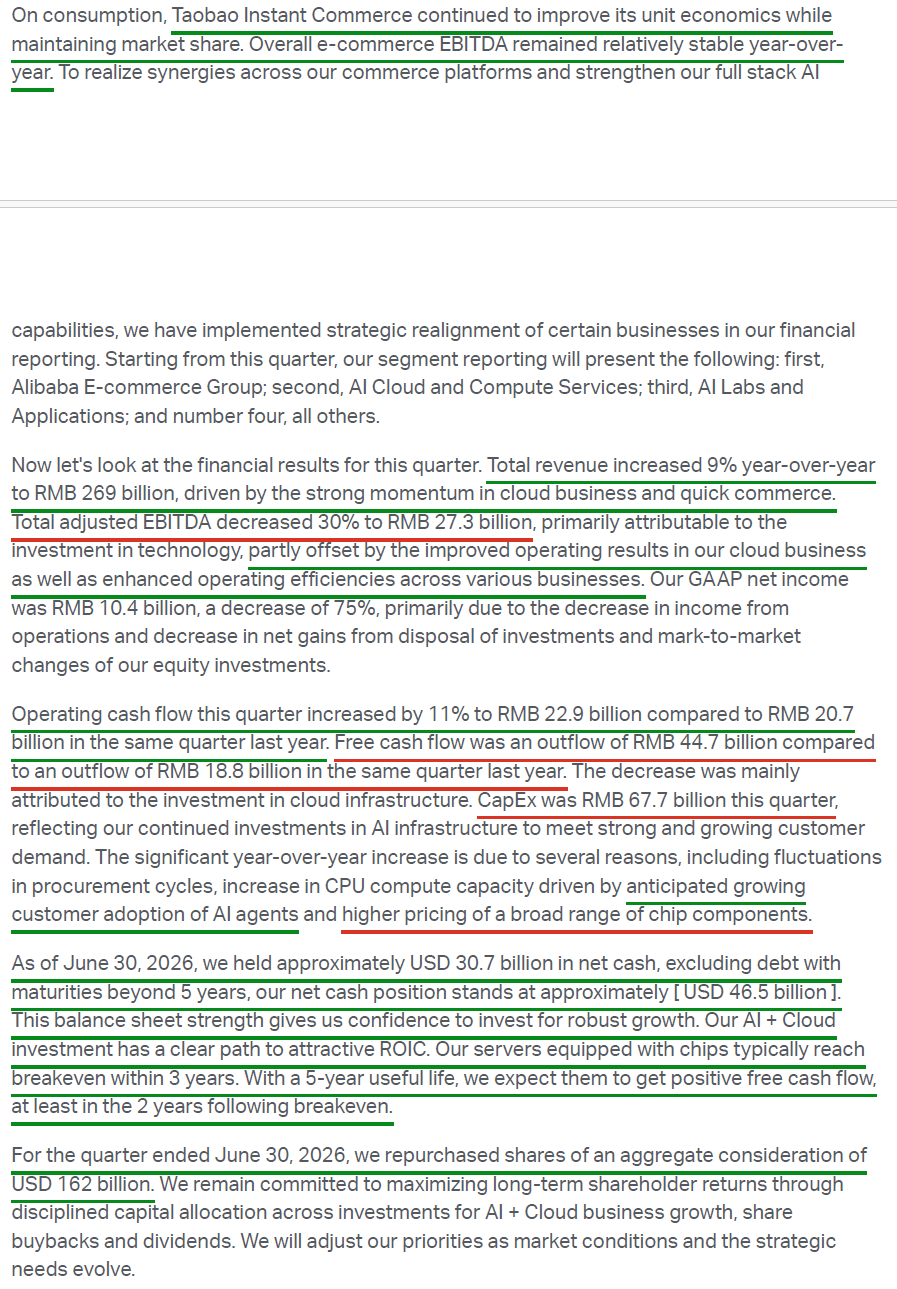
9) Capex was $9.98B in the quarter, up 75% Y/Y and 2.6x sequentially on procurement cycle timing, added CPU compute capacity for anticipated AI agent adoption, and higher pricing across chip components. ~$28B of the ~$56B three-year AI investment plan has been spent, leaving the company halfway through the cycle and in line with plan. At current gross margins, AI capex breaks even within three years, shortening to 2.5 years or less as margins rise and proprietary chips replace purchased ones, at which point management said it can sustain growth above 40% while still generating positive free cash flow.
10) Free cash flow was an outflow of $6.58B versus an outflow of $2.77B a year ago, driven entirely by cloud infrastructure spend. Cash and other liquid investments totaled $69.9B, down ~$6.8B sequentially, leaving a net cash position of $30.7B, or ~$46.5B excluding debt maturities beyond five years. Management repurchased 13.4 million ordinary shares (~1.7 million ADSs) for $162M at ~$97 per ADS.
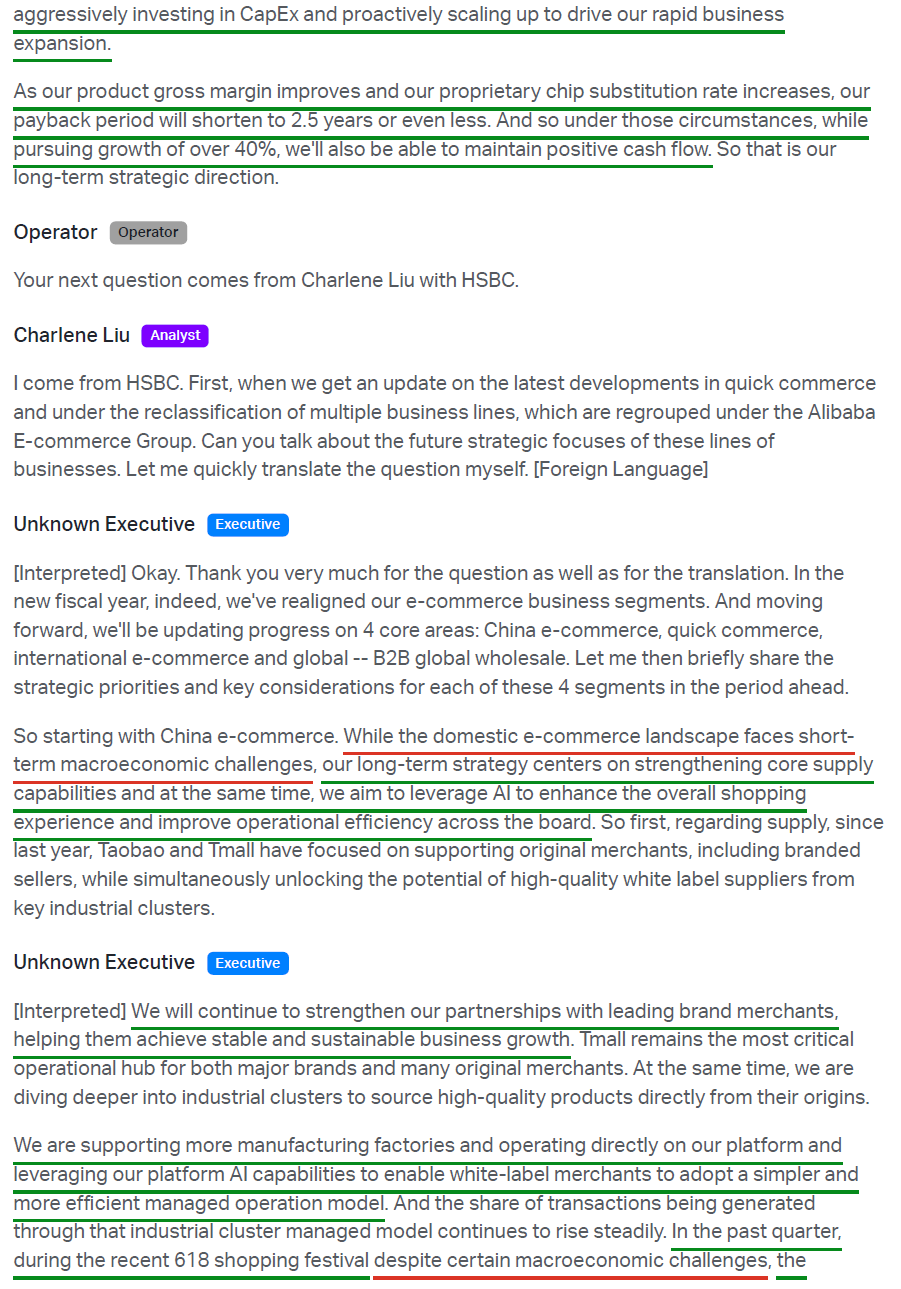
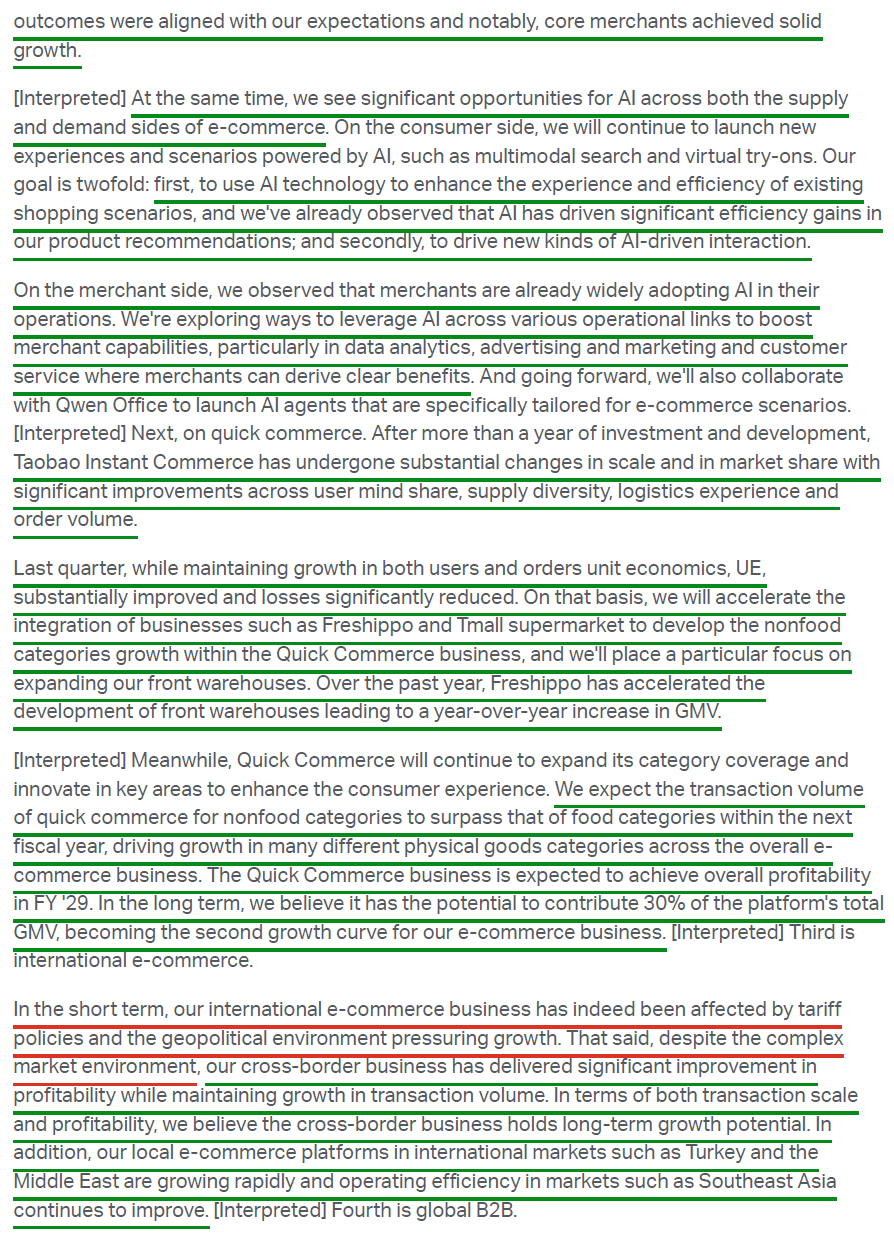
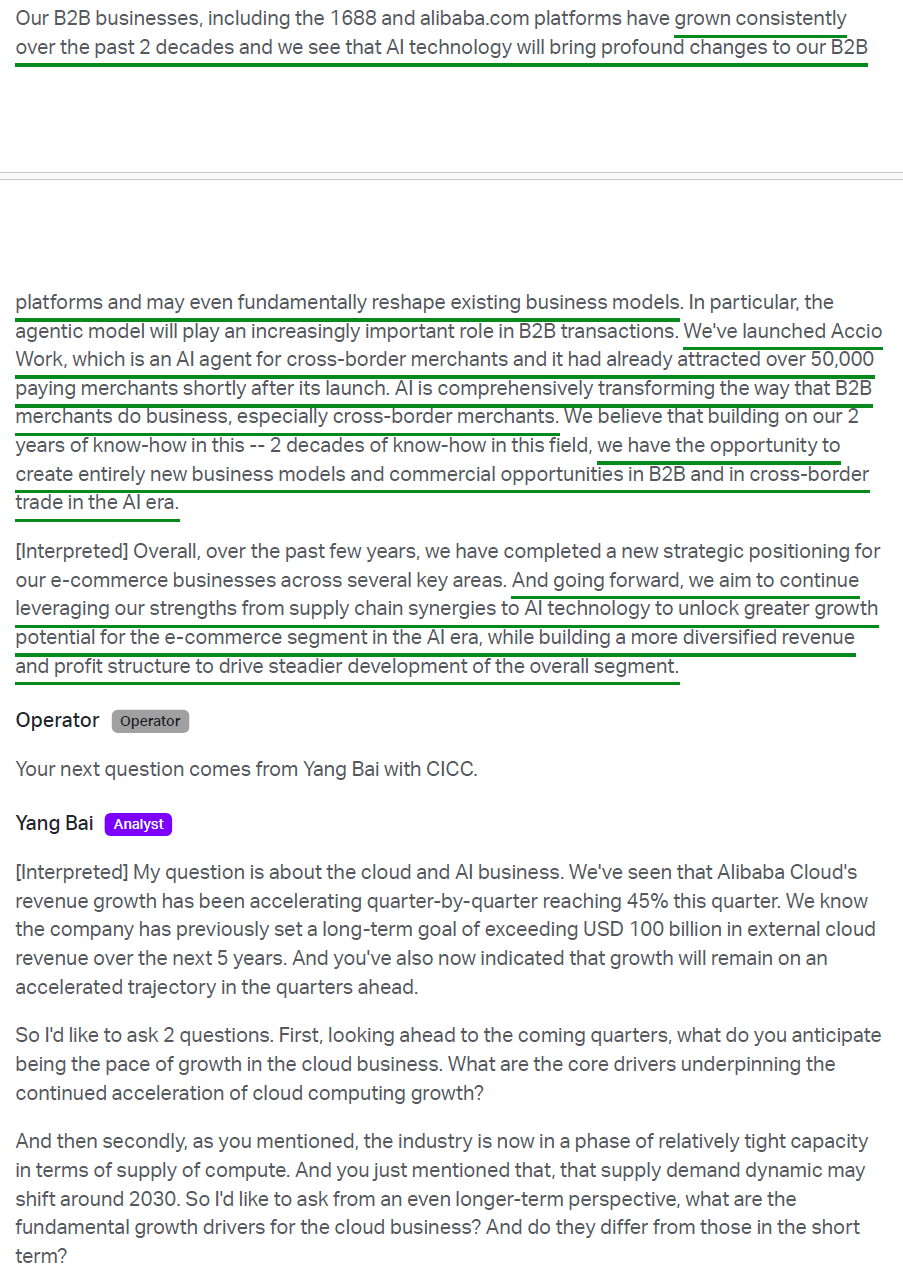
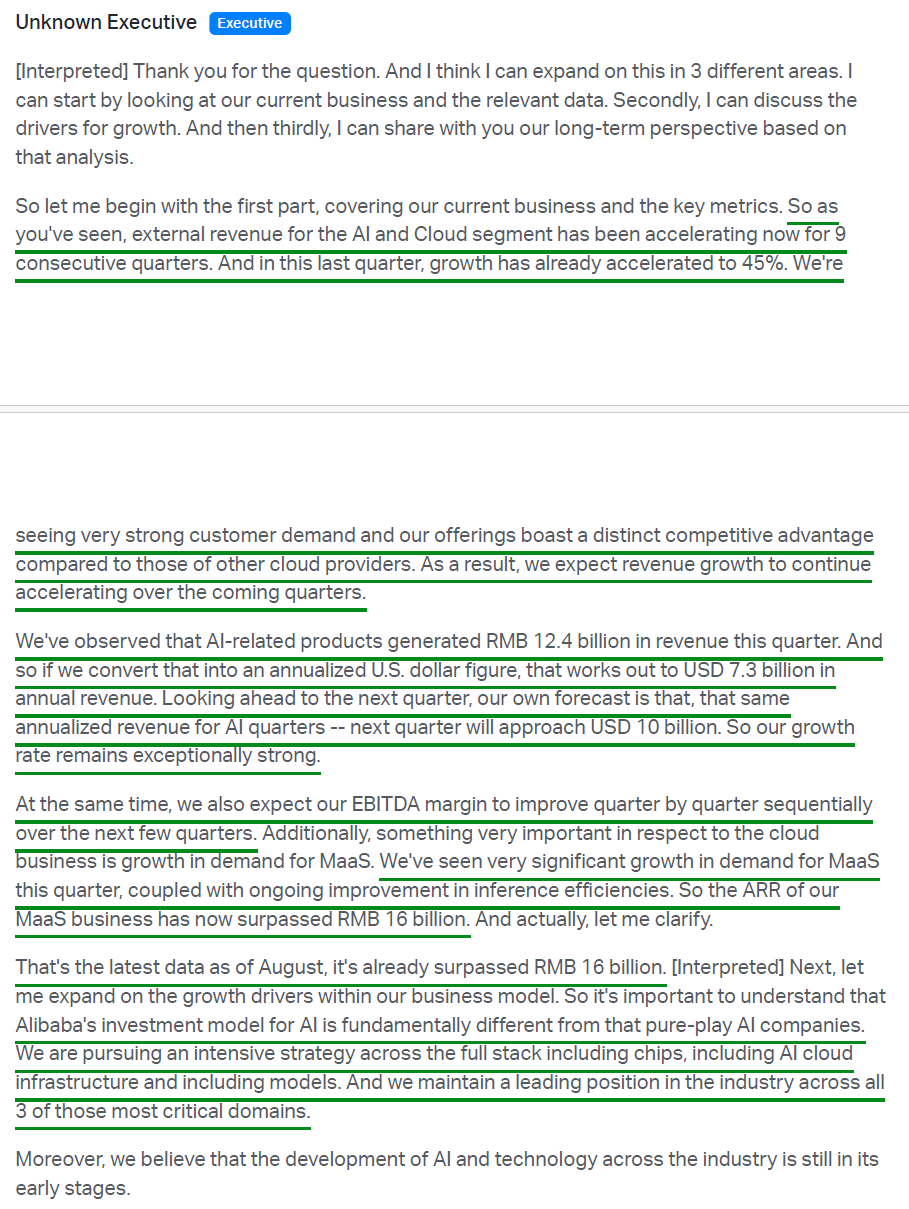
Earnings Call Highlights
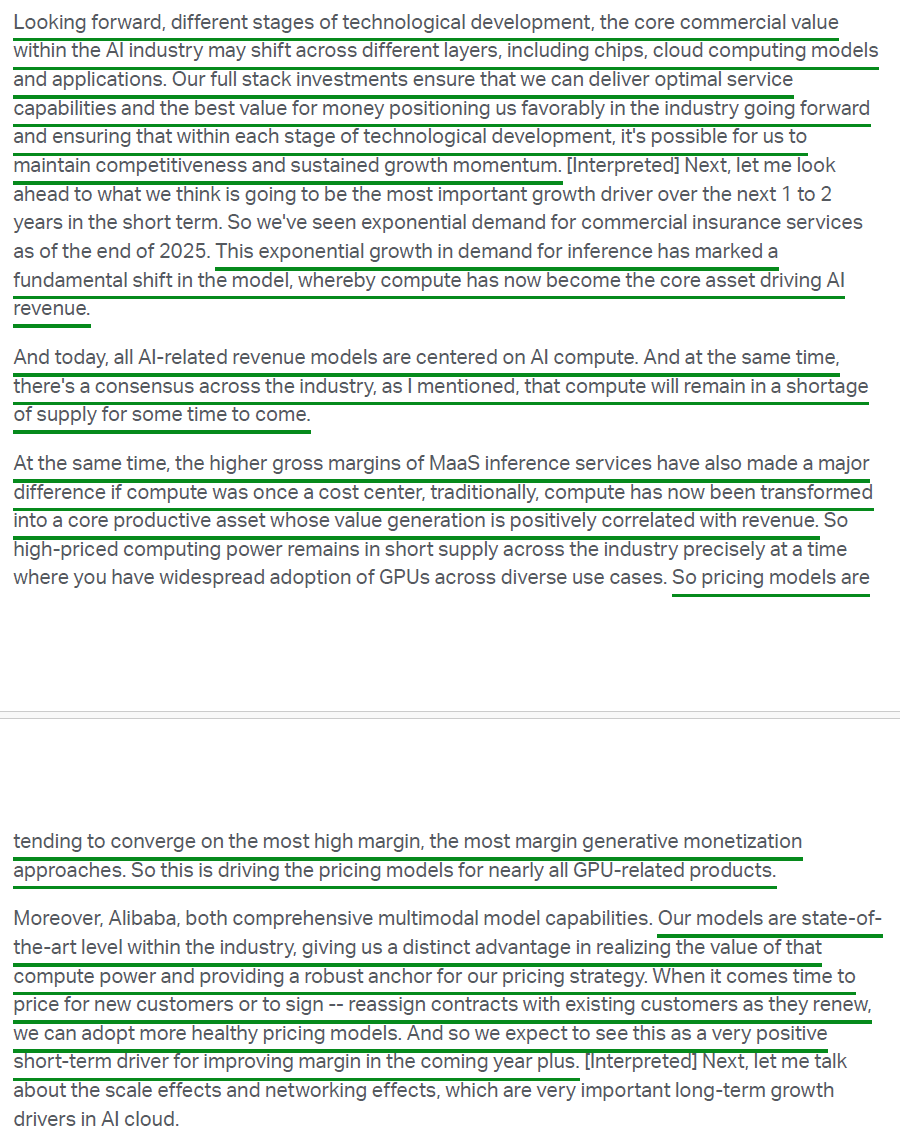
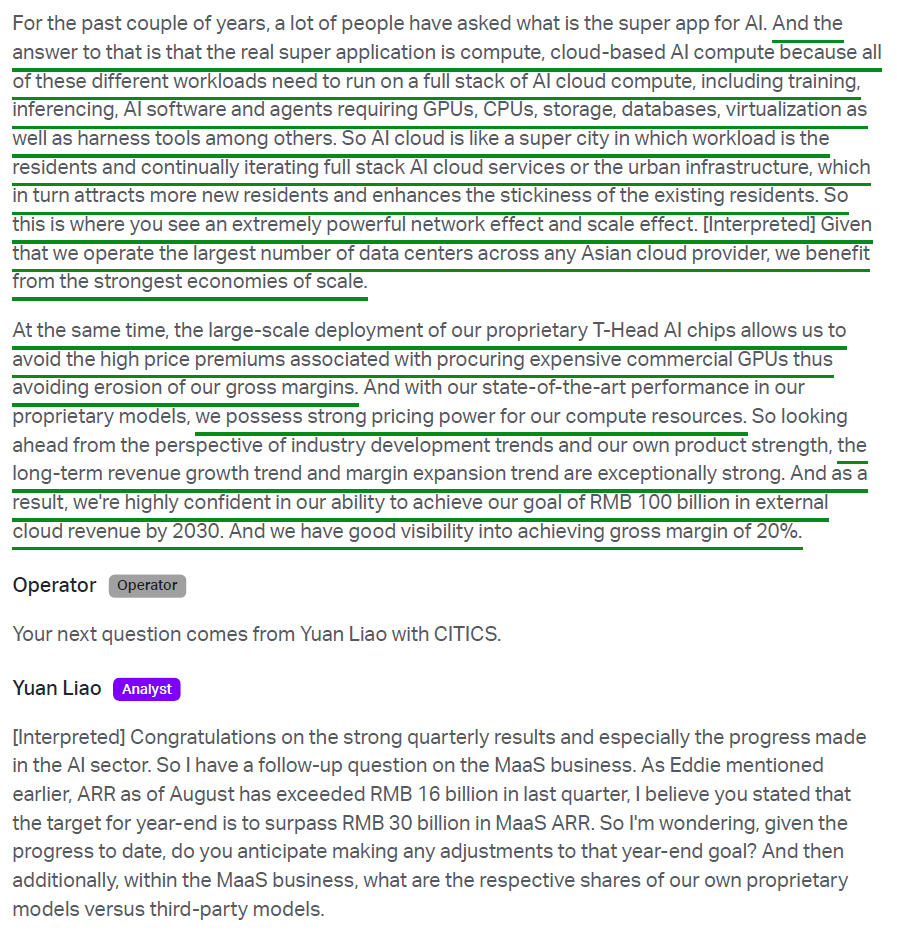
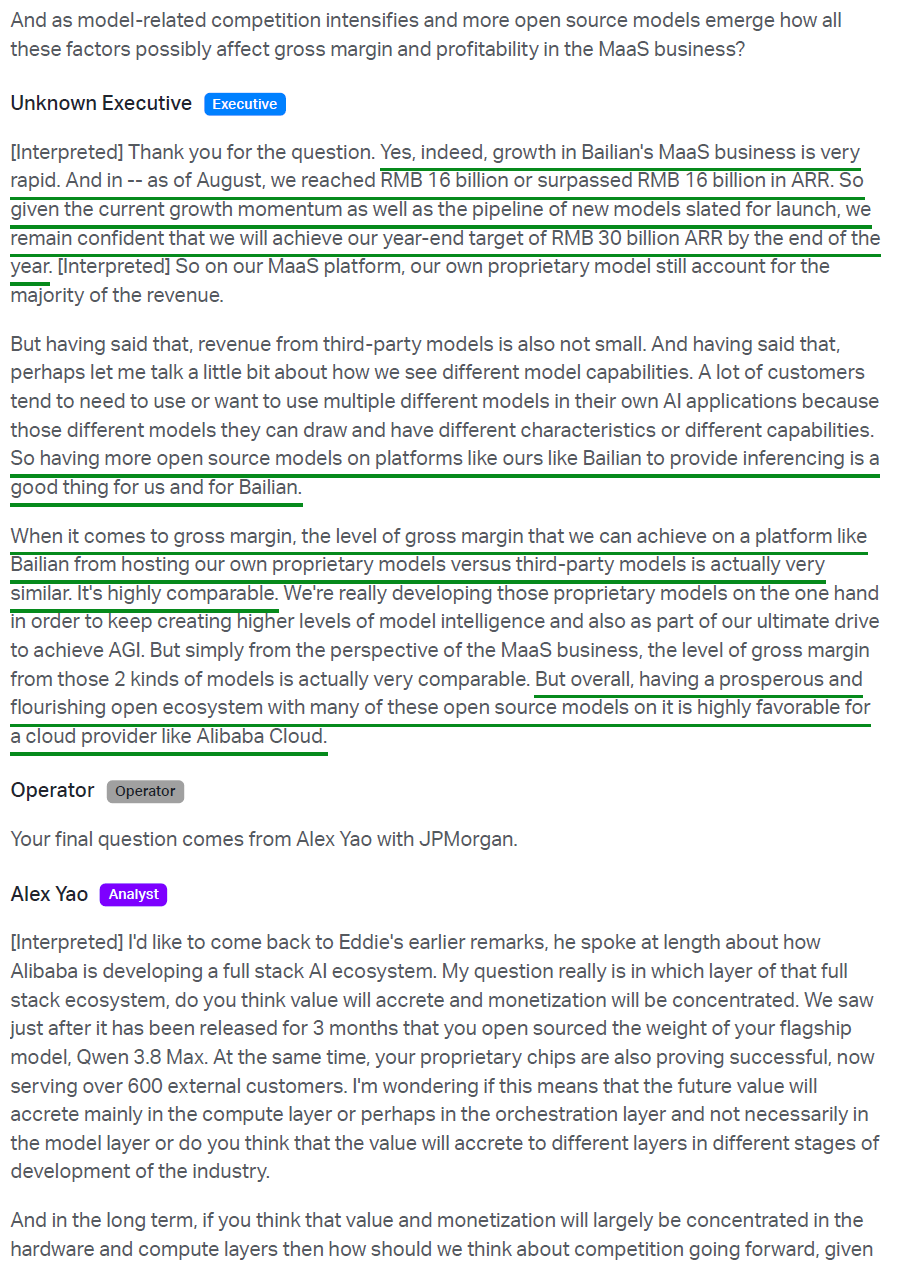
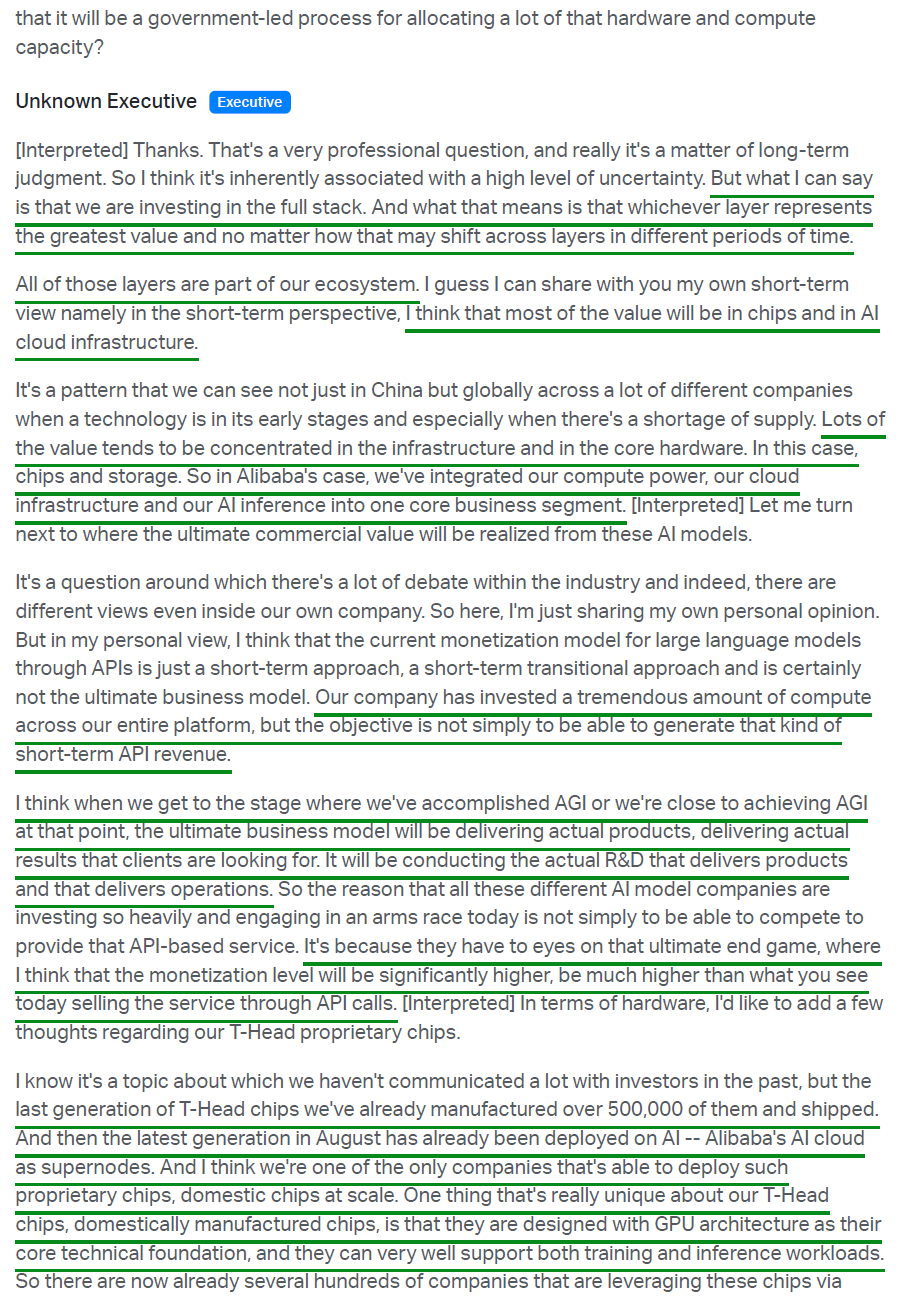
Morningstar Analyst Note
Estée Lauder (EL) Update
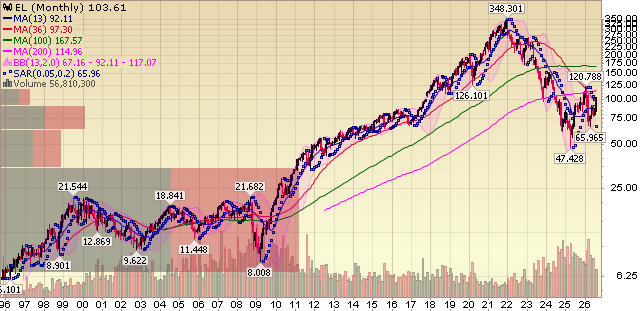
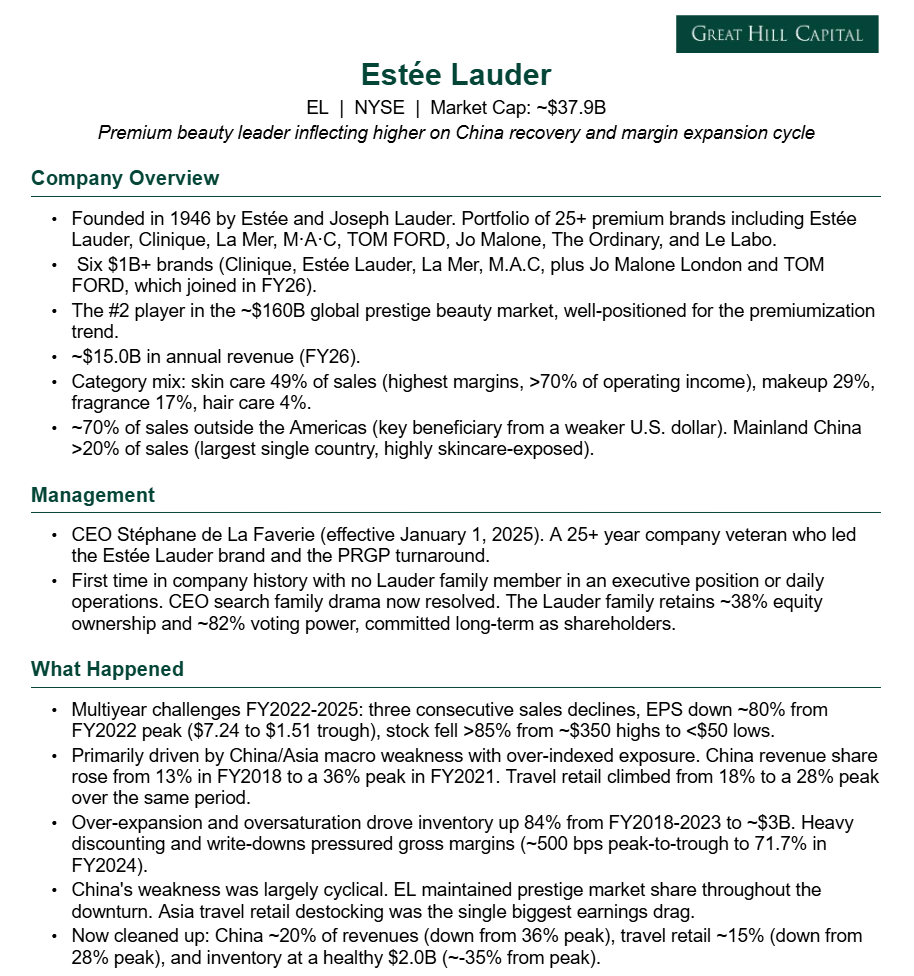
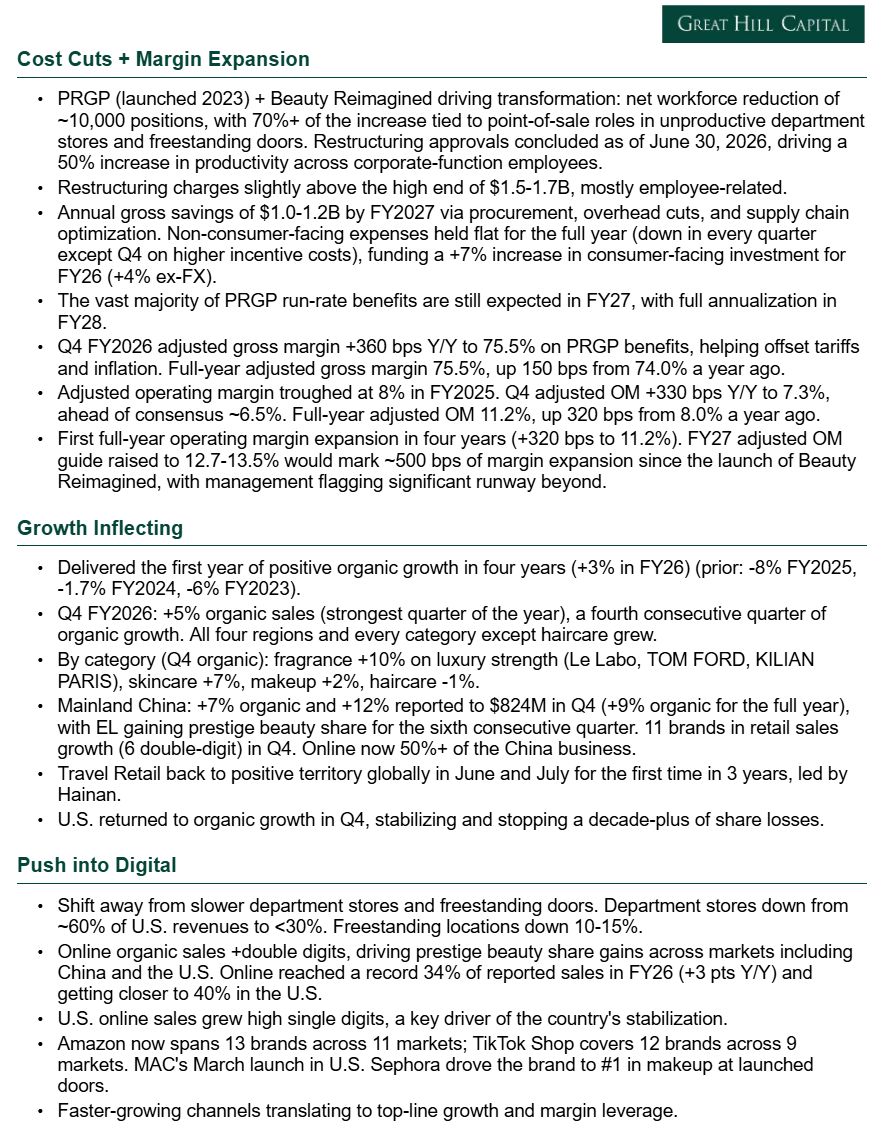
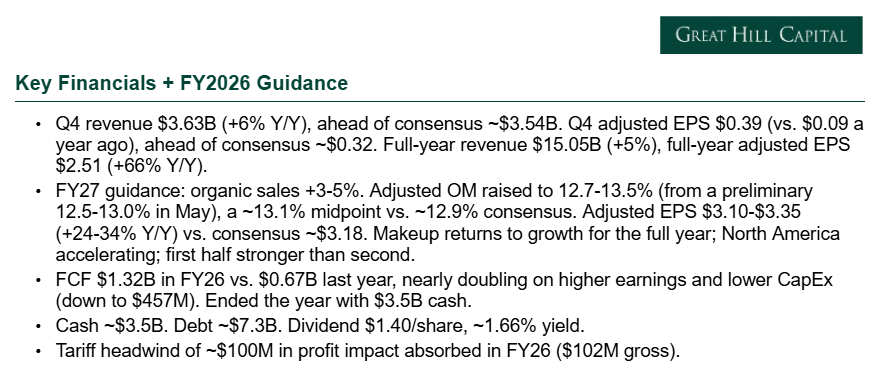
For newer readers, here’s a quick overview of the key drivers behind our thesis on Estée Lauder, a leader in global prestige beauty that is now inflecting back to growth following a cyclical slowdown, with meaningful operating leverage still to come:
Q4 Earnings Breakdown
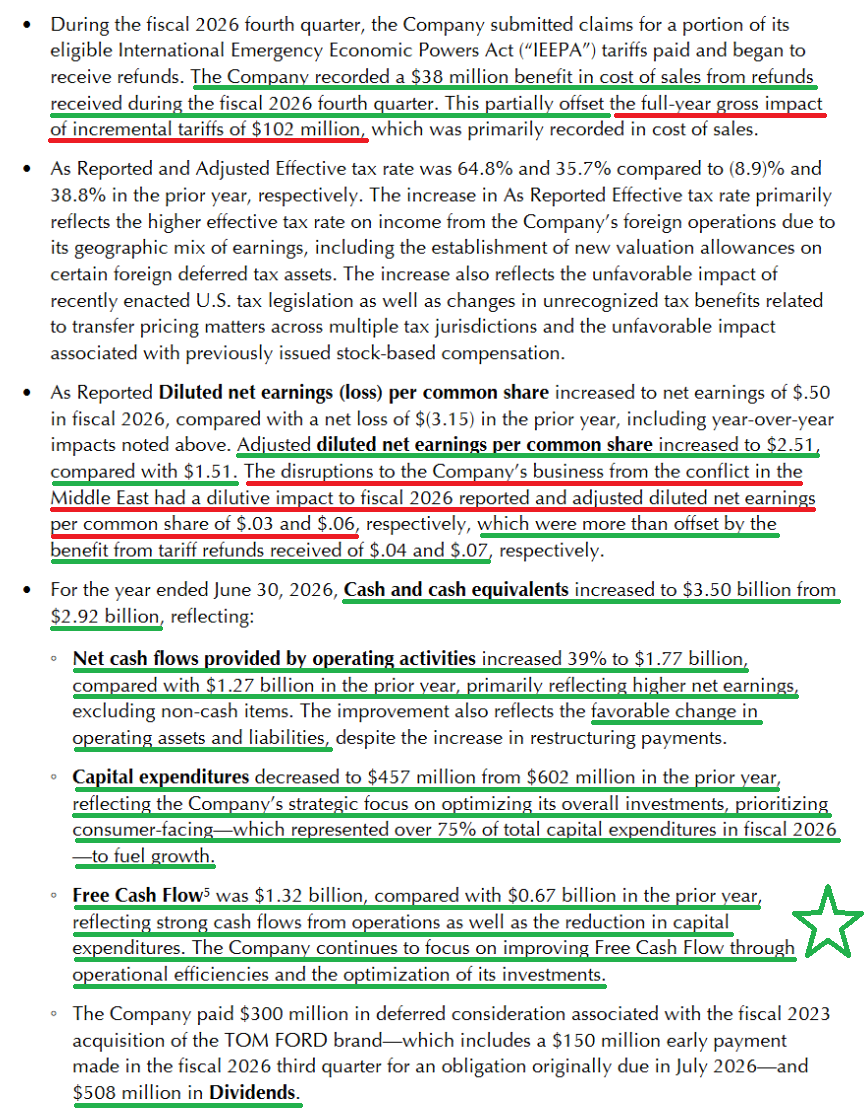
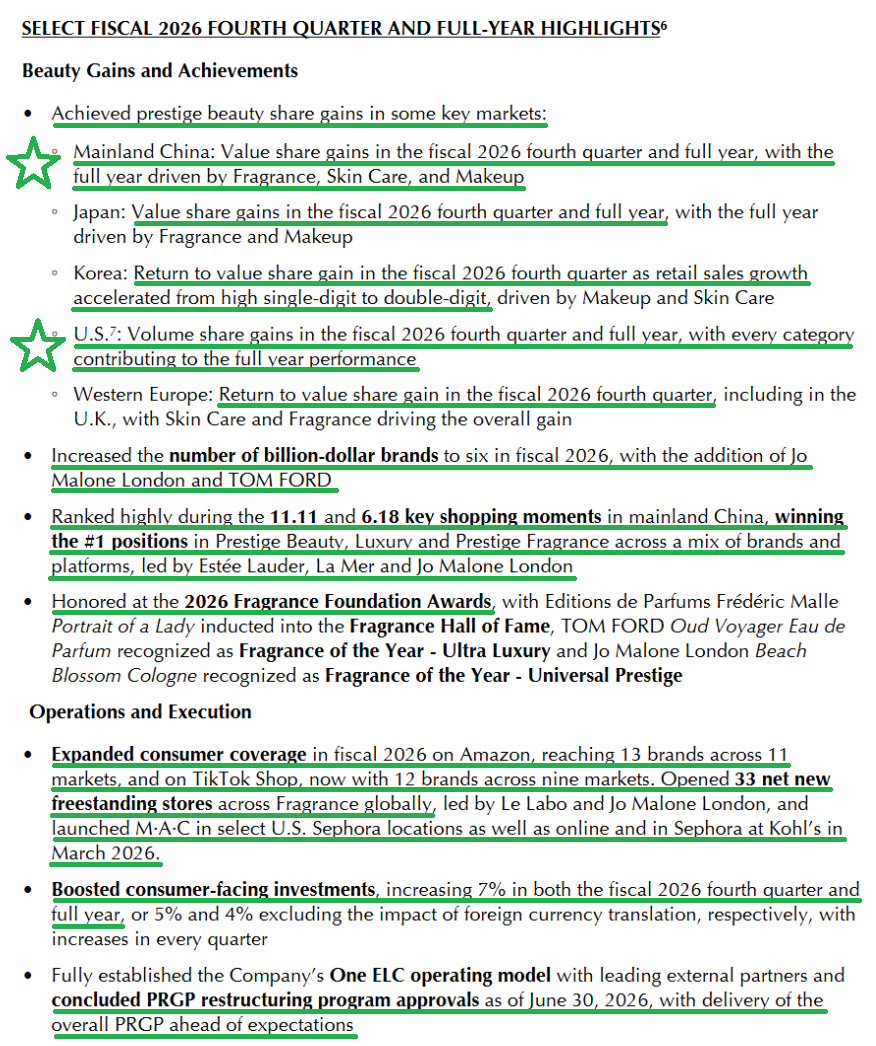
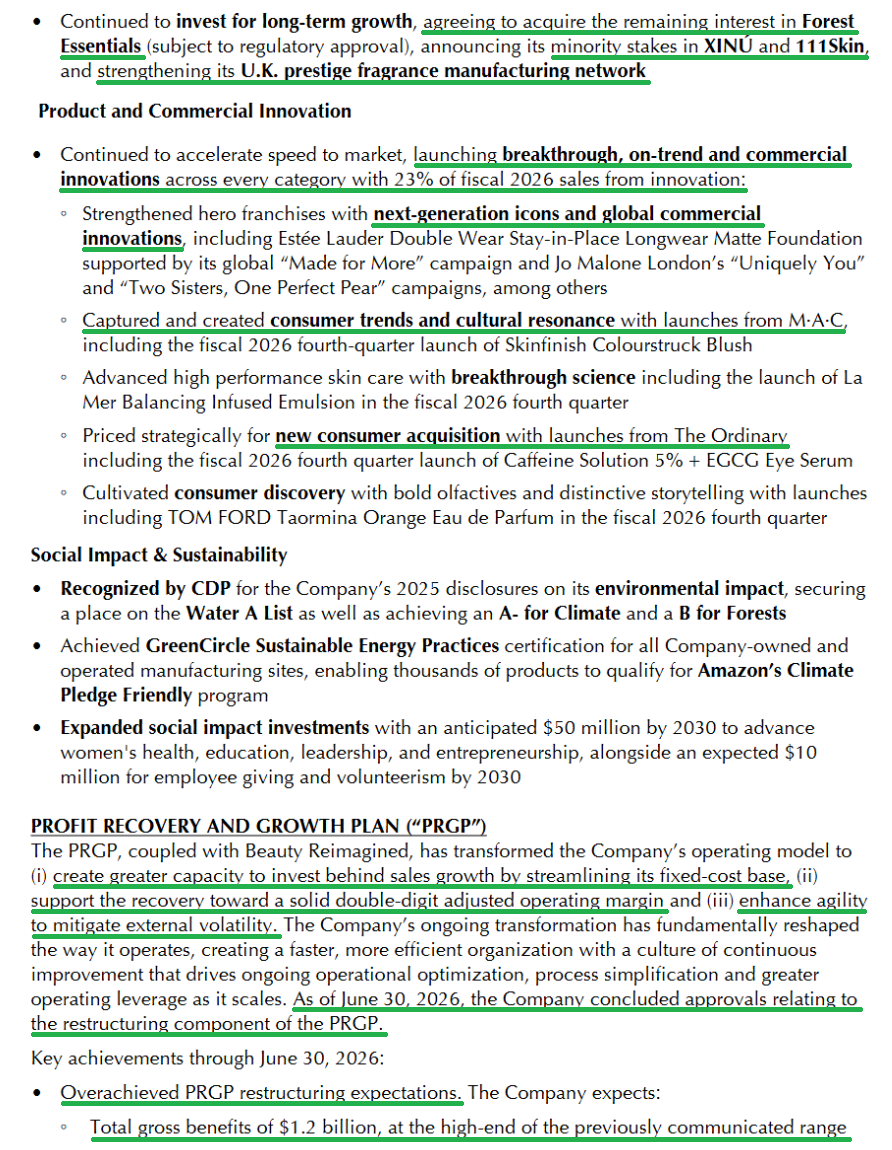
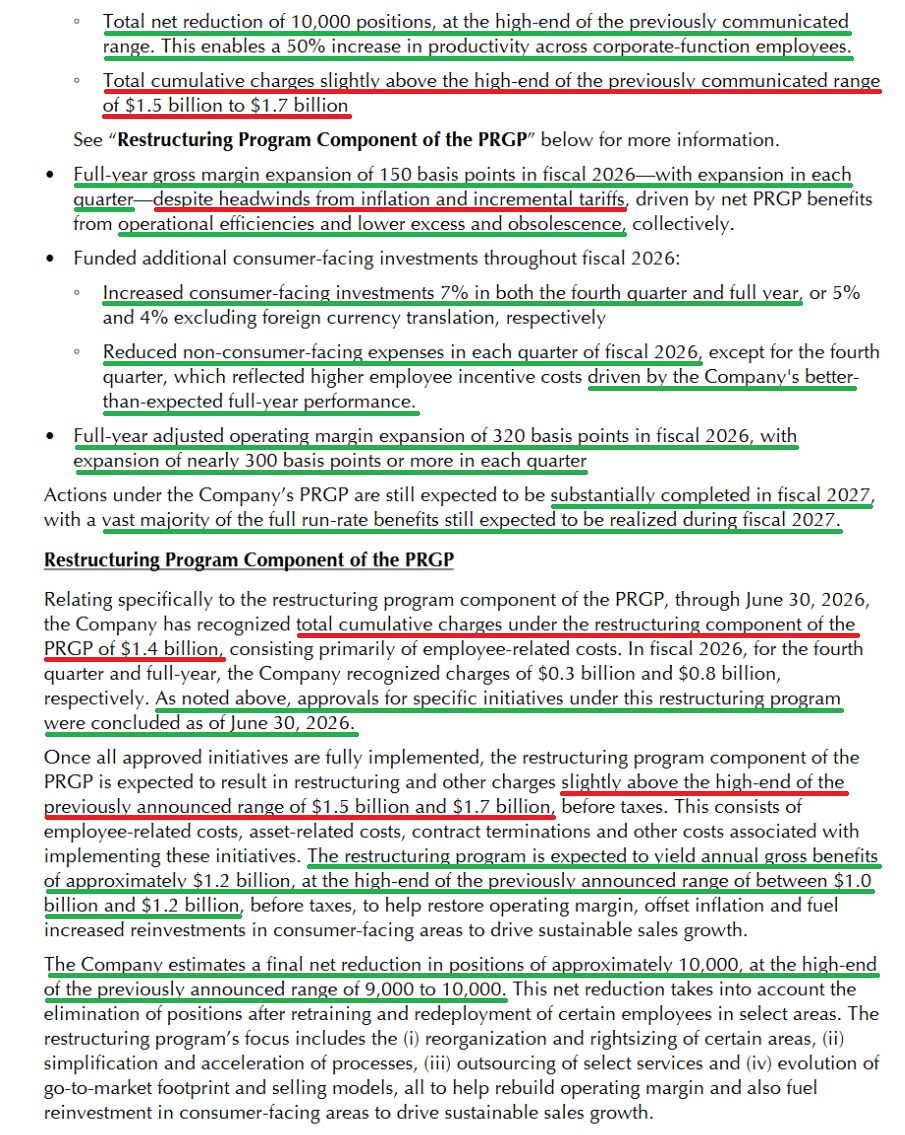
10 Key Points
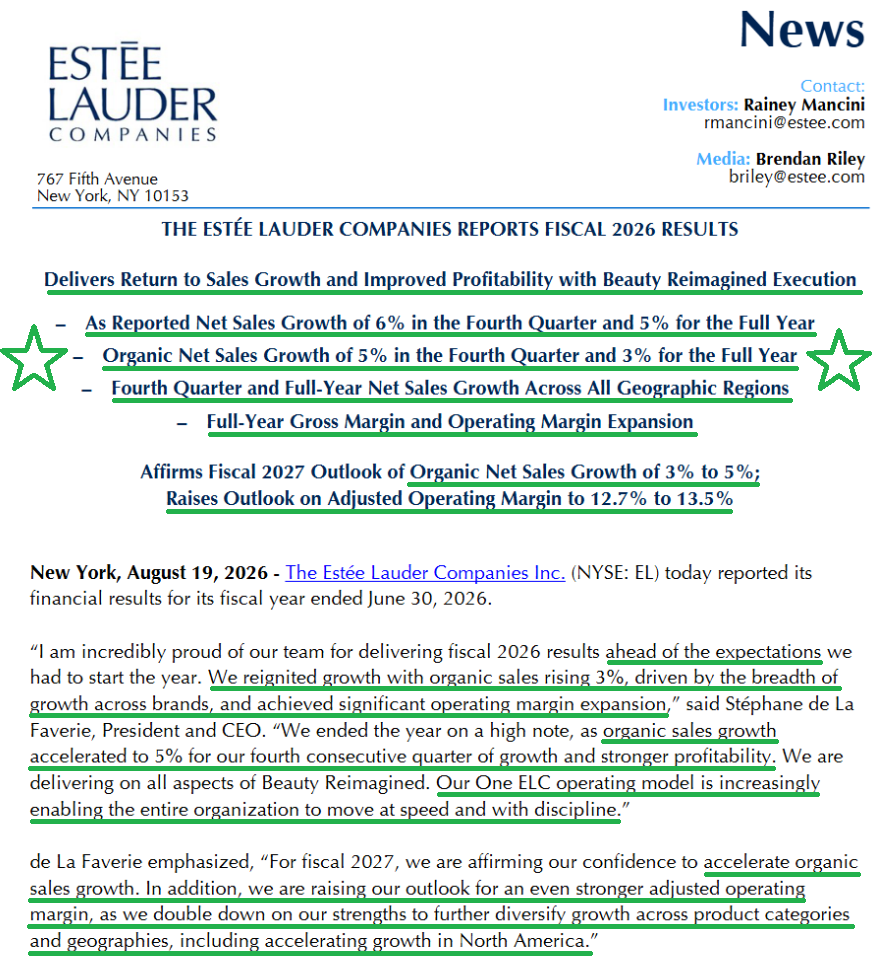
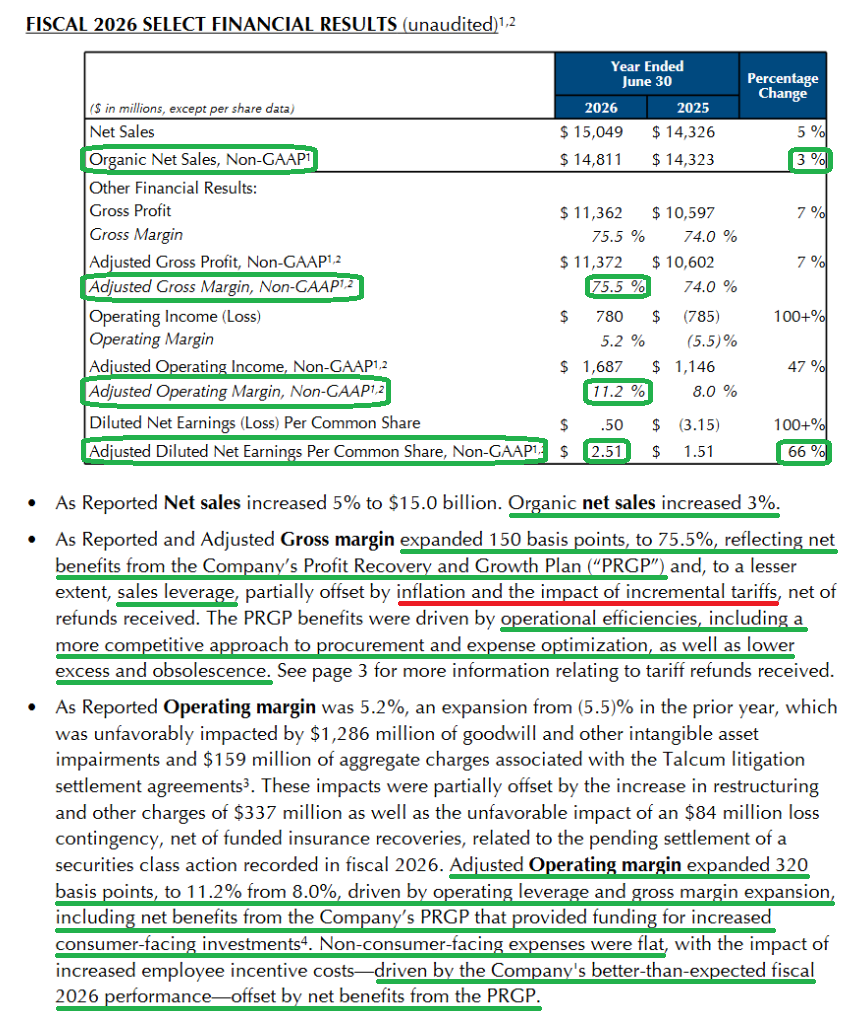
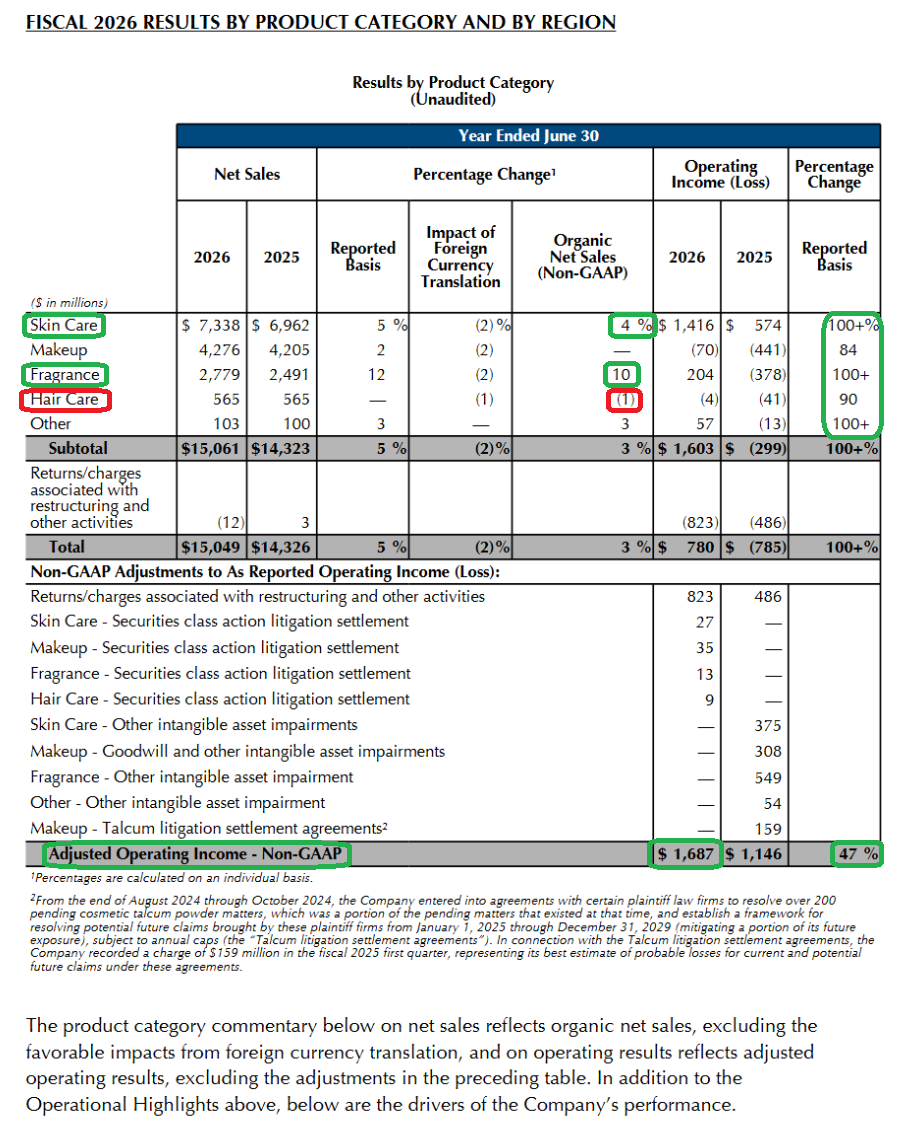
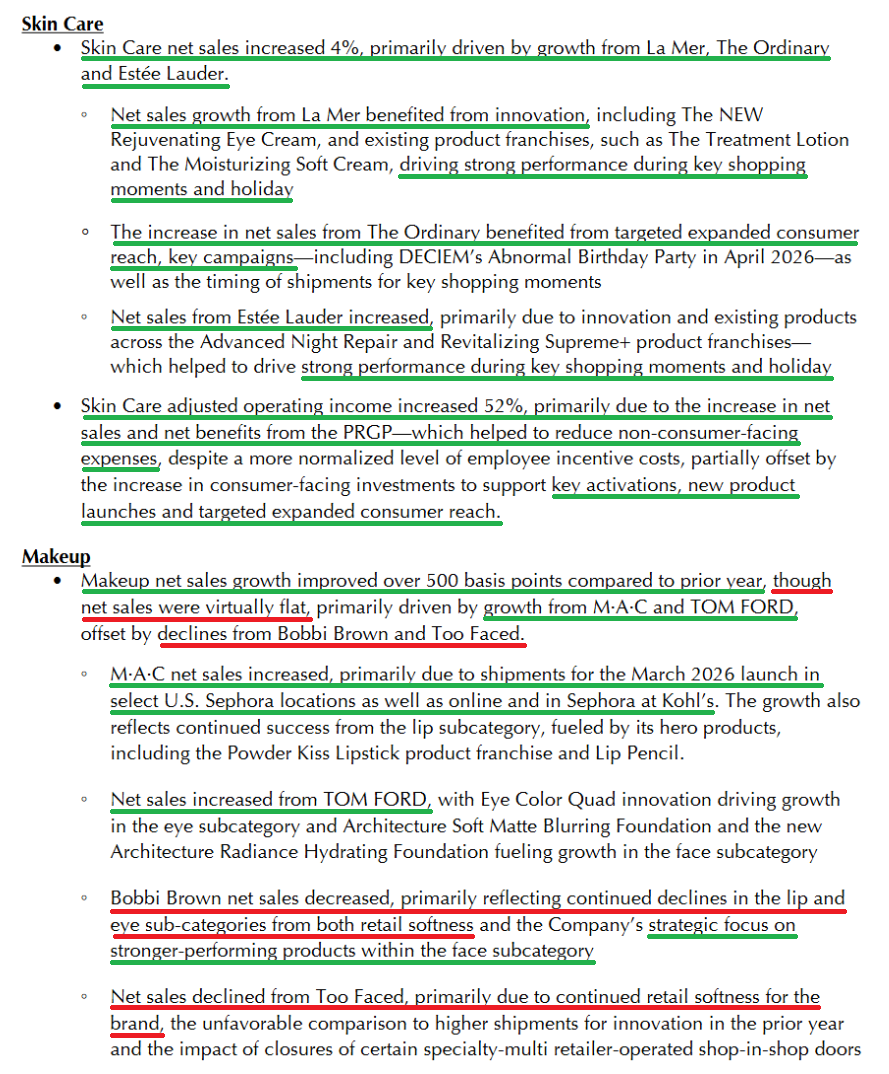
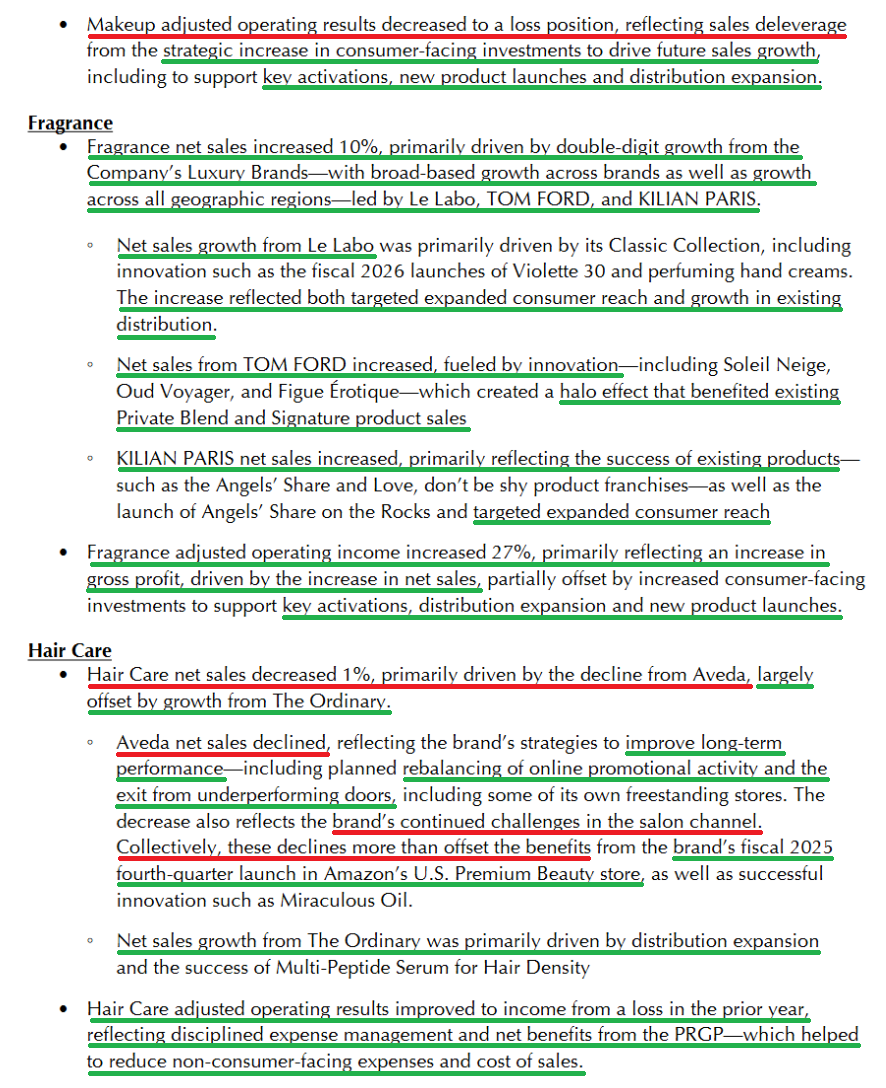
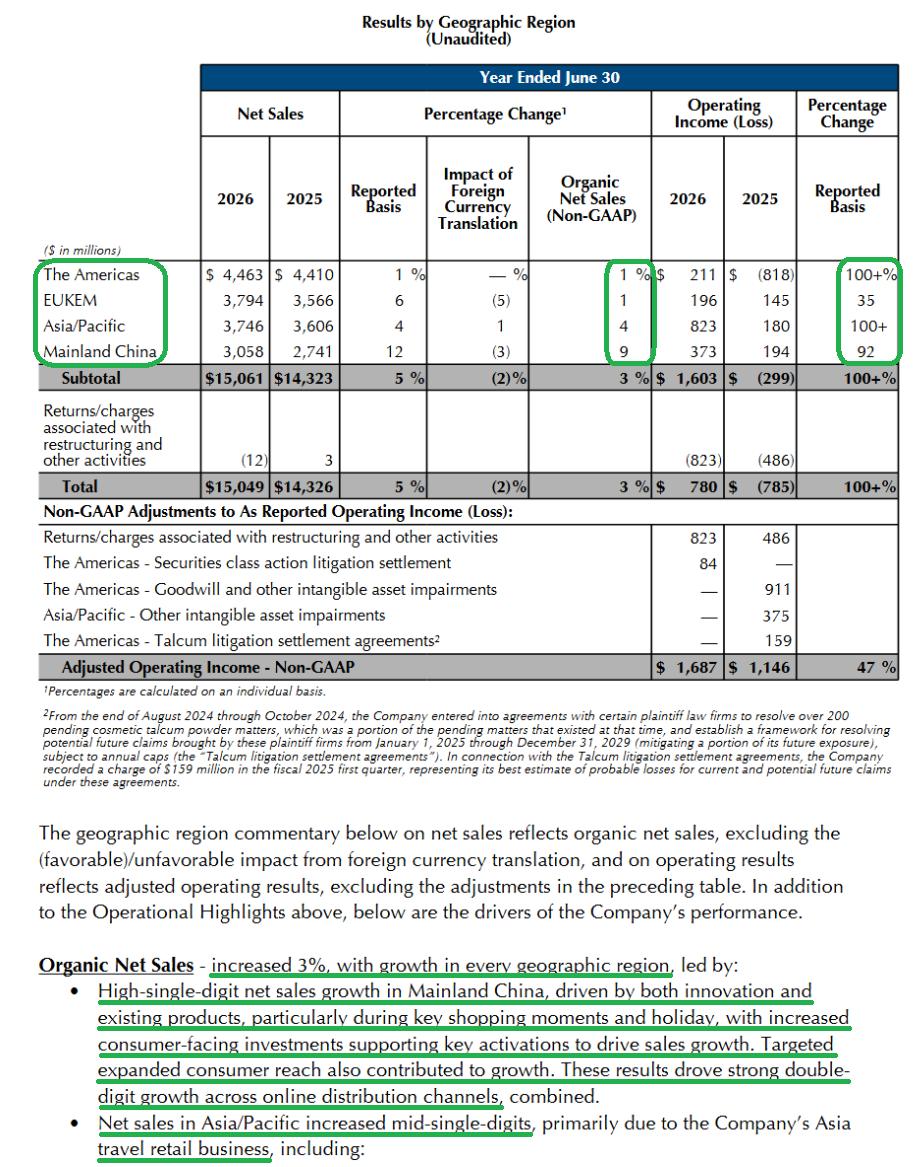
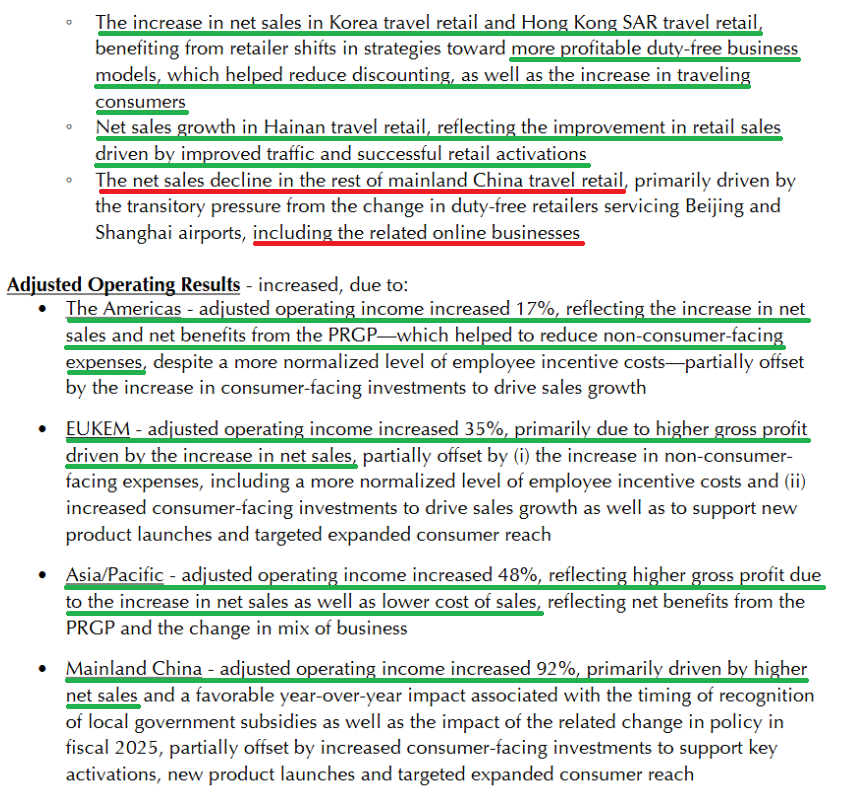
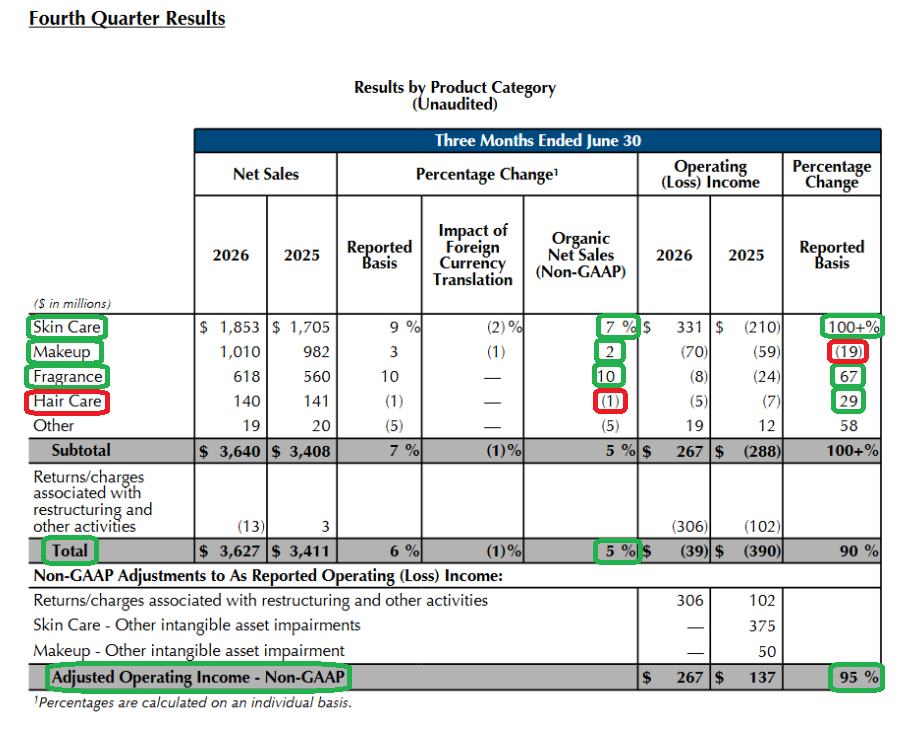
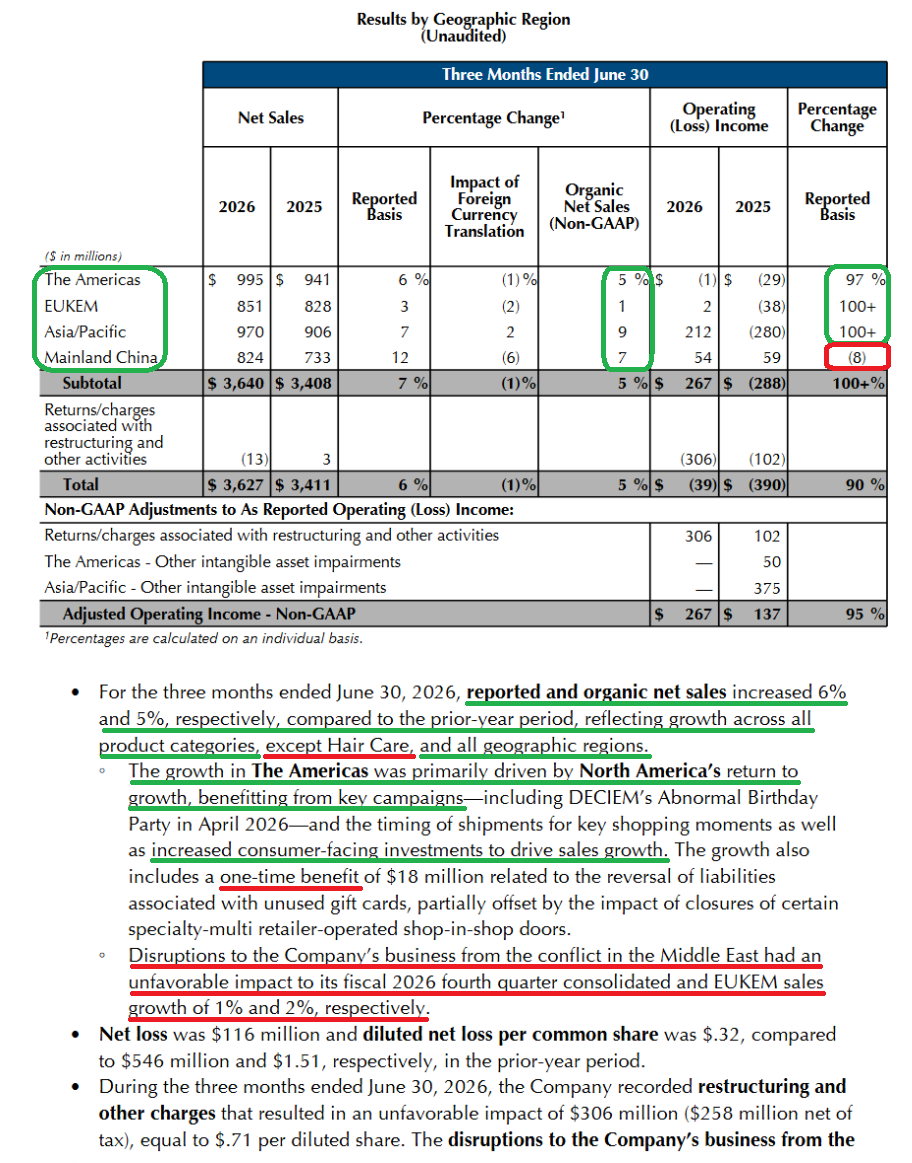
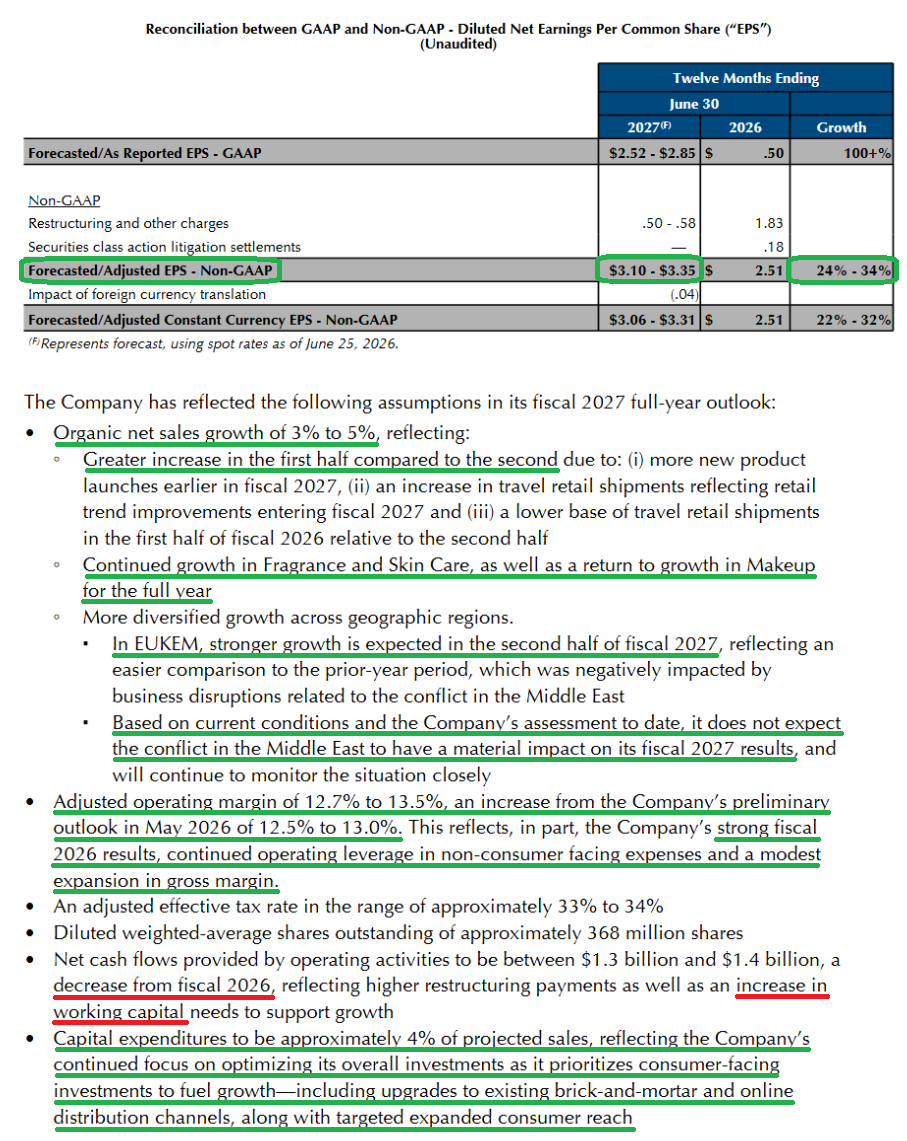
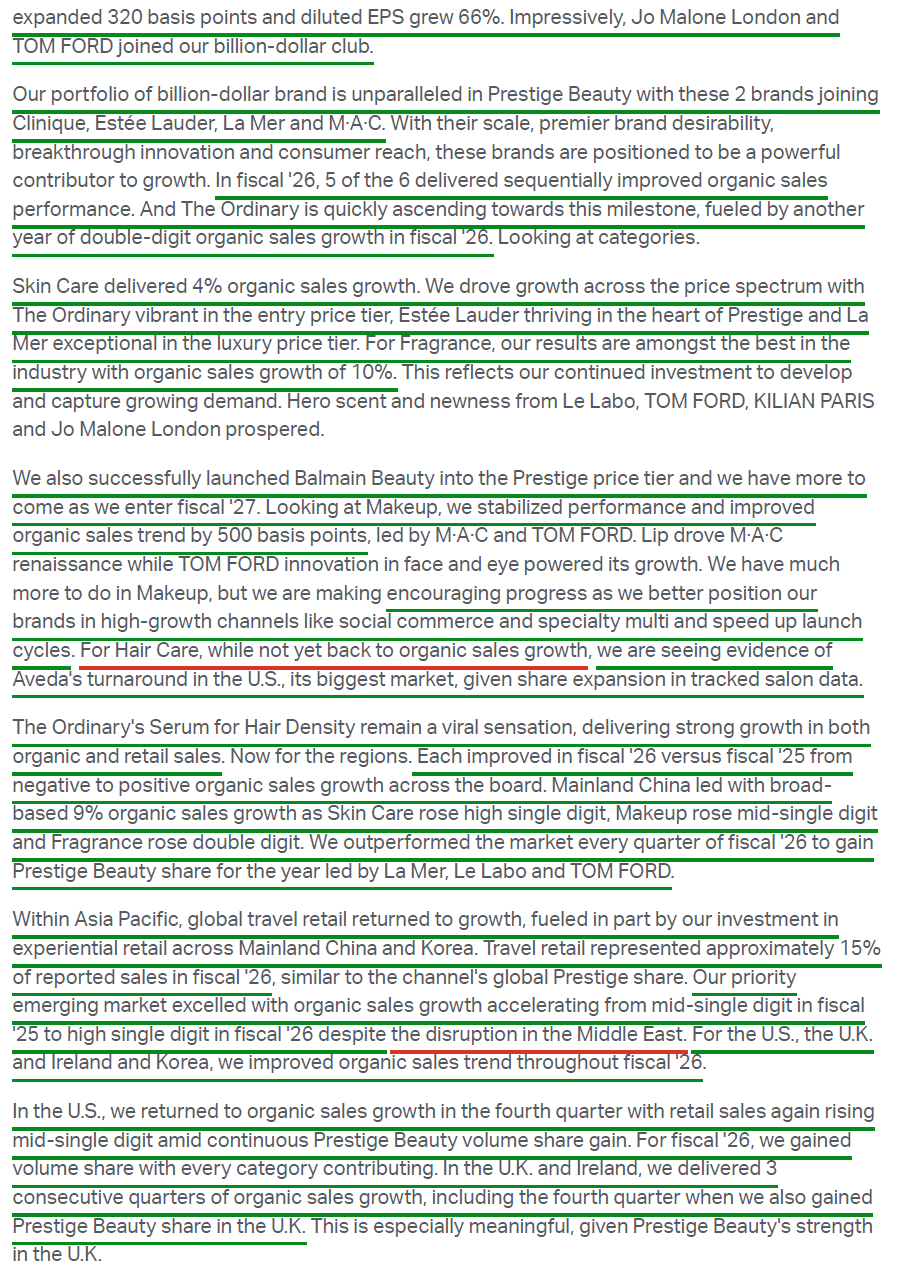
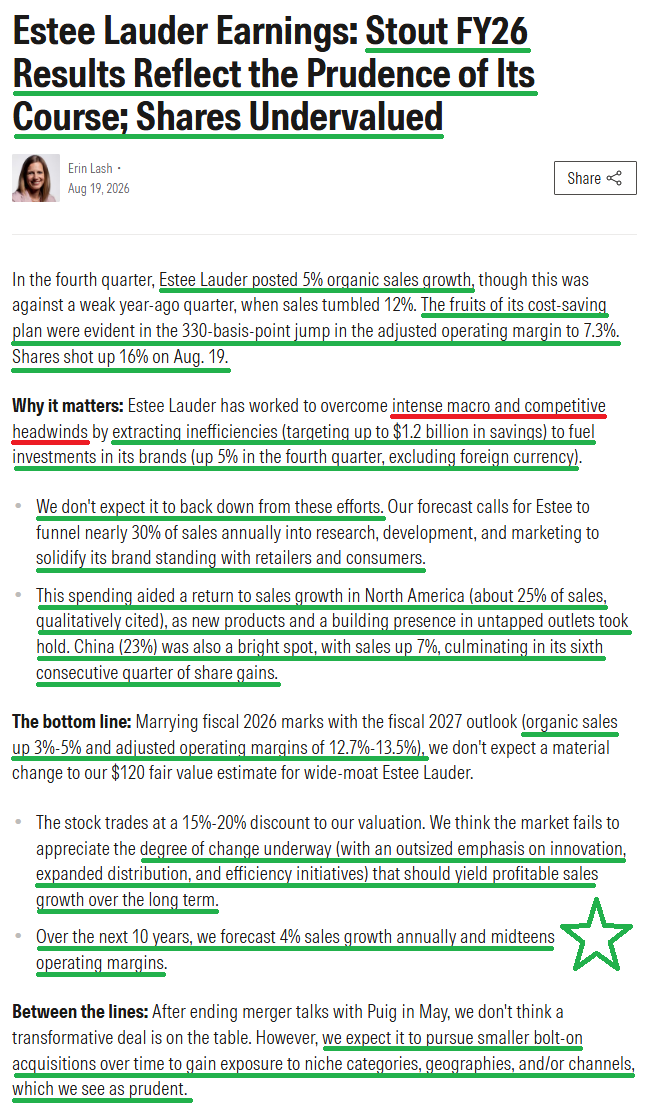
1) Estée Lauder reported Q4 net sales of $3.63B (+6% reported, +5% organic), ahead of consensus at ~$3.54B, marking the strongest organic print of the year and a fourth consecutive quarter of growth. By category, Fragrance led at +10% organic on luxury strength, followed by Skin Care at +7%, Makeup at +2%, and Hair Care at -1%. By region, Asia/Pacific led at +9%, followed by Mainland China at +7%, the Americas at +5%, and EUKEM at +1%. Full-year net sales reached $15.05B (+5% reported, +3% organic), delivering EL’s first year of positive organic growth in four years. Jo Malone London and TOM FORD each crossed the billion-dollar threshold during the year, lifting EL to six billion-dollar brands.
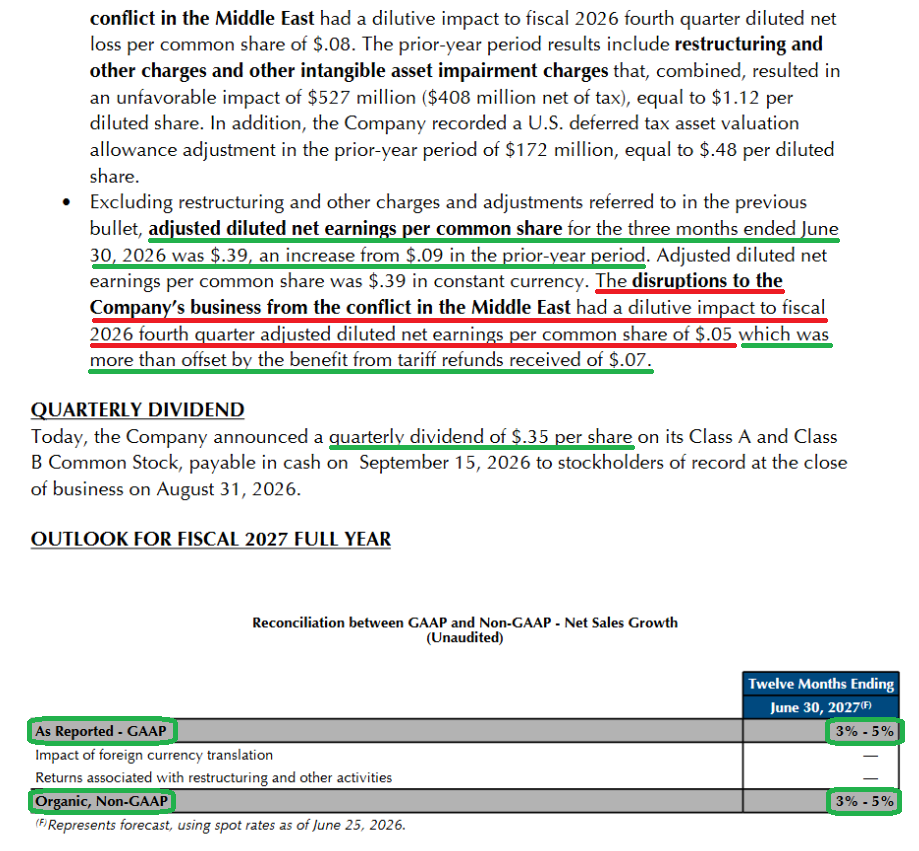
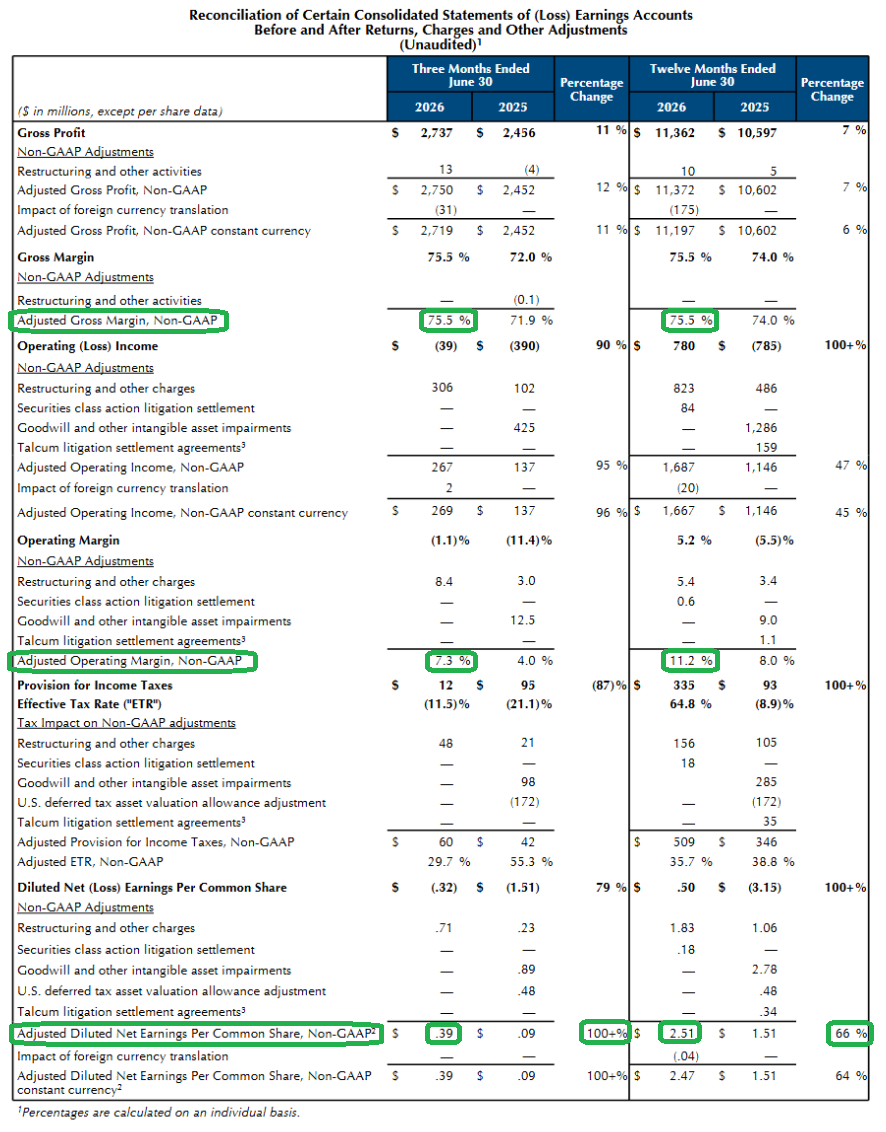
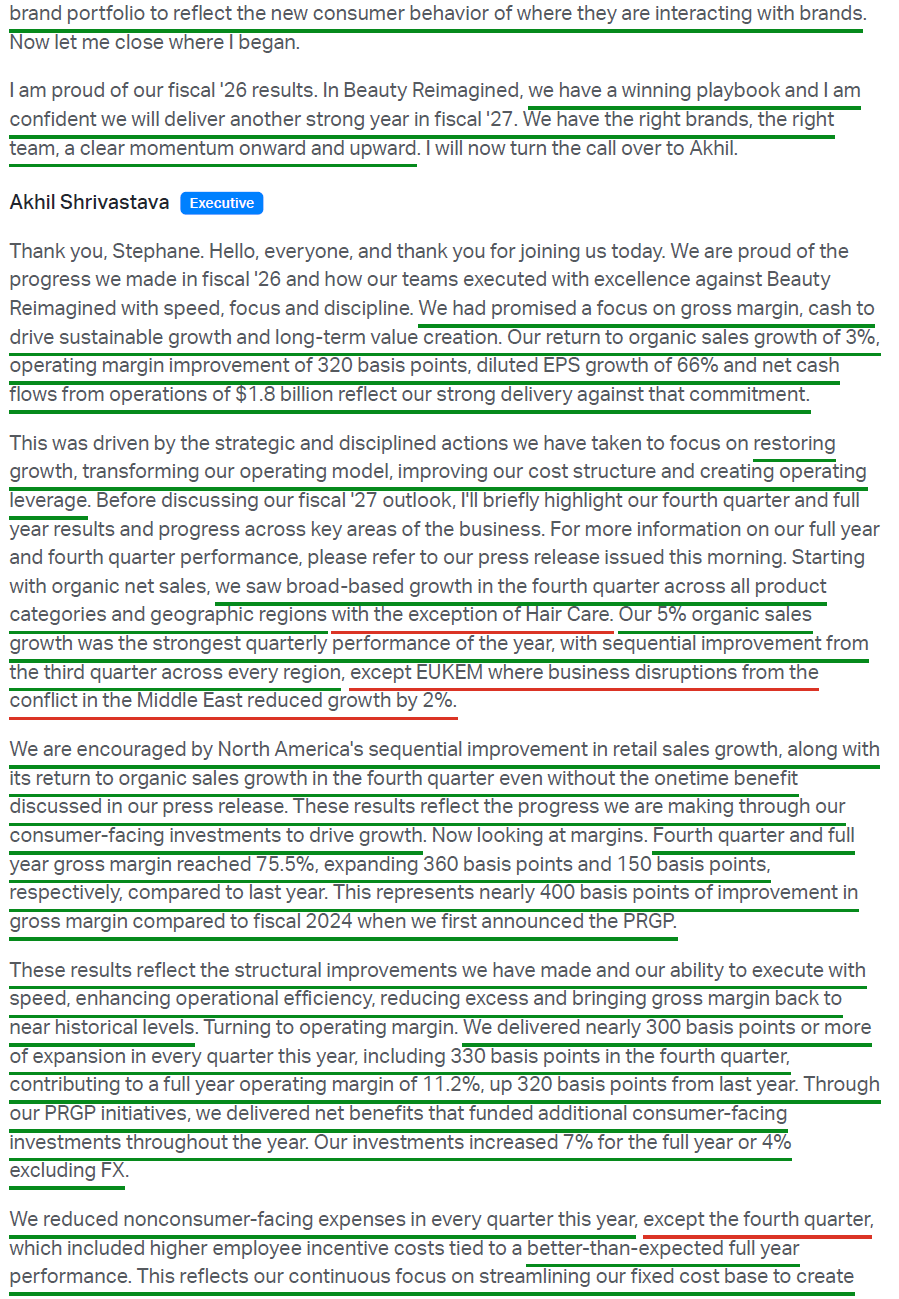
2) Adjusted EPS of $0.39 beat consensus of ~$0.32 and compared to just $0.09 a year ago. For the full year, adjusted EPS reached $2.51, up 66% Y/Y from $1.51. Within the quarter, tariff refunds contributed a $0.07 benefit that more than offset the $0.05 dilutive impact from the conflict in the Middle East.
3) Adjusted gross margin expanded 360 bps Y/Y to 75.5% from 71.9%, lifting full-year adjusted gross margin to 75.5% from 74.0%, or 150 bps of expansion, with gains delivered in every quarter. Expansion was driven by net PRGP benefits, including more competitive procurement, expense optimization, and lower excess and obsolescence, partially offset by inflation and incremental tariffs. EL absorbed $102M of gross incremental tariff costs during the year while still expanding margins, recovering $38M through IEEPA refund claims in Q4. Full-year gross margin now sits ~400 bps above FY24, back near historical levels.
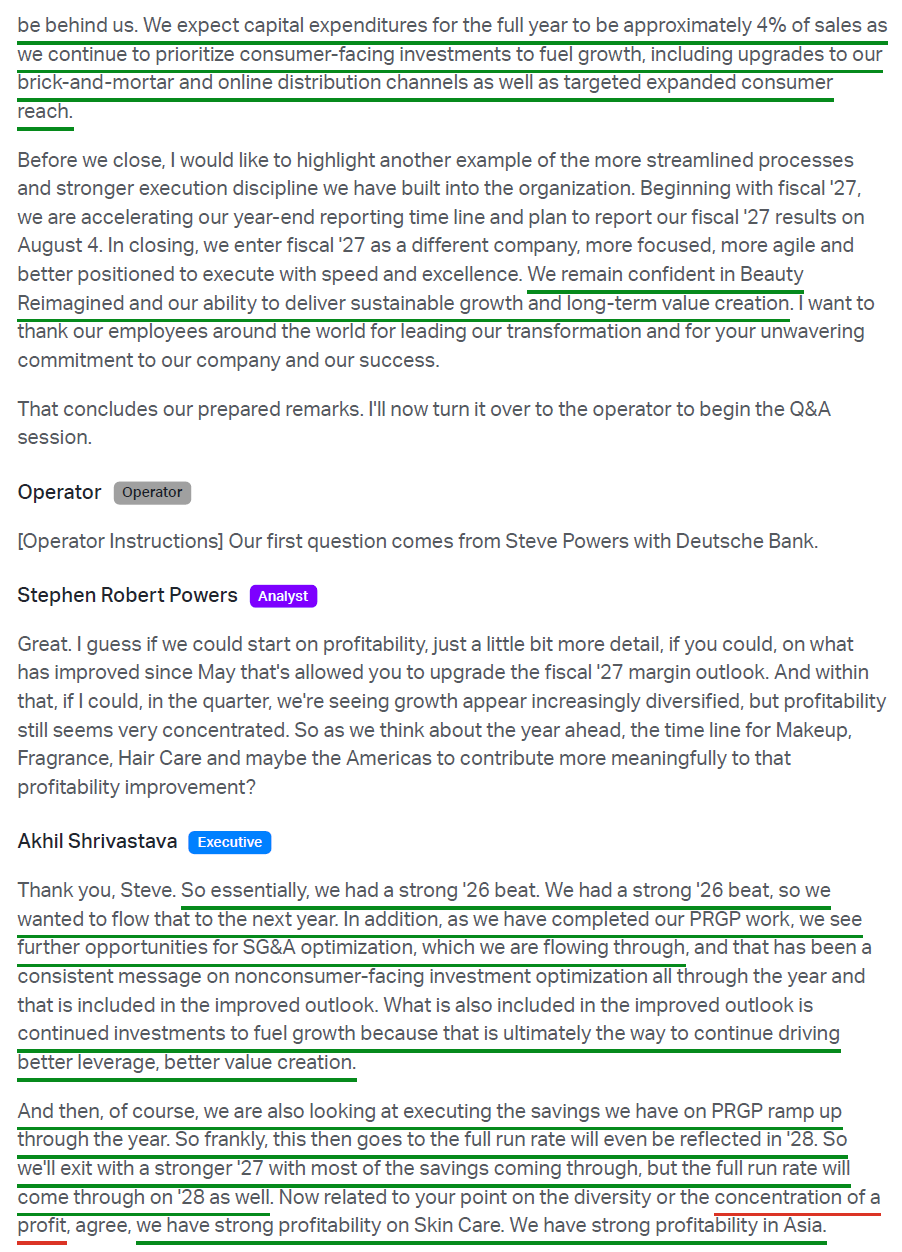
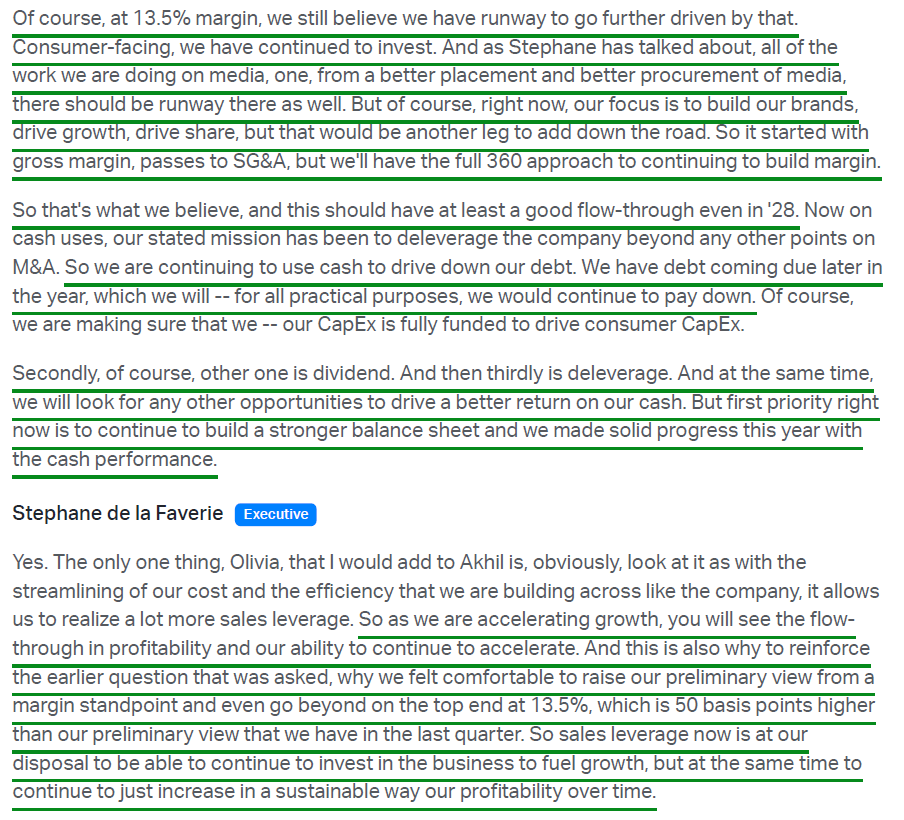
4) Adjusted operating income increased 95% Y/Y to $267M, lifting adjusted operating margin to 7.3% from 4.0%, or 330 bps of expansion, ahead of consensus of ~6.5%. For the full year, adjusted operating income rose 47% to $1.69B, with margins expanding 320 bps to 11.2% from 8.0%, including nearly 300 bps or more of expansion in every quarter. PRGP net benefits funded a 7% full-year increase in consumer-facing investment (4% ex-FX), while non-consumer-facing expenses held flat as higher employee incentive costs tied to the better-than-expected performance were offset by PRGP savings.
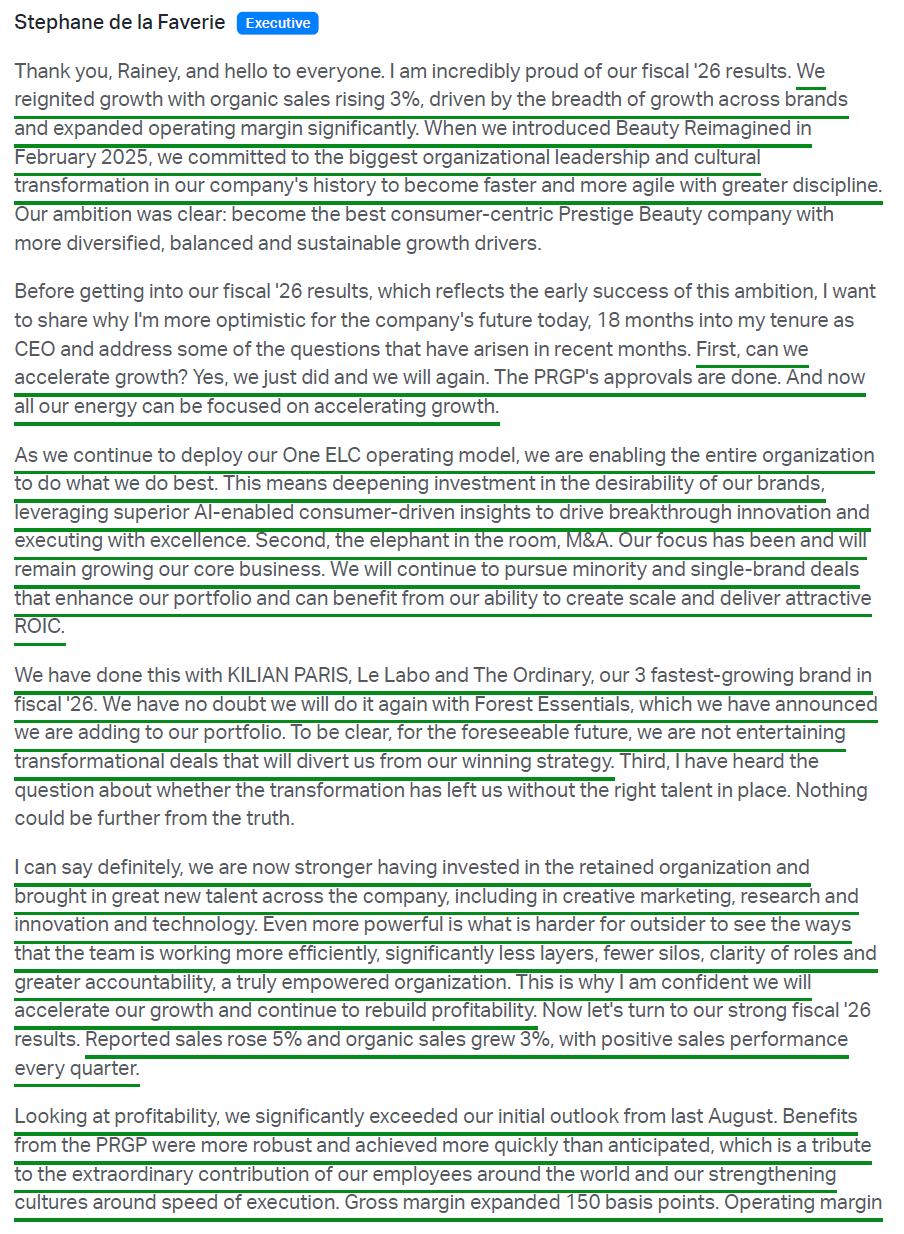
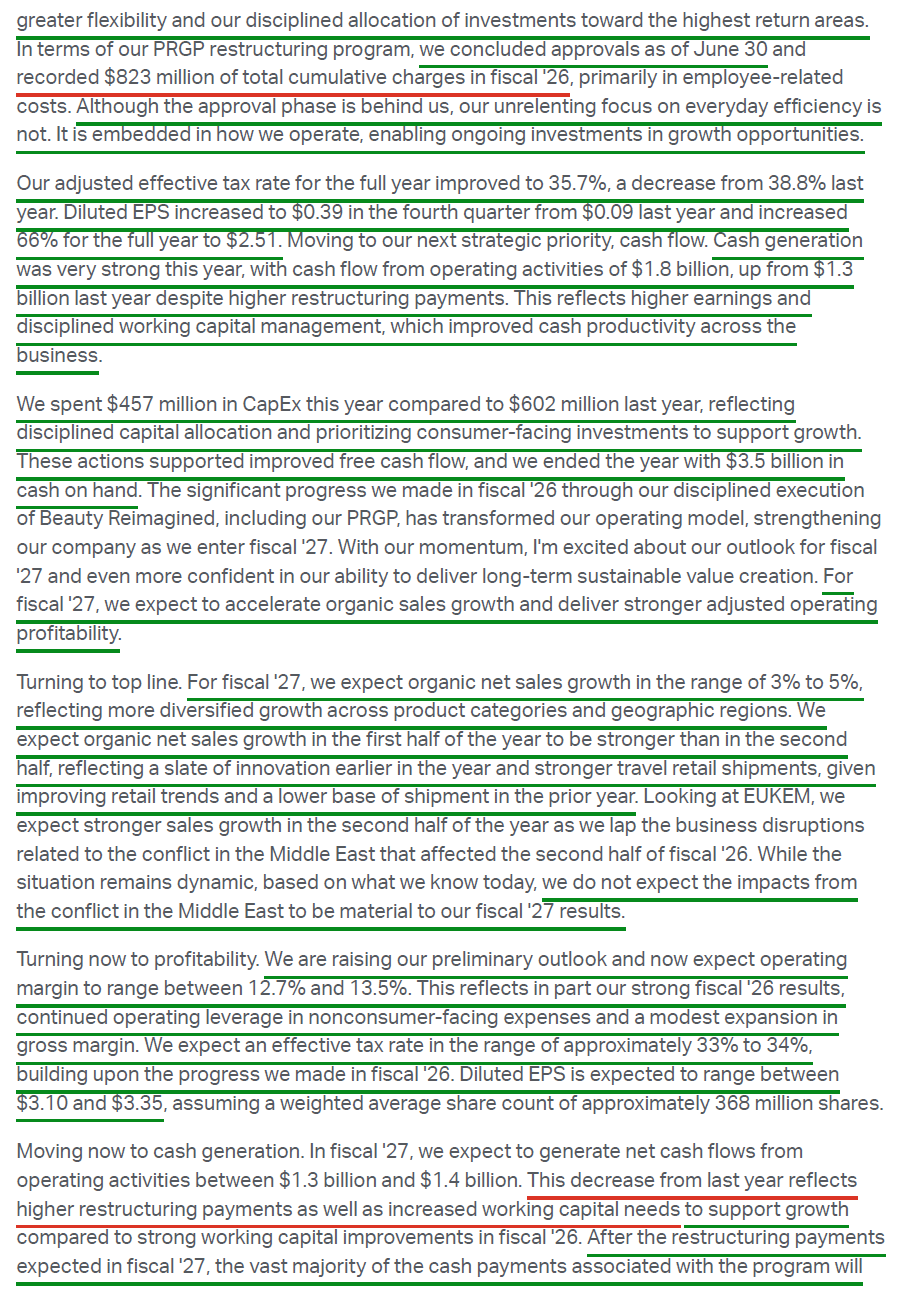
5) EL concluded PRGP restructuring approvals as of June 30, delivering the program ahead of expectations and overachieving across metrics. Total gross benefits are now expected at $1.2B and net position reductions at ~10,000, both at the high end of prior ranges, enabling a 50% increase in productivity across corporate-function employees. Total cumulative charges are expected slightly above the high end of the prior $1.5–$1.7B range, with $823M recorded in FY26. Actions remain expected to be substantially completed in FY27, with the vast majority of full run-rate benefits still to be realized during the year and full annualization in FY28.
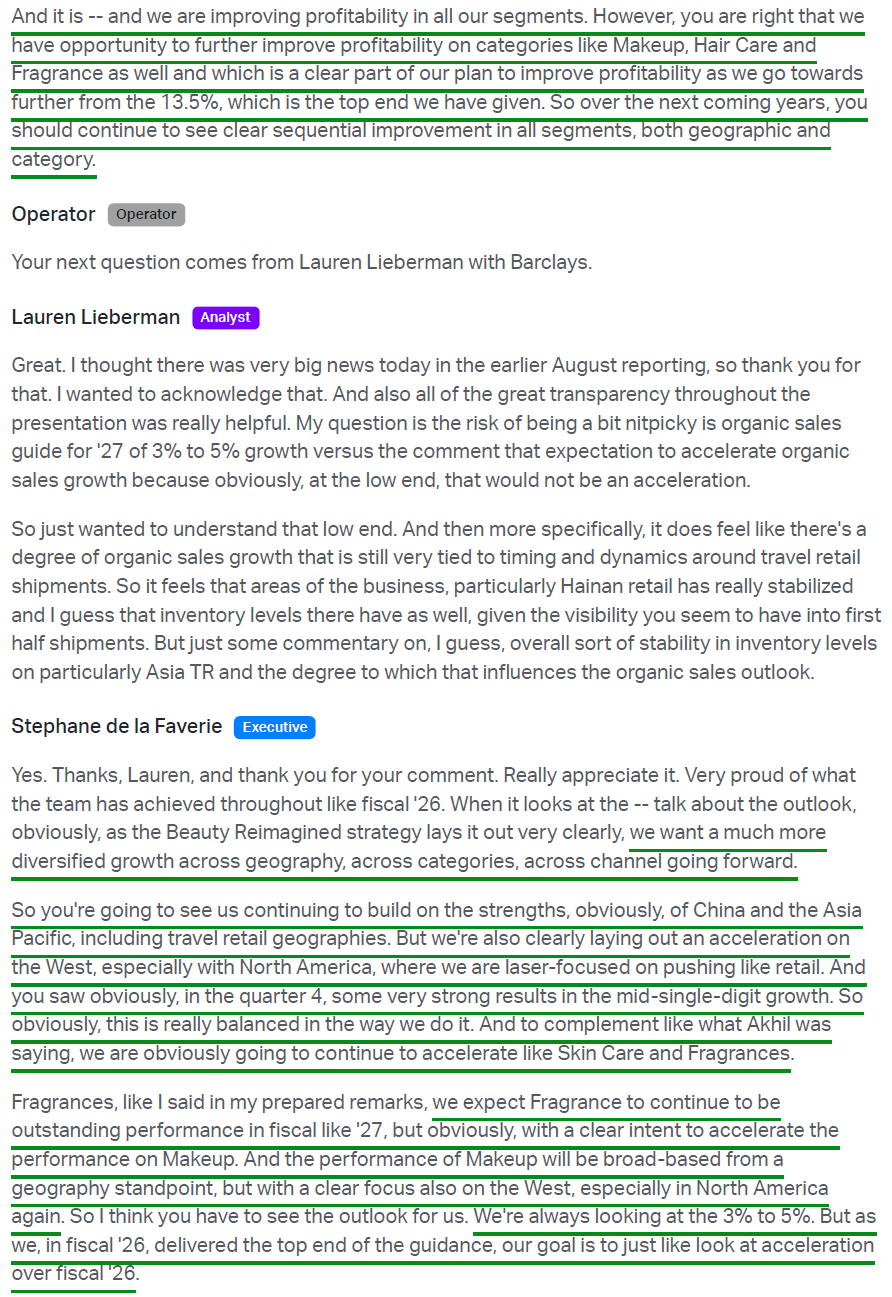
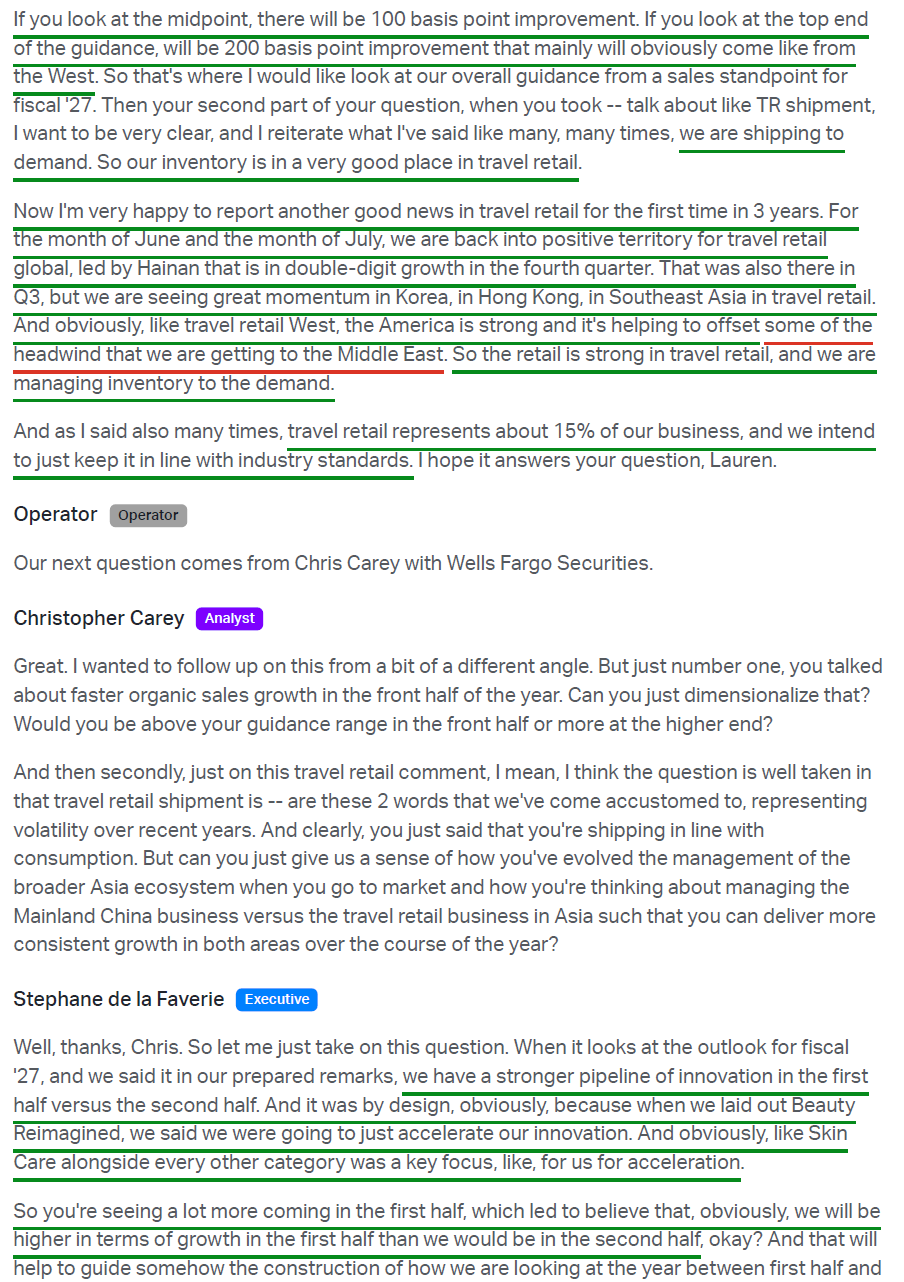
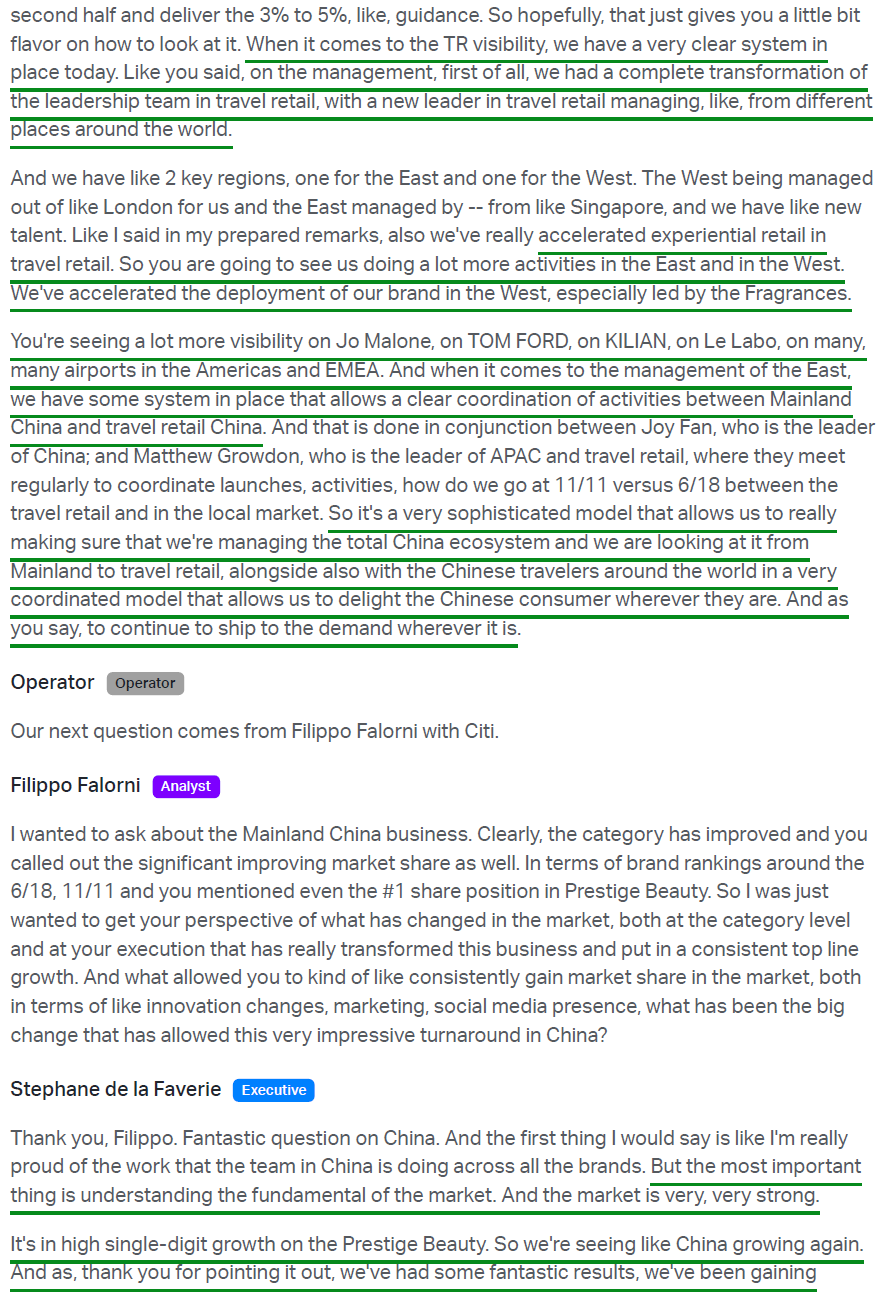
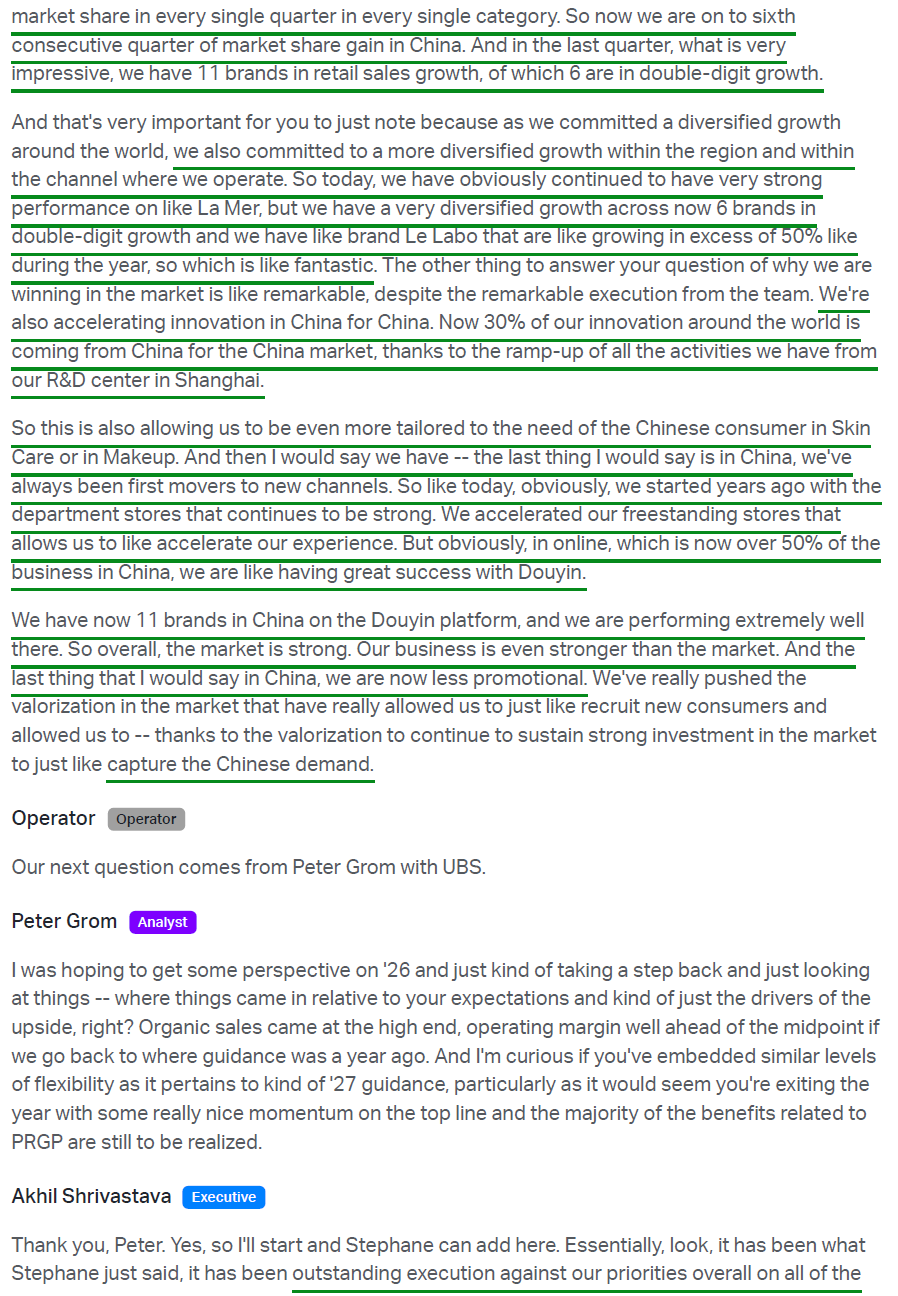
6) Mainland China net sales rose 12% reported to $824M, with organic growth of 7% in the quarter and 9% for the full year, achieving value share gains in both periods led by Fragrance, Skin Care, and Makeup. This marked the sixth consecutive quarter of prestige beauty share gains, with 11 brands growing at retail during the quarter, six at a double-digit pace. Management characterized the underlying market as strong, with high-single-digit prestige beauty growth, while EL grew meaningfully faster. ~30% of global innovation is now developed in China for China, while online has grown to more than 50% of the China business. Separately, Global Travel Retail returned to positive territory in June and July for the first time in three years, led by double-digit growth in Hainan.
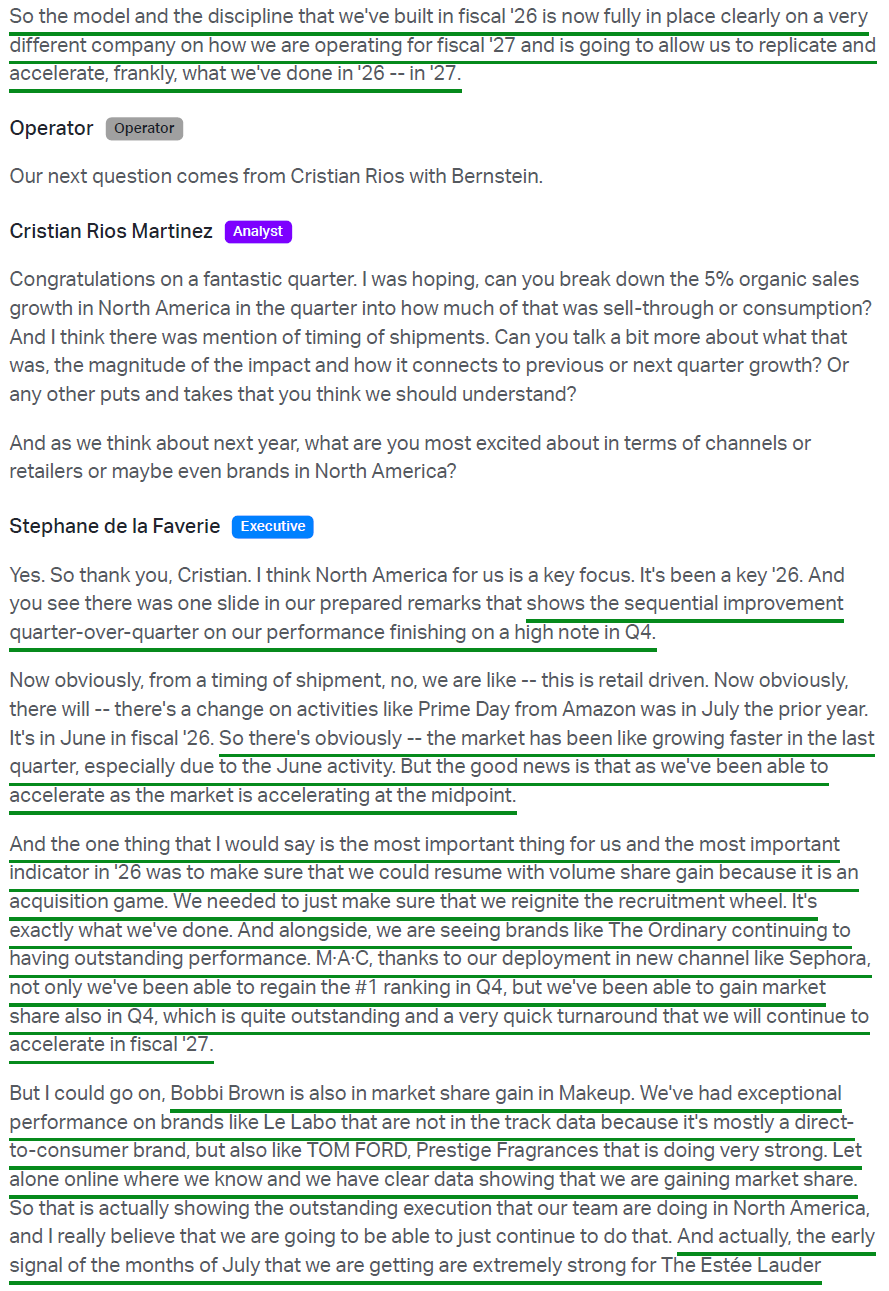
7) The Americas delivered net sales of $995M (+6% reported, +5% organic), driven by North America’s return to organic growth. Results included an $18M one-time benefit from the reversal of unused gift card liabilities, though management confirmed the region grew organically even excluding it. U.S. retail sales again grew mid-single digits amid continued prestige beauty volume share gains, with every category contributing to full-year performance. M·A·C regained the #1 ranking in makeup while also gaining share, driven by its Sephora (LVMUY) rollout. Management made it clear that accelerating North America is the central FY27 priority.
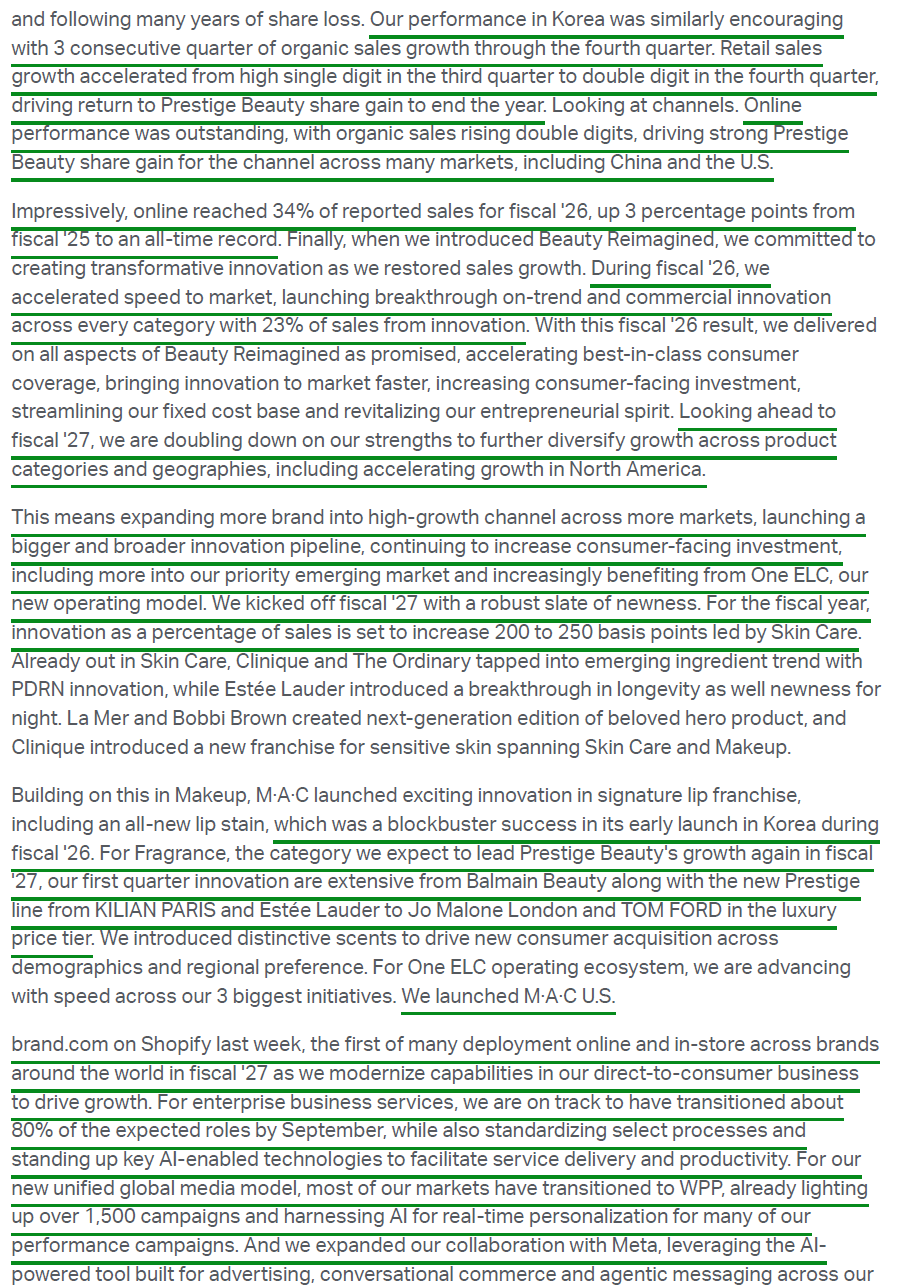
8) Online organic sales grew double digits for the year, driving strong prestige beauty share gains across many markets, including China and the U.S. Online reached a record 34% of reported sales in FY26, up 300 bps Y/Y and an all-time high. Consumer coverage expanded further, with Amazon now spanning 13 brands across 11 markets and TikTok Shop covering 12 brands across nine markets. EL also opened 33 net new freestanding stores across Fragrance globally, launched M·A·C in select U.S. Sephora locations in March, and launched M·A·C’s brand site on Shopify (SHOP) as the first of many DTC deployments planned for FY27.
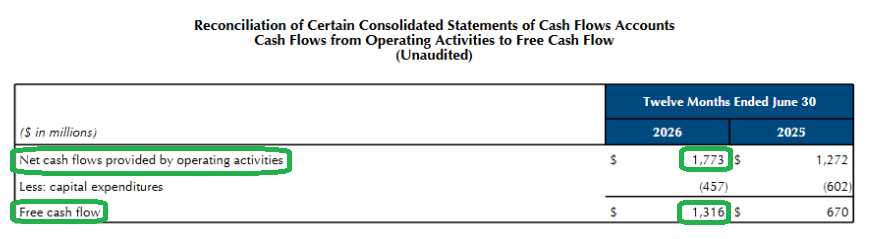
9) Full-year operating cash flow increased 39% to $1.77B from $1.27B on higher net earnings and favorable working capital, achieved despite higher restructuring payments. Capex declined to $457M from $602M as management prioritized consumer-facing investment, which represented more than 75% of total capex. The combination drove free cash flow of $1.32B versus $670M a year ago, nearly doubling Y/Y. EL ended the year with $3.50B in cash, up from $2.92B, after paying $508M in dividends and $300M in deferred consideration tied to the TOM FORD acquisition.
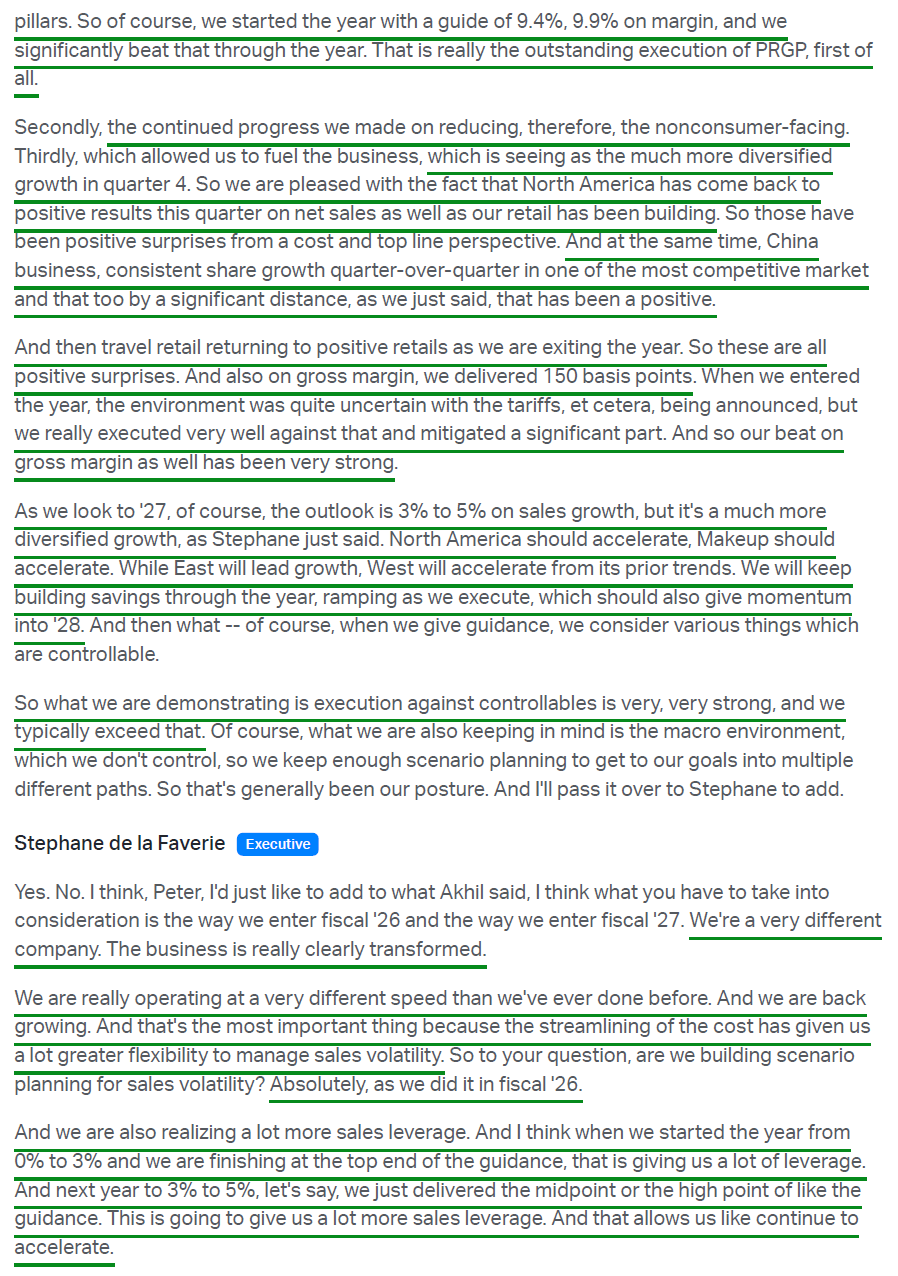
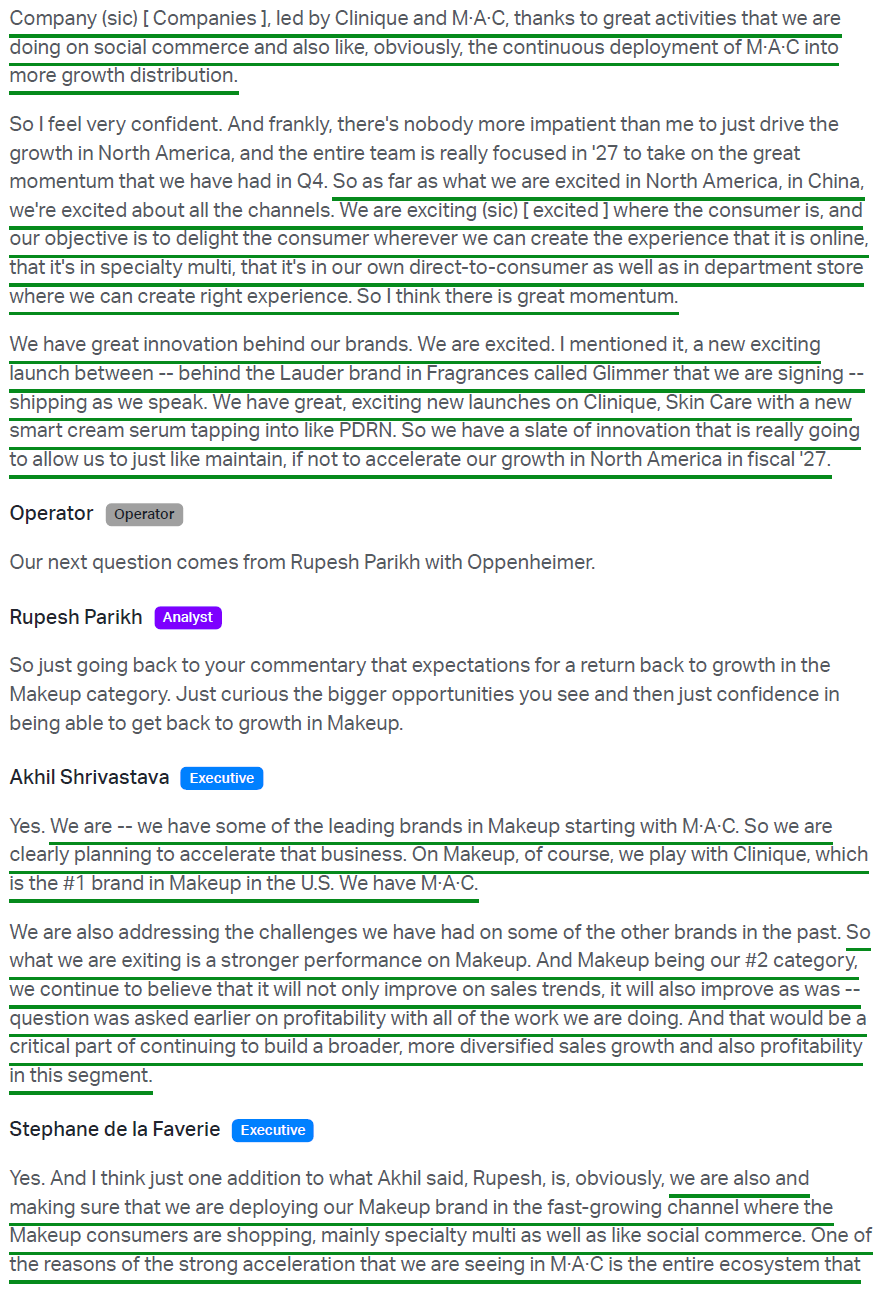
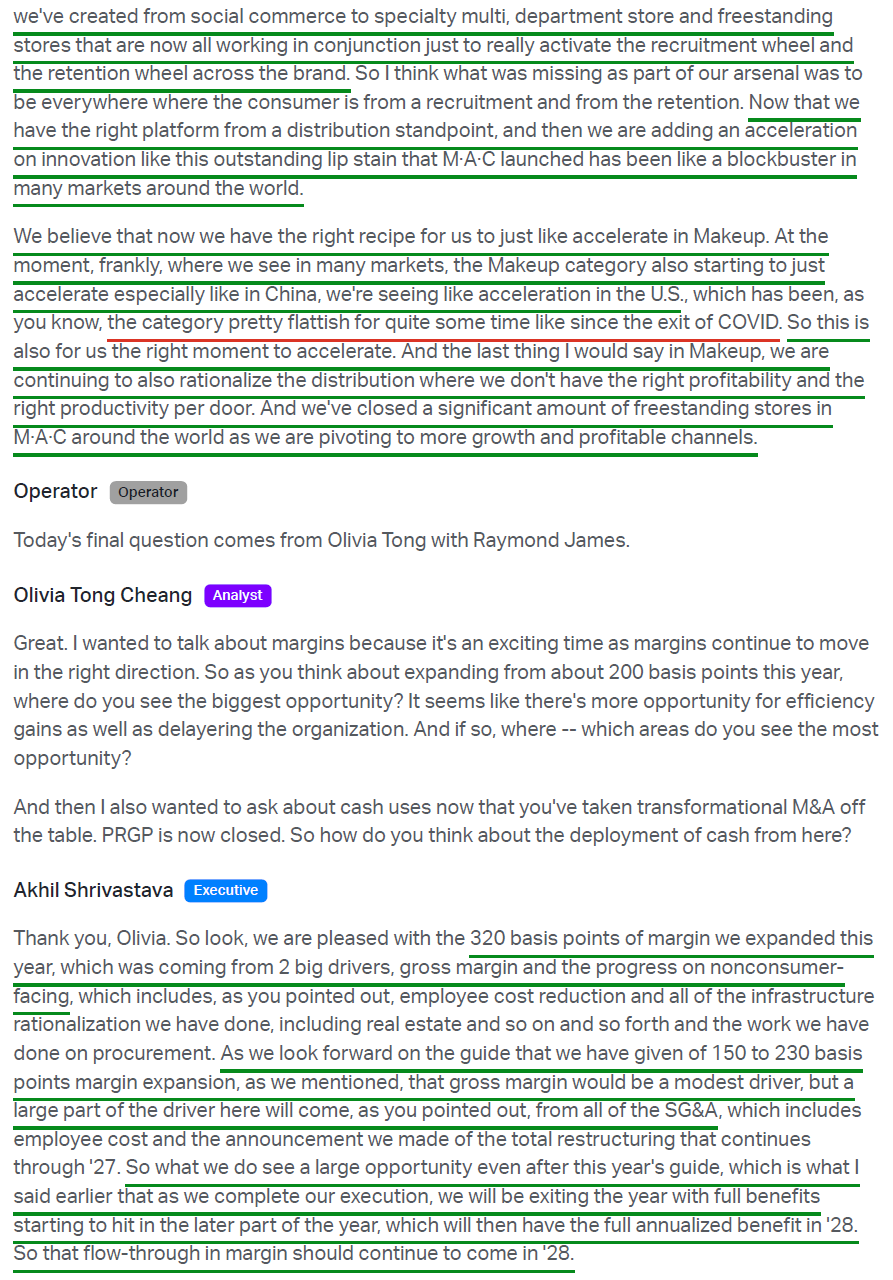
10) EL reiterated FY27 organic net sales growth of 3–5% while raising its adjusted operating margin outlook to 12.7–13.5% from the preliminary May range of 12.5–13.0%, lifting the midpoint to ~13.1% versus consensus of ~12.9%. Adjusted EPS is guided to $3.10–$3.35, representing 24–34% growth versus consensus of ~$3.18. Management expects first-half growth to outpace the second half on earlier product launches, increased travel retail shipments, and a lower first-half base in FY26. By category, Fragrance and Skin Care continue growing, with Makeup returning to growth after coming in flat in FY26. By region, growth is more diversified, with North America accelerating and EUKEM stronger in the second half against an easier Middle East comp.
Earnings Call Highlights
Morningstar Analyst Note
General Market
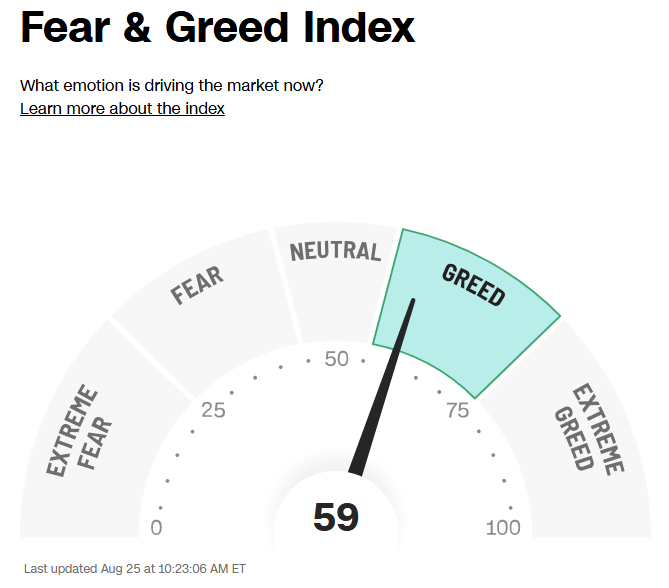
The CNN (WBD) “Fear and Greed Index” ticked up to 59 this week from 54 last week. You can learn how this indicator is calculated and how it works here: (Video Explanation)
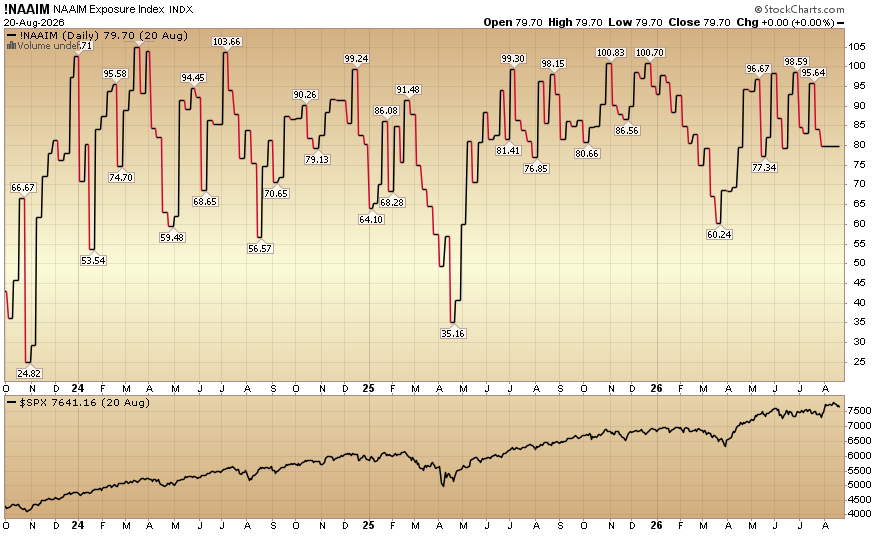
The NAAIM (National Association of Active Investment Managers Index) (Video Explanation) held steady at 79.70% equity exposure this week.
Our podcast|videocast will be out sometime today. We have a lot of great data to cover this week. Each week, we have a segment called “Ask Me Anything (AMA)” where we answer questions sent in by our audience. If you have a question for this week’s episode, please send it in at the contact form here.
Comments
Log in or sign up to join the conversation.