


It’s time for a midweek precious metals update, which I’m publishing a day earlier than usual to cover today’s exciting price action. Gold, silver, and mining stocks have broken out of the triangle pattern I’ve been highlighting—one that many investors feared would resolve to the downside.
While this is a very encouraging development and a likely sign that the correction since January has come to an end, further confirmation is still needed before making that call, which I’ll cover in today’s important update.
Today was an unusual day in the financial markets because several relationships that had been in place since the start of the Iran war have shifted, which is a sign of potentially big changes. Most notably, precious metals were up significantly on a day when energy prices, the U.S. dollar, Treasury yields, and Fed interest rate expectations also rose sharply.
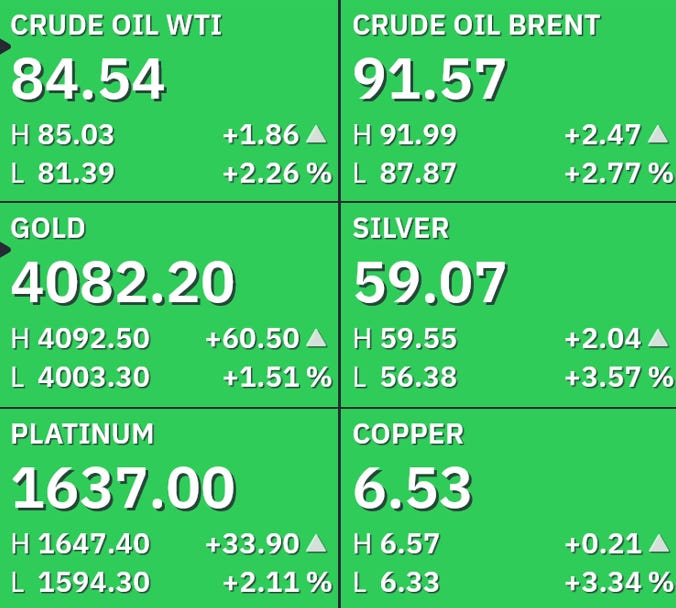
Since the start of the Iran war in late February, precious metals have been pummeled by surging energy prices, as that drove higher inflation expectations, which in turn pushed up interest rate expectations, something that often puts pressure on non-yielding assets like precious metals (as I explained here).
In addition, that combination of higher energy prices, inflation expectations, and interest rate expectations has pushed the U.S. dollar higher, which has also added downward pressure on precious metals, as the dollar and precious metals generally have an inverse relationship.
The continued rise in energy prices, driven by the sharp recent escalation of the war with Iran, has pushed expectations for 2026 Fed rate hikes over the past few days from 52% to 61%:
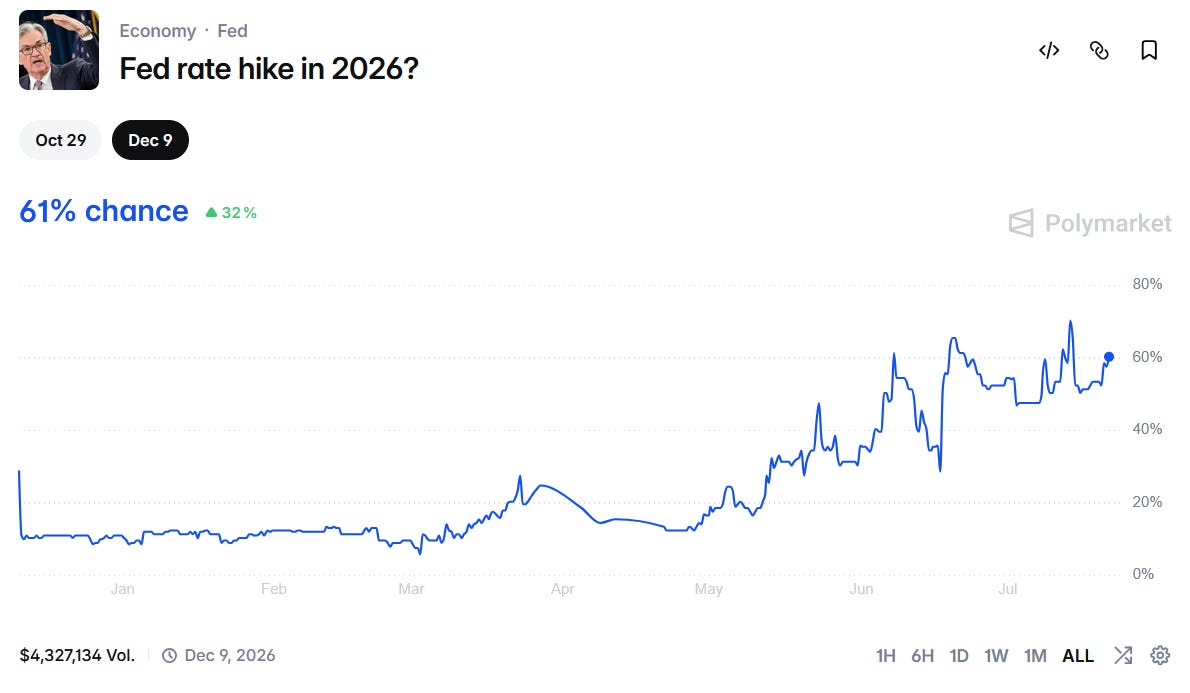
So, against that backdrop of surging energy prices, rising inflation expectations, higher Fed rate expectations, and climbing Treasury yields (with the 30-year yield just hitting a nearly three-year high of 5.13%), it’s very encouraging to see precious metals stage a meaningful rebound and technical breakout in the face of it.
That may be a sign they are ready to tune out the negativity and continue their secular bull market, which I believe remains very much intact despite the recent challenges.
Also, I want to point out that during past secular commodities bull markets, such as the 1970s and the 2000s, energy prices and precious metals rose in tandem while bond yields surged, as I explained in this report. I believe we are heading into a similar environment, so it wouldn’t be too surprising to see them move higher together going forward.
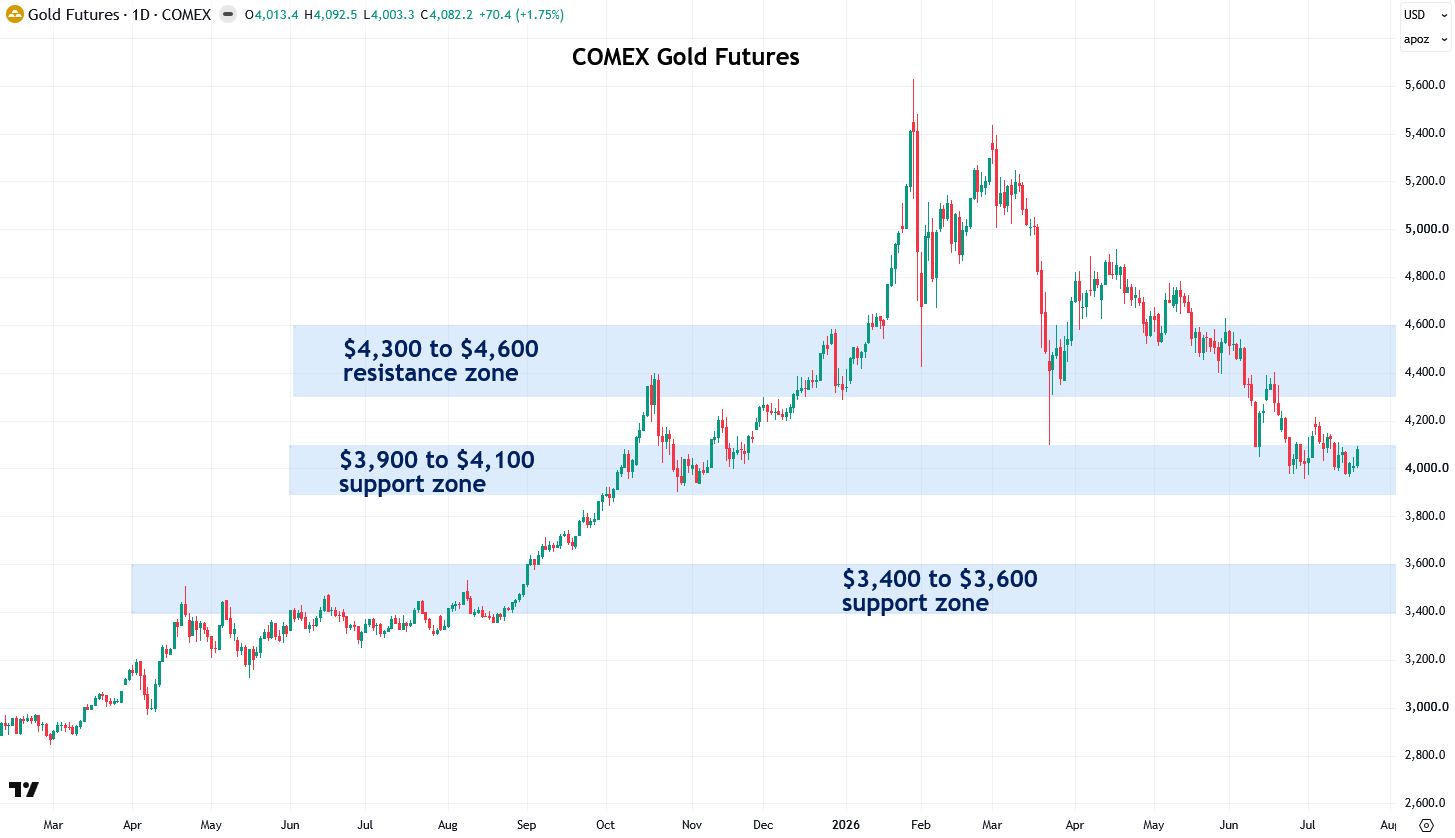
Now let’s take a look at where precious metals stand, starting with gold, which leads the overall complex. Gold rose approximately $70 today, or 1.75%, rebounding off its $3,900 to $4,100 support zone, which was established by the lows in October and November 2025.
Next, I want to see gold fully exit the $3,900 to $4,100 zone with a solid close above $4,100 (it’s currently just below that at $4,086 in COMEX futures). After that, the next hurdle is the $4,300 to $4,600 resistance zone. A decisive break above that would signal that the recent weakness has run its course. This resistance was established over a nine-month period by the highs and lows from October through June.
To learn more about support and resistance zones, I recommend reading my two-part tutorial (Part 1 and Part 2).
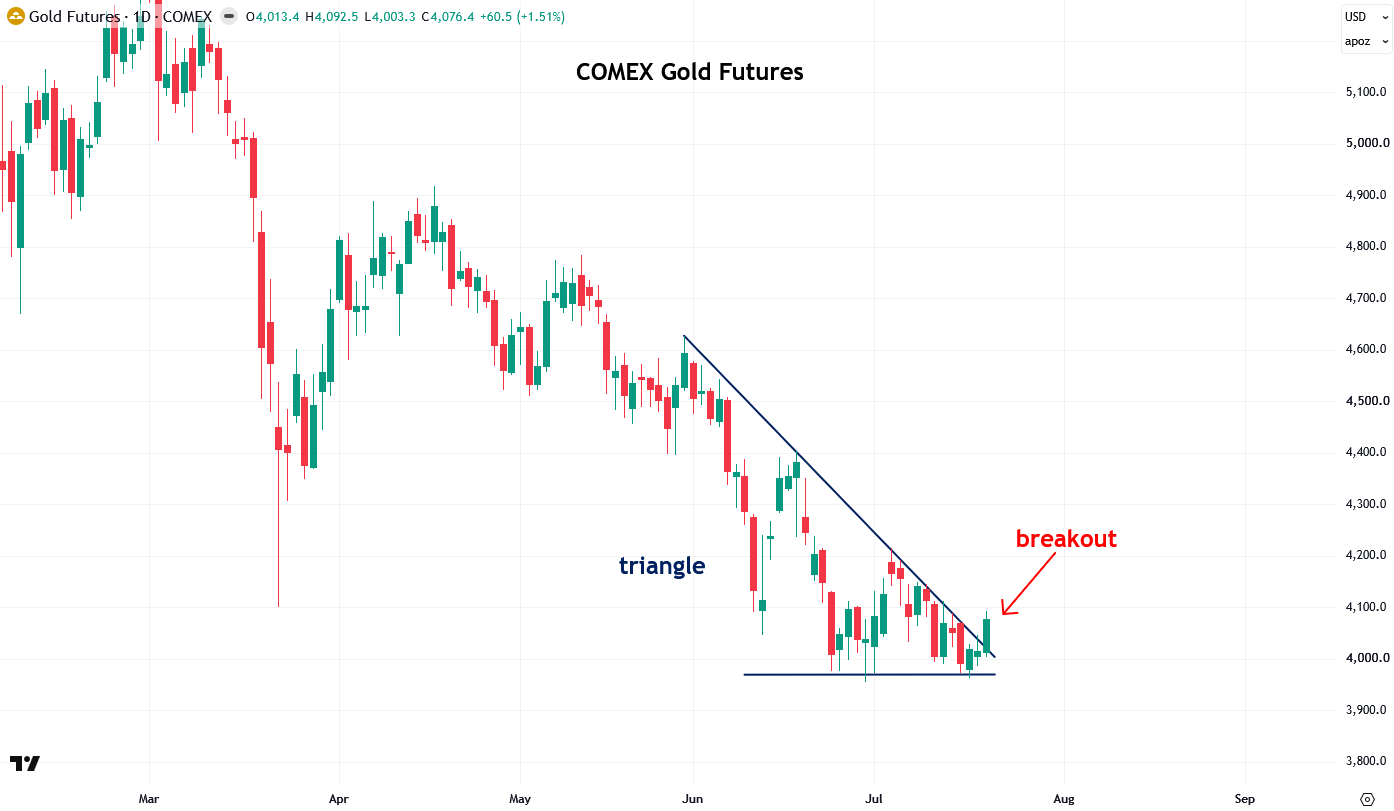
What’s most exciting about today’s action is that gold broke out to the upside from a triangle pattern that formed over the past month. Many commentators feared it would break to the downside and send prices into the mid-$3,000s or even lower, but I took a more optimistic view, as I explained in my update on Sunday.
This breakout in gold is an excellent start and likely a sign of further bullish action ahead, but as I mentioned earlier, there is still a significant amount of resistance overhead that I want to see cleared.
As each level is broken, I will become increasingly confident that the correction is over and that the uptrend is resuming (not that I ever doubted the long-term bull market in precious metals, of course).
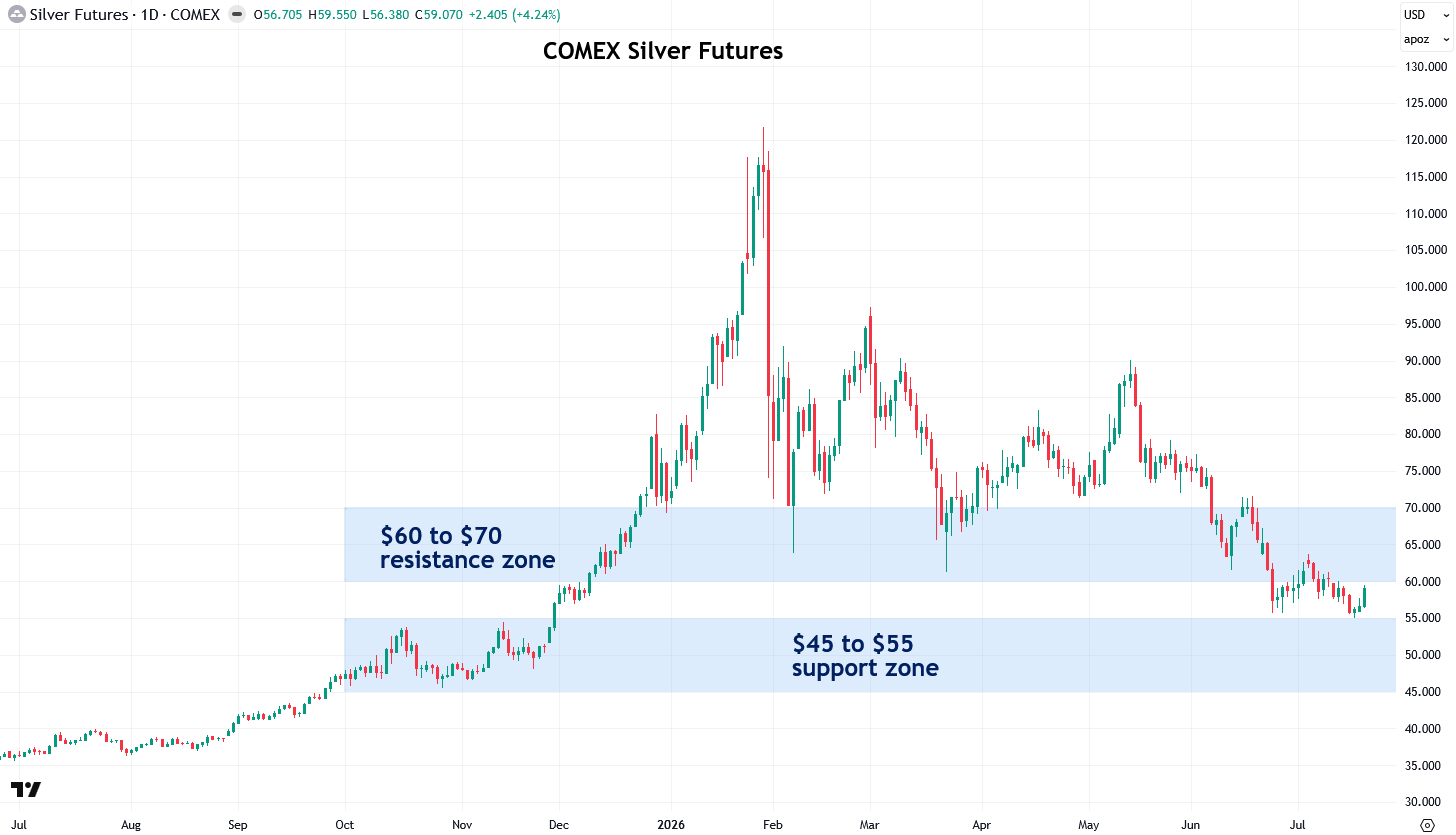
Silver also had a strong day, rising $2.40 per ounce, or 4.24%, launching its rebound right off the top of the $45 to $55 support zone I’ve been highlighting over the past month. This support zone was established by the highs and lows of October and November 2025.
The next hurdle is the $60 to $70 resistance zone just overhead, which needs to be cleared to confirm that the correction has run its course. This zone was established by the lows from December through June.
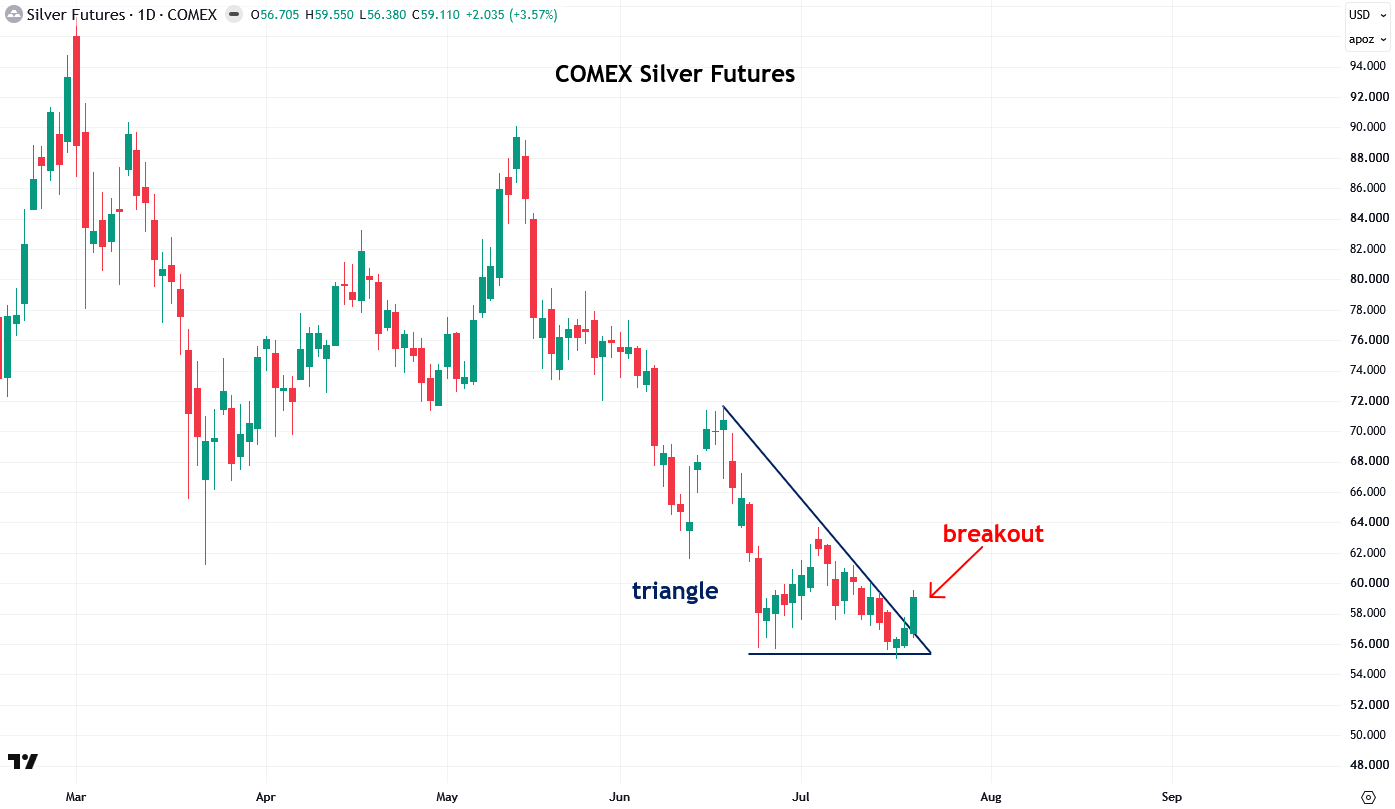
Like gold, silver also broke out of its triangle pattern today, which is quite encouraging, as many bearish commentators had been expecting a breakdown that would send prices below $50.
Today’s breakout increases the odds that the worst is over for silver and that further bullish action lies ahead. That said, as I mentioned earlier, I still want to see the $60 to $70 resistance zone cleared to gain greater confidence. Even so, this is an excellent start, and it’s encouraging to see an upside breakout rather than a breakdown.
In line with gold and silver, platinum rose 2.22% today, though it remains sandwiched between its $1,300 to $1,500 support zone and the $1,700 to $2,000 resistance zone.
I would like to see it clear that resistance to gain greater confidence that the correction is over and that the trend has turned upward once again.

Comments
Log in or sign up to join the conversation.