

Talk about a timing set-up. The June inflation report hit at 8:30 Eastern yesterday morning in the U.S. Only 90 minutes later, at 10 o’clock, Kevin Warsh sat down in front of members of Congress presiding over the House Financial Services Committee for his first testimony as Federal Reserve chair and promised lawmakers he would return inflation to 2%.
Now, we’re not saying he can actually accomplish this because, as Prinsights readers know, central banks cannot control supply chains or stop global conflicts, but let’s leave the arbitrarily set (in 2012) 2% stick-the-landing vow aside for a moment.
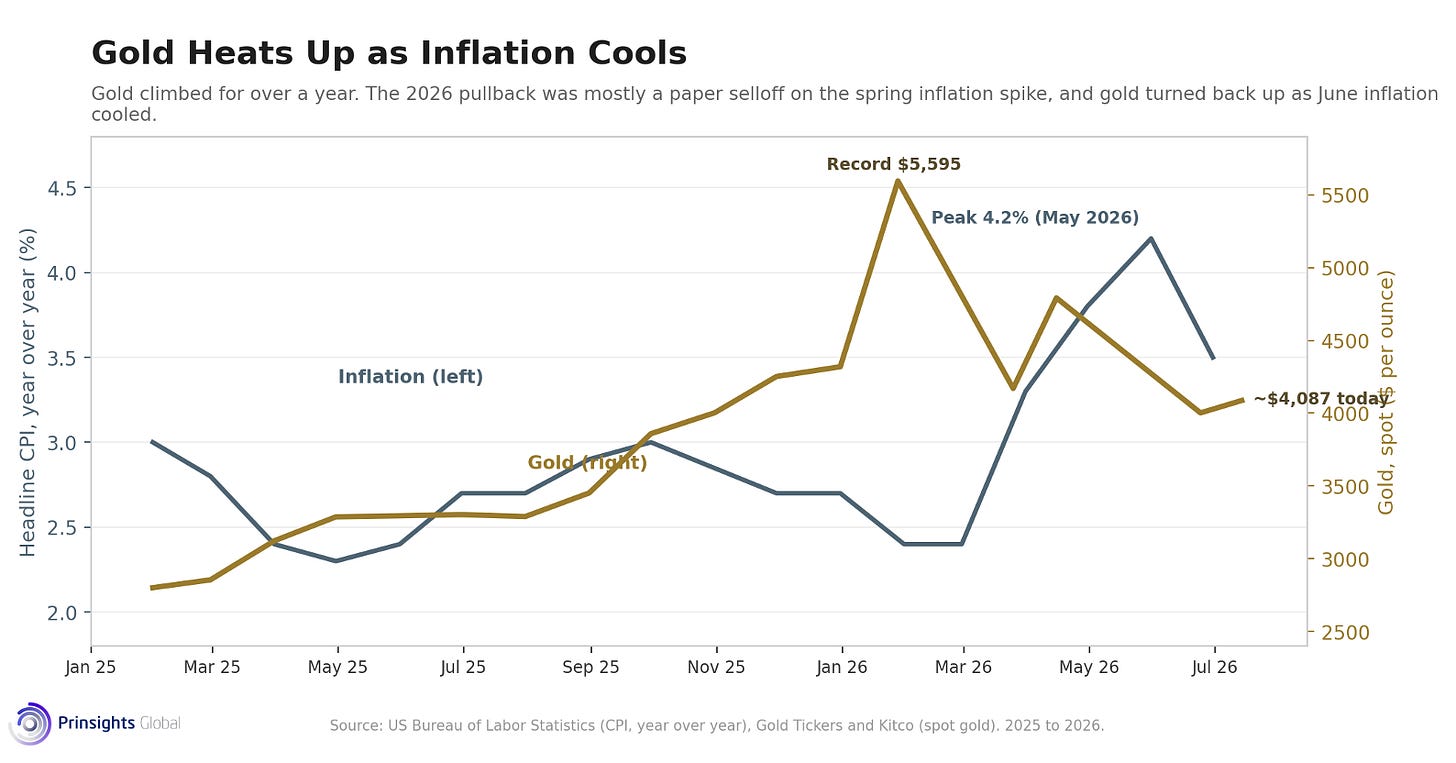
Because as we said it would, lower oil prices mathematically meant today’s data had already contributed to part of his goal. June’s headline CPI fell 0.4%, which was the largest one-month drop since April 2020, while the annual rate fell to 3.5% from 4.2% in May.
This is the moment we have been pointing to for weeks. The spring inflation spike was an oil-driven story, and the precious metals selloff was triggered mostly by paper speculation and feedback loop headlines – and that it would break once oil rolled back over.
This is that break.
Gold reacted immediately. It had sold off hard early in the day, then reversed the second the number hit, jumping about $60 to trade near $4,087 an ounce, up more than 2%. That’s how headlines impact prices, showing how one print can lift the biggest narrative weight that has sat on gold and silver since the Iran War began. The rate scare that drove the paper selloff is also fading, and the CME’s FedWatch tool now puts the odds of a Fed hold at 86%.
Again, It was a Paper Selloff
The drop in gold and silver over the past few months was never about waning physical metal demand. It was headline-induced and exacerbated by a deep paper market. Gold ETFs shed roughly 50 tonnes in the first half of the year, about $2.7 billion in redemptions, while the physical side did not budge.
The same pattern occurred more acutely with silver. About 49 million shares of the largest silver ETF changed hands in a single late-June session, against a metal the world mines at only about 820 million ounces a year. That’s because paper can reprice in seconds. But a mine takes years to come to fruition. The Fed cannot print an ounce, speed up a smelter, or make a central bank stop buying dollars or fiat currency diversification.
Underlying Buying and Supply Deficits Grew
Underneath all that noise, demand acted opposite of what the price drop implied.
Central banks bought an estimated 244 tonnes of gold in the first quarter of the year, more than the quarter before and way more than the five-year average, with a record 47% saying that they plan to add more over the next year. That follows more than 1,000 tonnes a year from 2022 through 2024, against a decade-earlier average near 470 tonnes.
Private buyers did the same, pushing total gold demand past 5,000 tonnes for the first time in 2025, with bar and coin buying near a multi-year high. Yet the supply deficits remained. Silver is in its sixth straight annual shortfall, 95 million ounces short in 2025 alone. Copper is forecast to be more than 500,000 tonnes short this year, and two million tonnes short by 2030.
Major new discoveries have seemingly dried up, and the average time from a new mine discovery to first production now runs about 18 years, up from 6 in the 1980s.
When metal cannot be found or built fast enough, buyers invest in the companies that already hold it, or can source solid junior projects, which is why the majors spent into a roughly $139 billion mining deal wave last year, the busiest since 2011.
Meanwhile, the structural path toward $6,000 gold, is still intact, and the spring handed patient buyers a discounted opportunity to buy physical gold and miners.
The same holds true for other metals and junior developers.
Comments
Log in or sign up to join the conversation.