


In this technical blog, we’ll take a closer look at the Elliott Wave charts for GOLD (XAUUSD) published in the members’ area of our website.
Gold recently completed a 3-wave pullback and rallied from the Equal Legs area as expected. The commodity may still be trading within the cycle that started from the 4233.8 low.
In the analysis below, we’ll examine the current Elliott Wave structure, key technical levels, and how we mapped the path ahead.
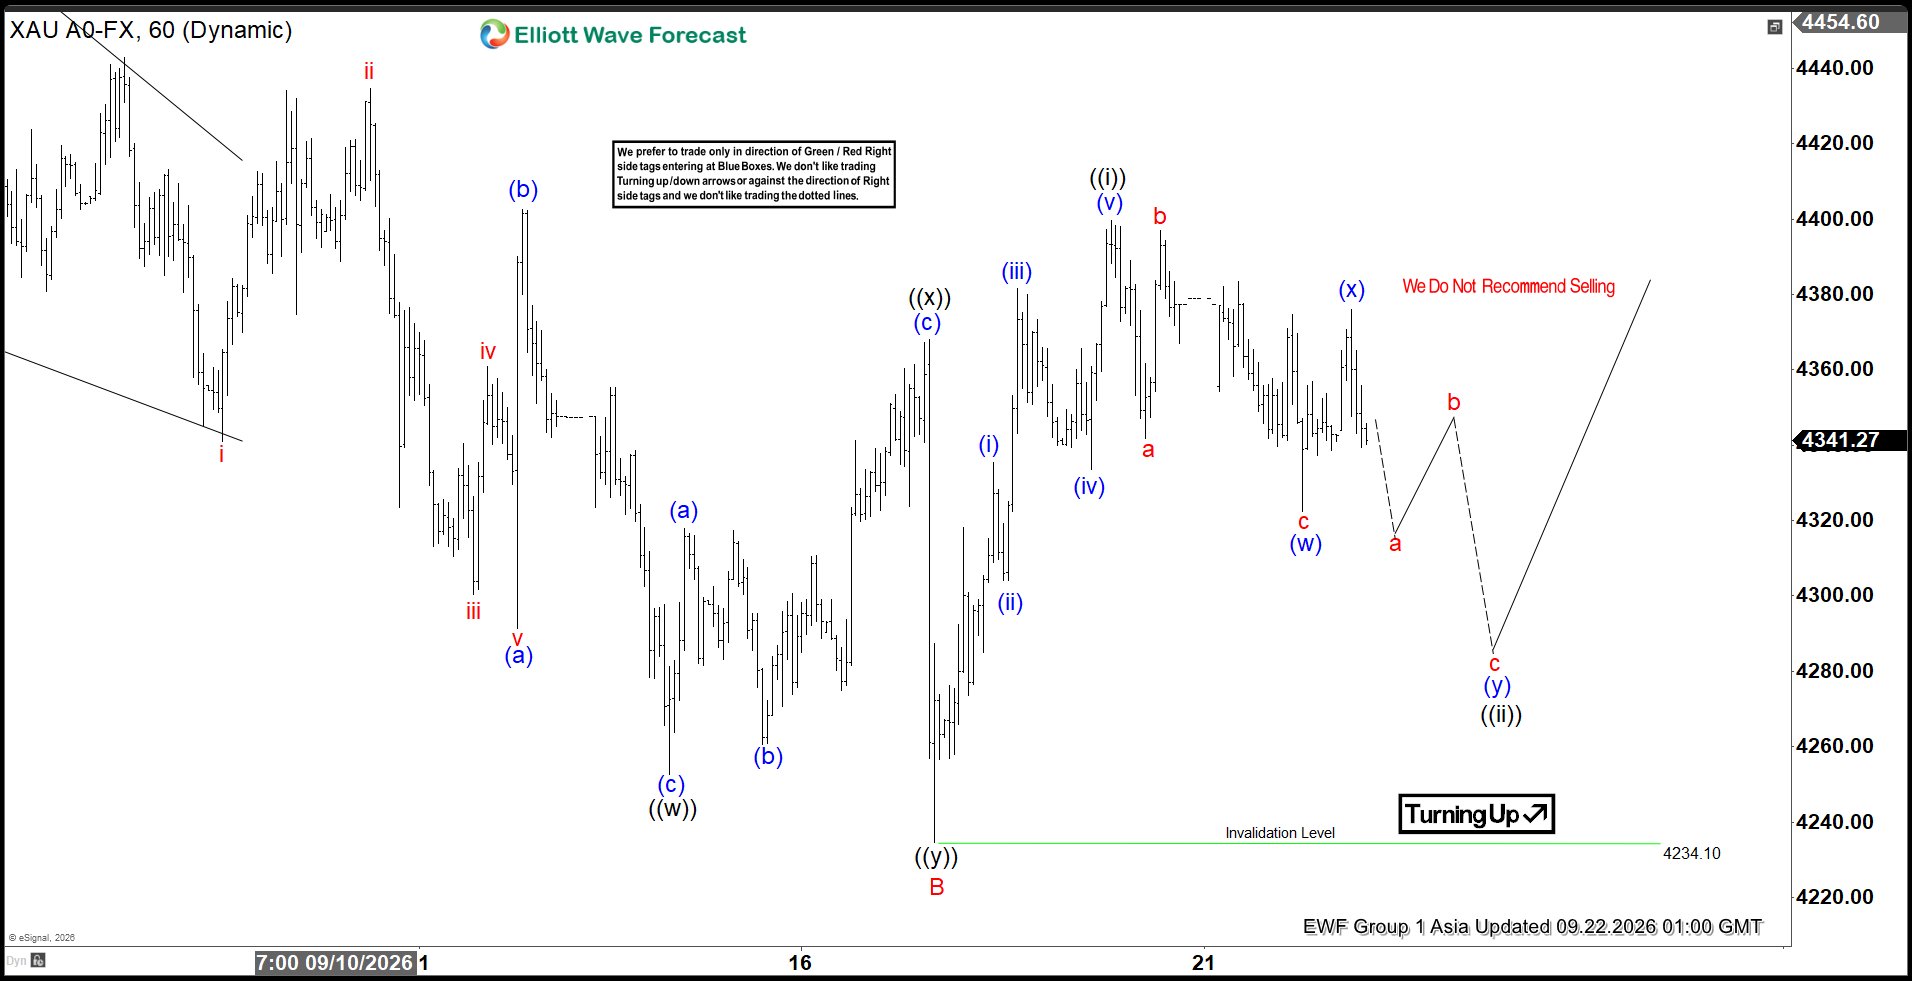
GOLD Elliott Wave 1 Hour Asia Chart 09.22.2026
The current view suggests that GOLD is still correcting the cycle from the 4234.1 low. The commodity is forming a 3-wave correction, which may be unfolding as a Double Three pattern.While price remains below the current peak, marked as (x) blue, we expect another leg lower to complete the (y) blue wave. As our members know, we derive the buying zone by measuring the Equal Legs area with the Fibonacci Extension tool. The ideal target area comes at 4299-4281 (buying zone).
Once GOLD reaches this zone, we expect buyers to step in and take control. From there, we look for a strong bounce in at least three waves, with the potential for the rally to eventually reach new highs.
You can learn more about Elliott Wave Patterns at our Free Elliott Wave Educational Web Page
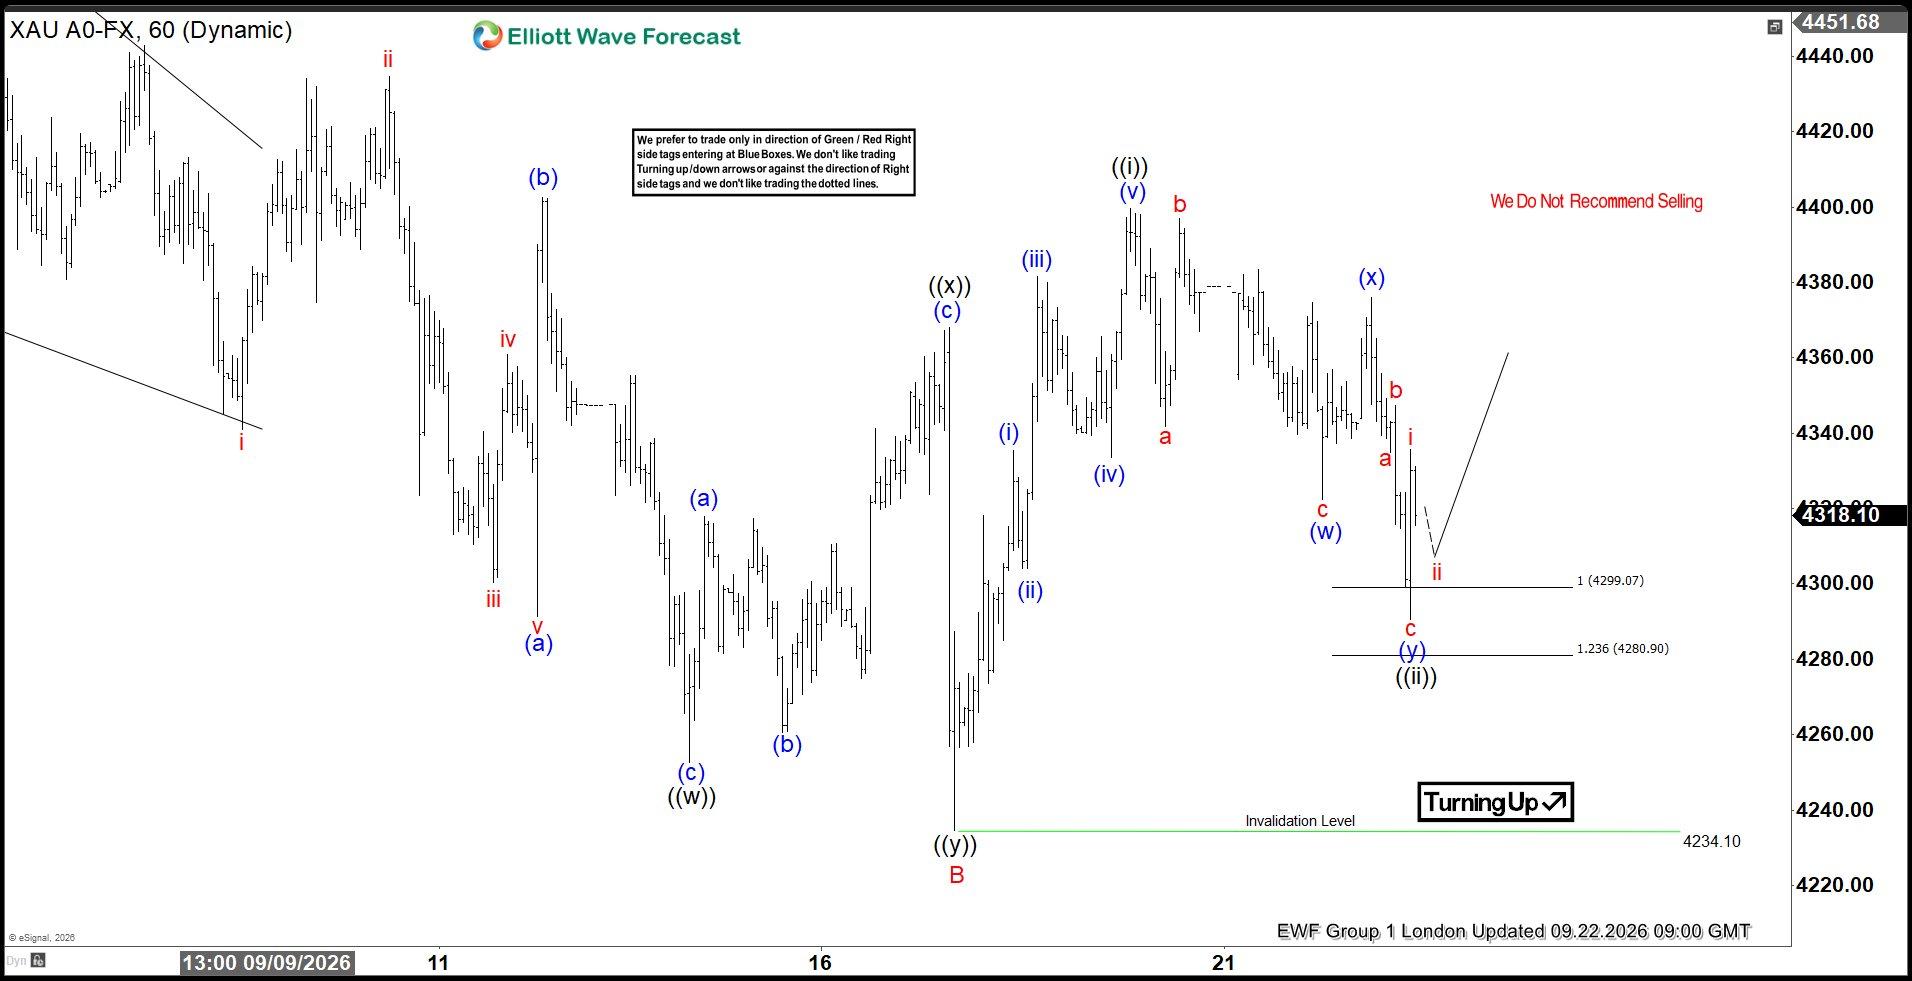
GOLD Elliott Wave 1 Hour London Chart 09.22.2026
The commodity made the expected decline and reached our target area at 4299–4281, the buying zone we identified in advance. Price has already found support there, with the pullback now counted as completed at the 4292 low. As long as price holds above 4292, we can consider wave ((ii)) completed, with wave ((iii)) potentially already in progress toward new highs.
However, a break below 4292 would suggest that the pullback may still be unfolding. In that case, the 4234 low would become increasingly vulnerable.



Comments
Log in or sign up to join the conversation.