


In technical analysis, maintaining strict alignment with Elliott Wave structures allows traders to anticipate major turns before they unfold. Our recent forecast on EURJPY provided a clear roadmap, identifying the end of a corrective recovery and setting up a sharp decline.
Here is a breakdown of how the forecast developed from analysis to execution.
The Forecast
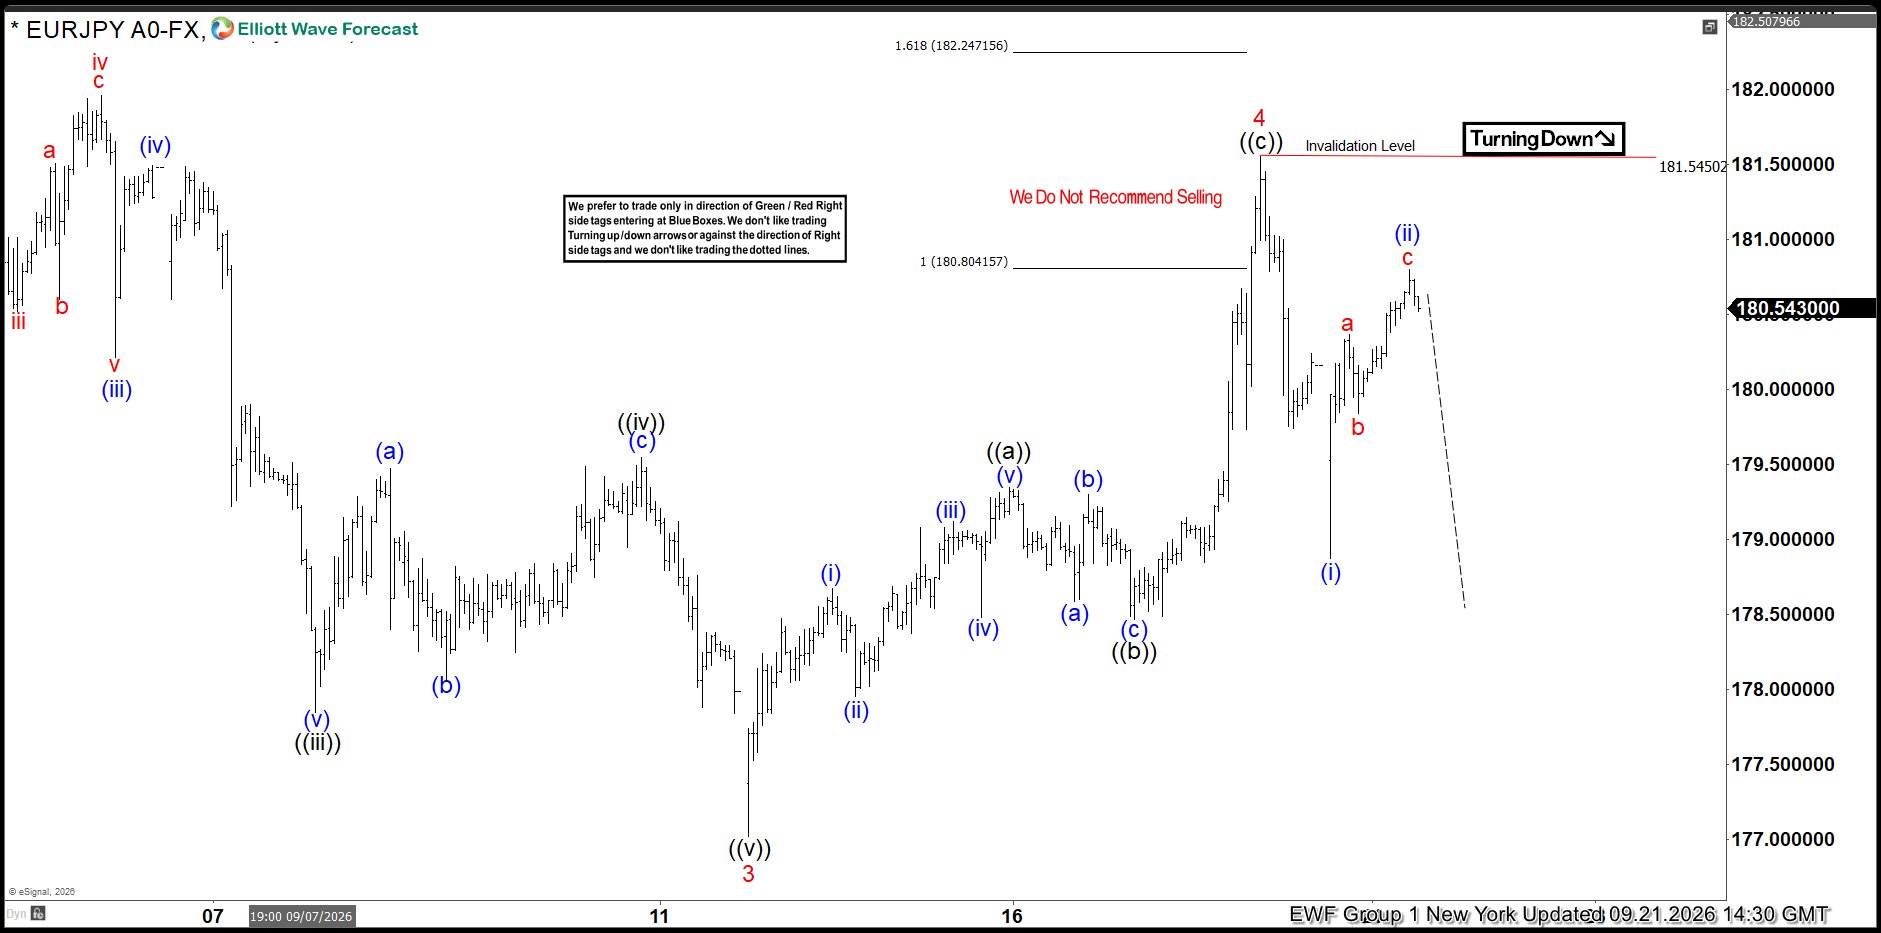
On the 1H chart updated during the New York session on 09.21.2026, EURJPY is proposed to have completed its Minor cycle at the red wave 3 low. From that point, price unfolded into a three‑wave corrective pullback, (ZigZag) ending wave ((c)) of 4 within the extreme zone of 180.804 – 182.247 and peaking at 181.545. The subsequent decline developed into five sub‑waves to complete wave (i), followed by a three‑swing a‑b‑c corrective bounce that formed wave (ii), which also remained capped below the 181.545 invalidation level. With wave (ii) topping at the highs, the structure aligned for a sharp continuation lower into wave (iii). See chart below
What is a ZigZag?
A Zigzag structure in Elliott Wave Theory is a sharp three‑wave corrective pattern labelled A‑B‑C, with a distinct 5‑3‑5 subdivision. It represents a counter‑trend move and is one of the most common corrective formations.
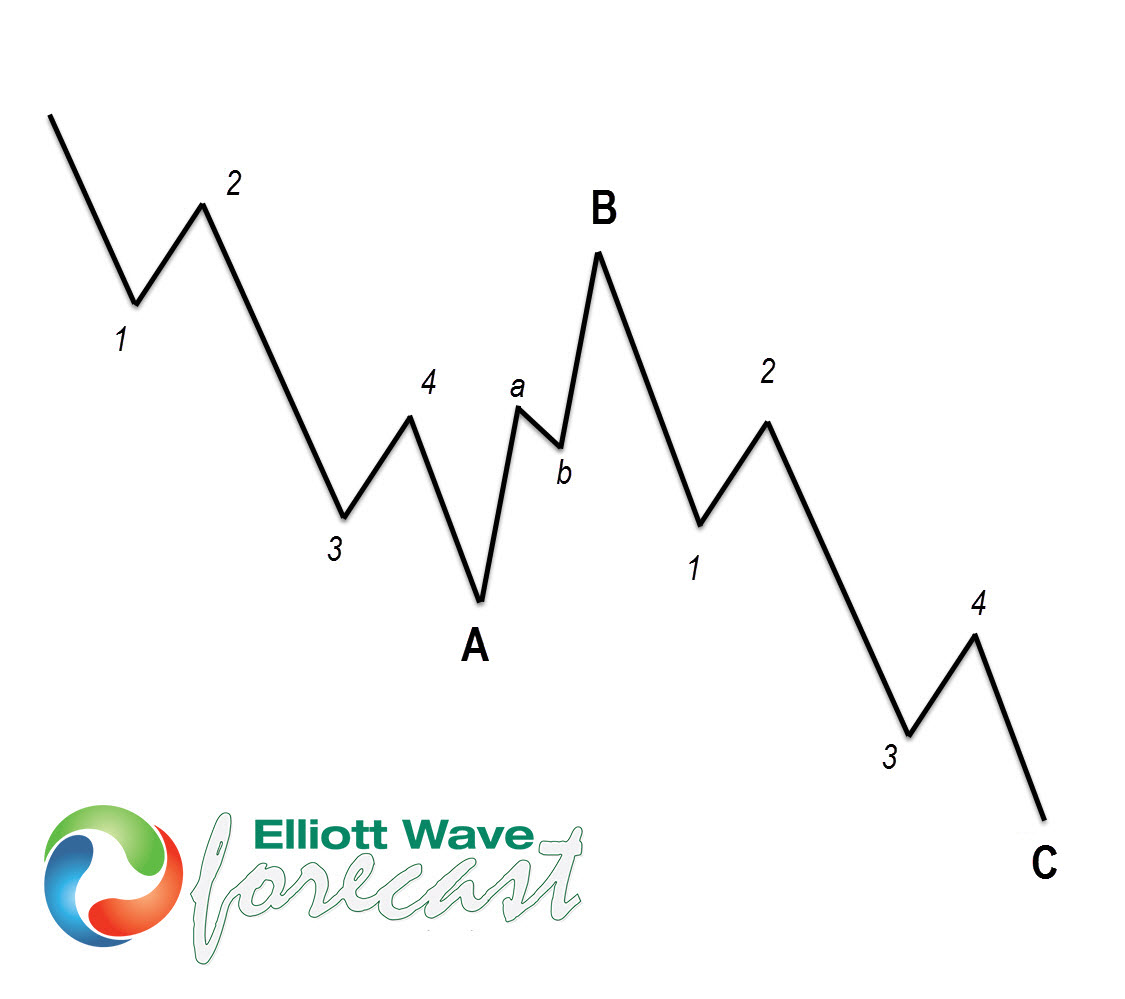
Wave A → 5 sub‑waves (impulsive decline or rise depending on trend).
Wave B → 3 sub‑waves (a smaller counter‑move).
Wave C → 5 sub‑waves (another impulsive move, usually equal to or longer than Wave A)
Trading Insights
Zigzags often signal continuation after correction, making them useful for identifying re‑entry points in the direction of the larger trend.
Traders watch for Blue Box zones (high‑probability reversal areas) to align entries with the end of Wave C.
Recognizing zigzags helps avoid mistaking them for trend reversals—they are corrective pauses, not new dominant trends.
Now that we understand what a Zigzag correction is, we can clearly connect that concept to the corrective structure shown in the EURJPY chart above.
The Outcome
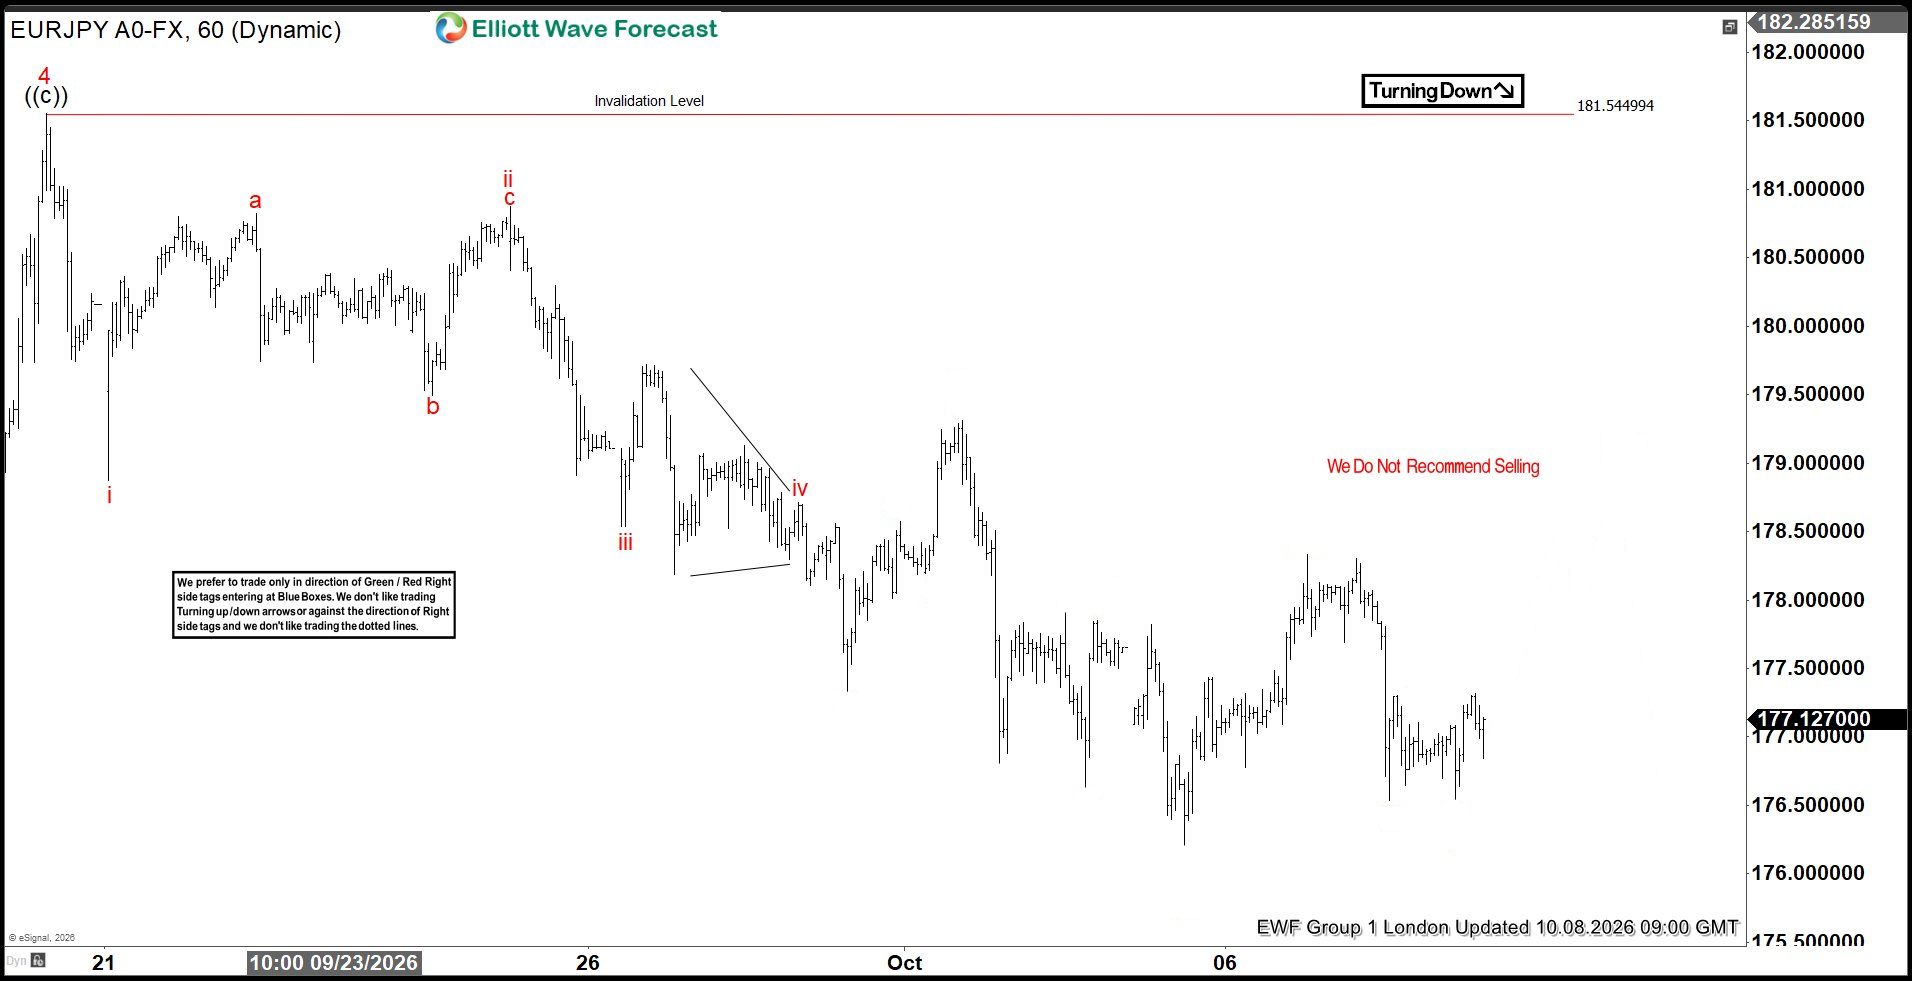
By October 08, 2026, the forecast played out with precision as EURJPY respected the 181.545 invalidation level. Price turned lower aggressively, confirming the wave count. Wave (iii) accelerated sharply, breaking through prior supports, followed by a brief wave iv consolidation in the form of a corrective triangle before resuming the decline toward fresh multi‑week lows. The bearish extension carried the pair down toward the 176.00 handle through late September and early October, delivering a powerful drop of over 450 pips from the wave (ii) turning point and underscoring the effectiveness of high‑probability Elliott Wave setups. See chart below
Note: Certain labels have been intentionally concealed to protect the exclusivity of our members.



Comments
Log in or sign up to join the conversation.