


The Energy Select Sector SPDR ETF (XLE) has continued to follow its bullish Elliott Wave structure, rewarding traders who focused on buying pullbacks rather than selling into weakness. After rallying from the July 2026 low, XLE completed an impulsive five-wave advance. Followed by a corrective pullback into our projected Blue Box area.
The September 21, 2026, 4-hour chart highlighted a potential buying opportunity as the correction approached the $61.81–$59.98 zone. As anticipated, buyers stepped in, and XLE subsequently turned higher.
By October 12, the ETF had rallied strongly from the Blue Box and broken above the previous high of $66.41. This breakout supports the bullish outlook and opens the door toward our next projected target area of $67.72–$69.81.
Let's review how the setup developed and what the latest price action means for the Elliott Wave outlook.
4 Hour Chart Technical View From September 21, 2026.
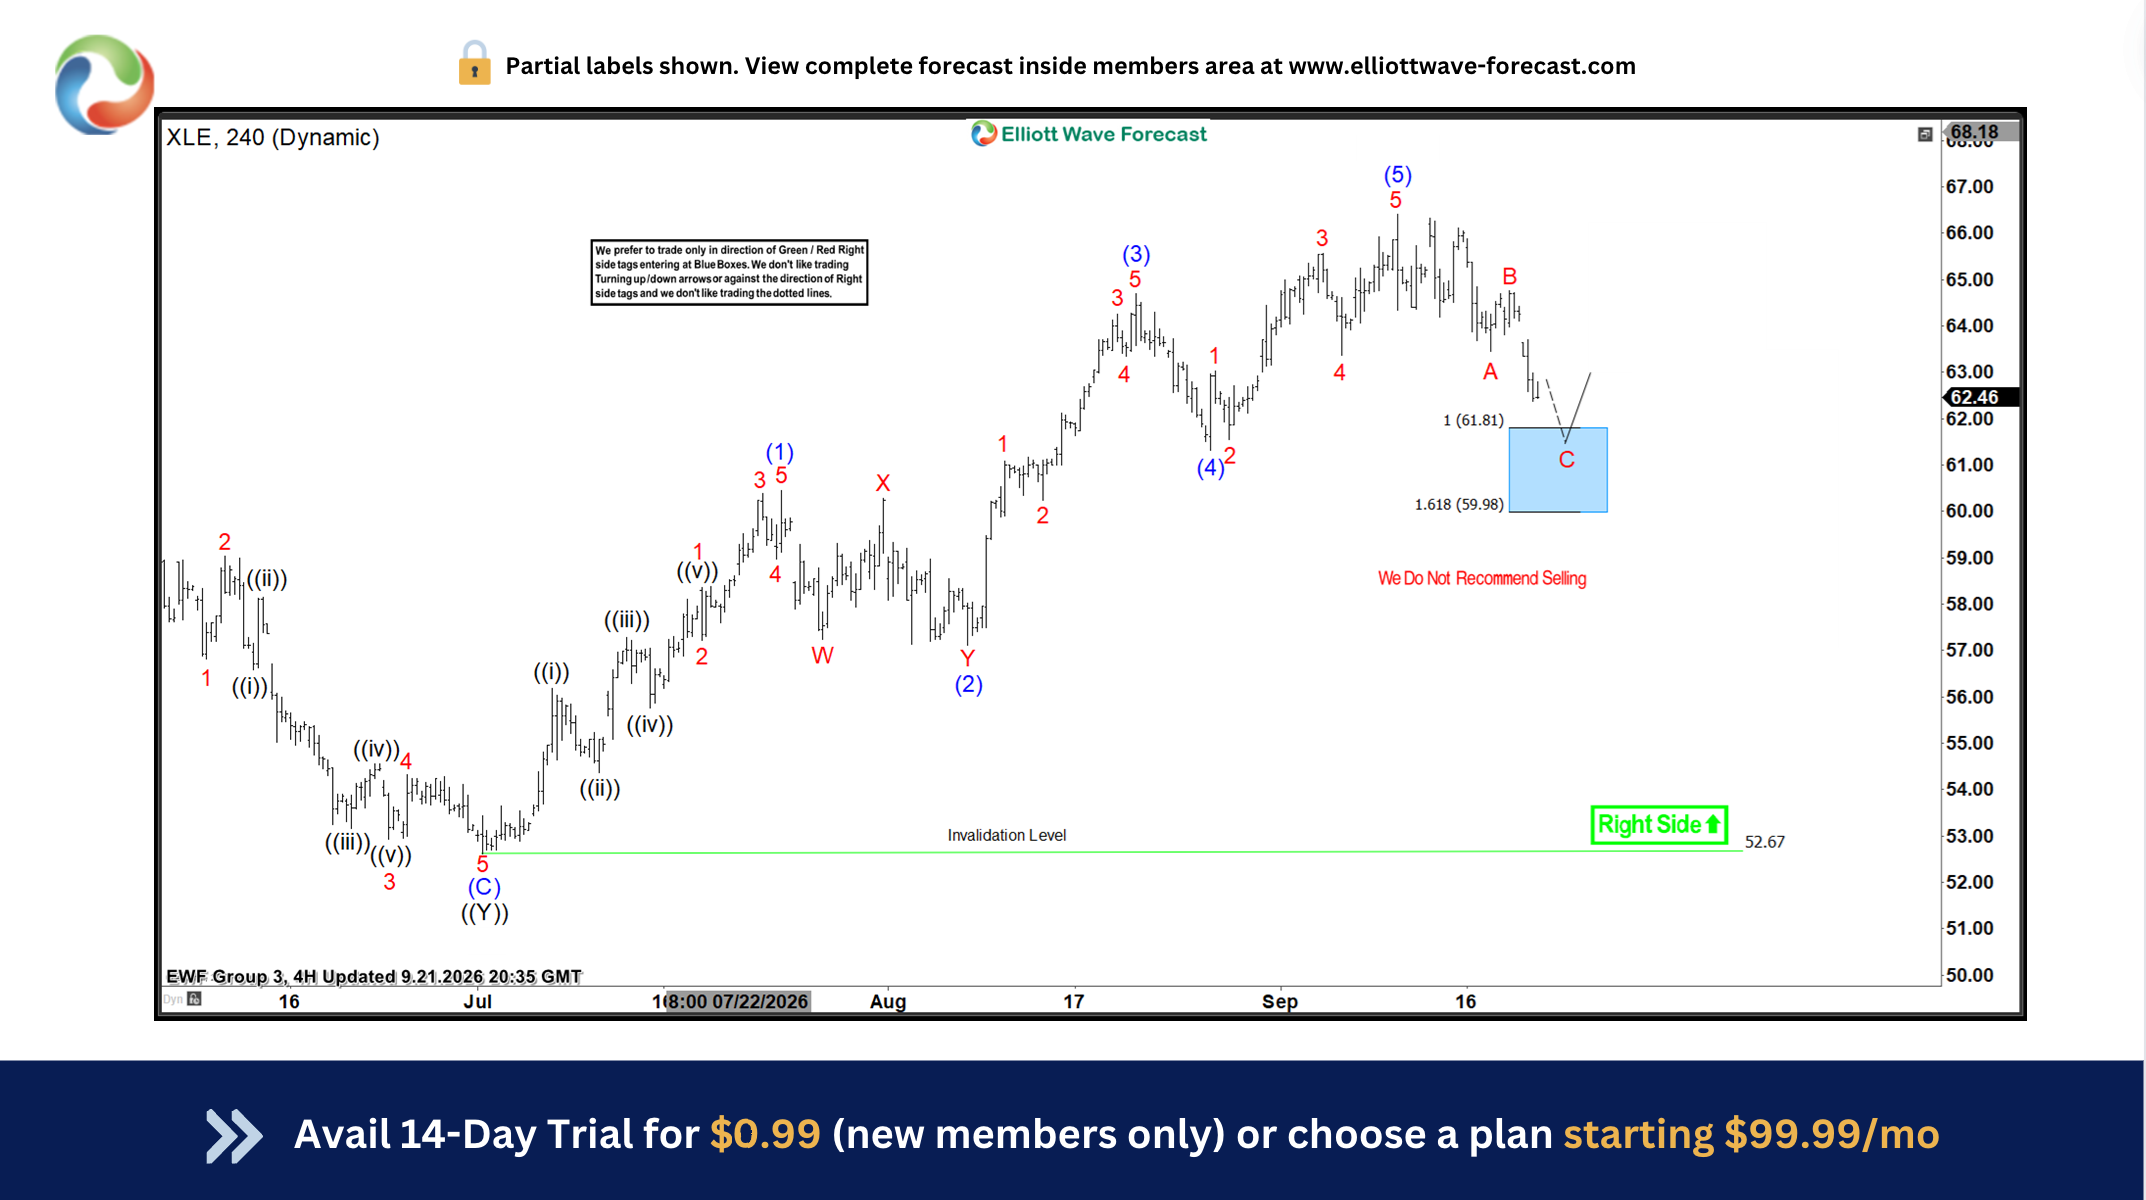
Chart Headline — Zigzag Correction Completed at Blue Box.
What the chart shows: The advance from the July 1 low unfolded as an impulse with waves labeled 1 through 5, peaking at $66.41.
Correction detail: The pullback developed as a classic zigzag and reached the blue‑box equal‑legs zone at $61.81–$59.98, which acted as a measured buying area.
Why it matters: That blue box offered a low‑risk entry where buyers were expected to step in for at least a three‑wave bounce or the next impulsive leg higher.
Updated Market Reaction From October 12, 2026.
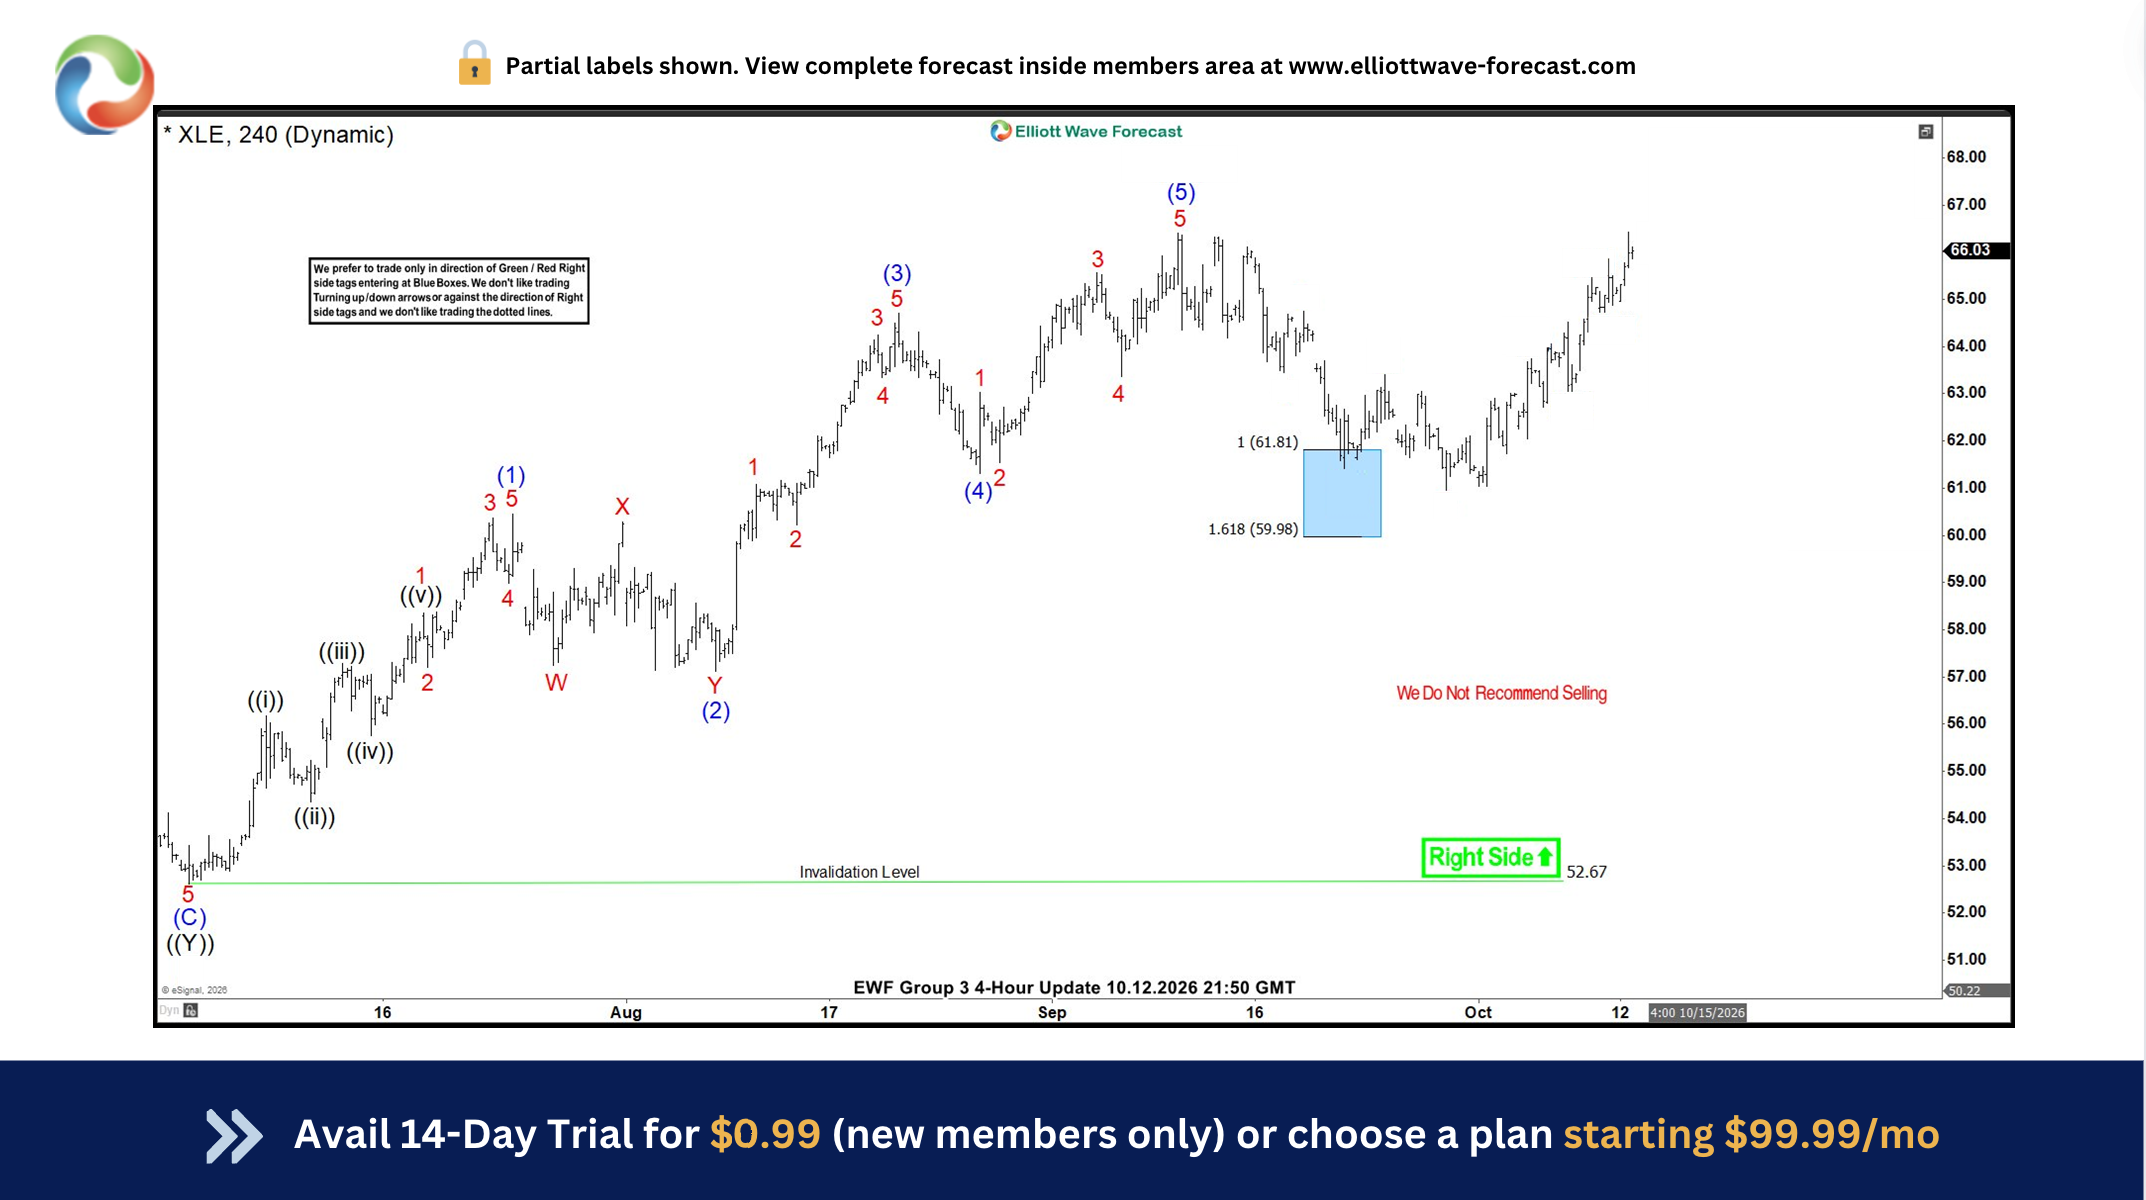
Chart Headline — Rally Confirms Break Above Prior High.
Price action: After the blue‑box reaction, XLE rallied strongly and cleared the prior $66.41 high.
Confirmation: The break above that level confirmed the next leg higher and allowed members to move stops to breakeven, creating risk‑free positions.
Near‑term targets: Initial upside objectives are $67.72–$69.81 before a likely profit‑taking pullback that may unfold in 3 or 7 swings.
Trade Plan and Risk Management
Chart Headline — Tactical Buy Zones and Risk Rules.
Entry: Buy dips into the blue box using 3, 7, or 11 swing sequences.
Stops: Place stop‑losses just below the blue box to define invalidation and protect capital.
Targets: Scale out into $67.72–$69.81; trail stops as the trend confirms.
Timeframe and sizing: Favor short to medium tactical holds and size conservatively relative to unleveraged ETFs to account for volatility.
Rule of thumb: Convert to risk‑free once price clears the prior high and your stop is moved to breakeven.
Why This Setup Works
Chart Headline — Blue Box Meets Elliott Wave for Defined Risk The blue‑box framework pairs Elliott Wave structure with measured risk zones. That combination lets traders enter with defined risk, convert positions to risk‑free quickly after confirmation. And capture high‑probability moves while limiting downside through disciplined stops and scaling. Consistent execution depends on position sizing, stop discipline, and an understanding of wave relationships.



Comments
Log in or sign up to join the conversation.