


TLN found support at the extreme zone we highlighted weeks ago. It's now clear the stock has started a fresh bullish cycle which could extend to could extend to $950 and higher.
Talen Energy is a leading independent power producer in the United States, operating a diversified portfolio of nuclear, natural gas, coal, and oil-fired generation assets. The company supplies electricity, capacity, and ancillary services to wholesale power markets while expanding its role in powering AI-driven digital infrastructure, making it a key player in the evolving U.S. energy sector.
TLN Elliott Wave Analysis – Weekly Chart, 17th August, 2026
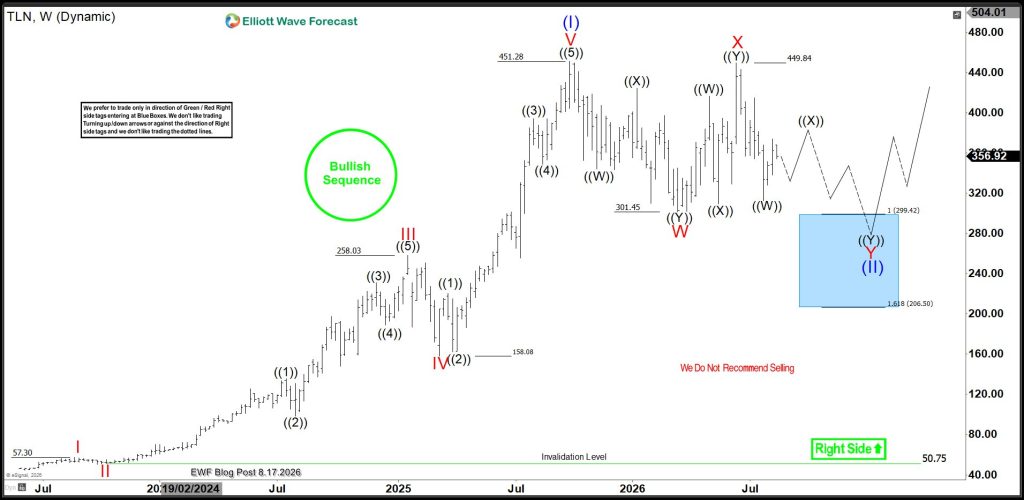
On August 17, 2026, we shared an initial analysis identifying that Talen Energy (TLN) had concluded its supercycle degree wave (I) at the September 2025 record high. In accordance with the Elliott Wave Principle—which dictates a 3-wave corrective structure following a 5-wave trend—we projected a pullback for wave (II). Over the subsequent year, the stock successfully formed a double zigzag structure for wave (II). We identified this emerging pattern at the midpoint of wave Y of (II) and forecasted the specific support zone where wave (II) would likely terminate, signaling the potential for a significant 3-swing bounce. We continued tracking this development in our follow-up report on September 21, 2026.
TLN Weekly Elliott Wave Analysis – 21 September 2026 Update
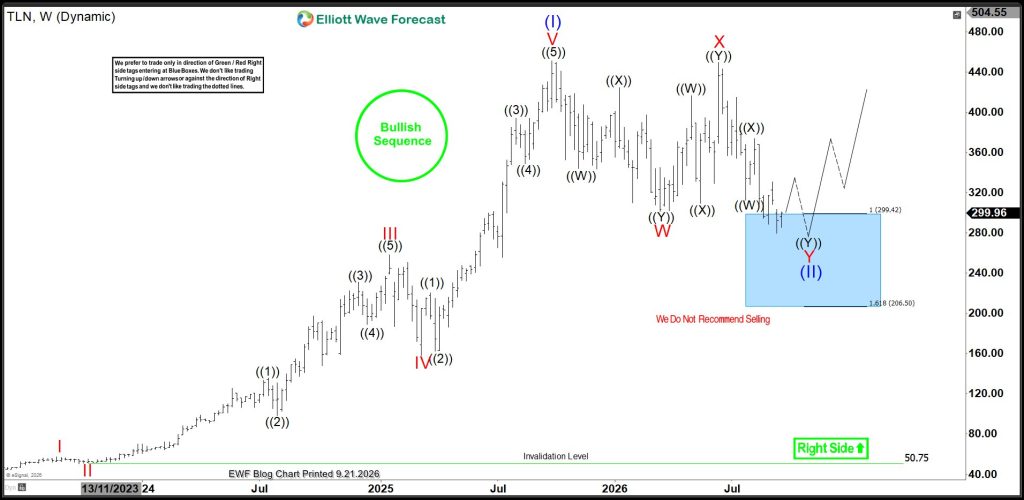
The September 21st chart update highlighted that Talen Energy (TLN) had entered the "blue box" support zone. Upon reaching this area, the stock demonstrated potential for a reversal at any price level within the defined range. Consequently, traders were advised to initiate long positions within the zone, utilizing stop-loss levels at the base prices of 299.42 and 206.5, respectively. From this support, we anticipated at least a 3-wave bounce, with the ideal outcome being the commencement of wave (III). Should this wave (III) develop as projected, it would mark a significant new cycle for both the company and its investors. Given that the third waves of an impulse pattern are historically the strongest, we anticipate the stock reaching the $1000 milestone.
TLN Weekly Elliott Wave Analysis – 13th October 2026 Update
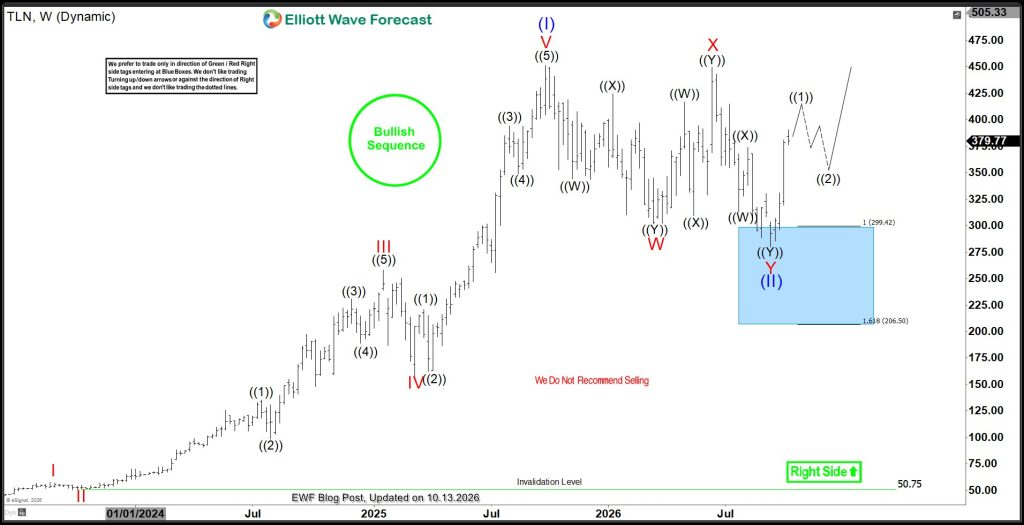
The weekly Elliott Wave chart for TLN shows a textbook reaction from our highlighted blue box support zone, confirming the ideal entry point for long positions. The current price action appears highly impulsive, signaling that wave (III) is likely underway. A breakout above the previous wave (I) high will serve as final confirmation of this trend.
We are currently tracking wave ((1)) of I within the larger wave (III) structure. While a minor pullback for wave ((2)) may occur shortly, we anticipate support holding above the wave (II) while the stock builds the more powerful wave ((3)) move. These upcoming impulse waves are expected to drive the stock to new highs, rewarding those who capitalized on the blue box setup. While our ultimate target for wave (III) remains $950 and higher, the path will likely include various corrective pullbacks that offer additional trading opportunities. As always, remember: in an incomplete bullish sequence, the core strategy remains to buy the dips from the blue box zone.



Comments
Log in or sign up to join the conversation.