

- SPX Monitoring purposes; Long SPX on 11/11/16 at 2164.45; sold 11/15/16 at 2080.39 = .74% gain.
- Monitoring purposes Gold: Covered on 11/9/19 at 24.59 = gain .07%: GDX11/2/16 at 24.78.
- Long-term trend monitor purposes: Short SPX on 1/13/16 at 1890.28
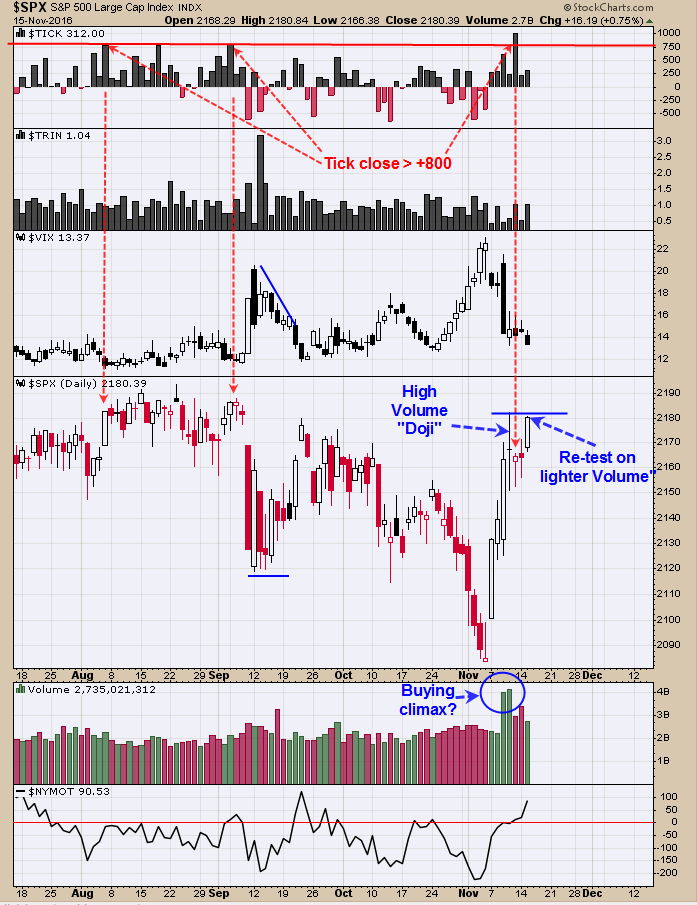
Last Friday the Ticks closed at +998. Closing ticks near +800 and higher suggests short-term exhaustion. Exhaustion ticks came on 8/5 and 9/6 and both of these ticks readings put brakes on the market rally (see chart above) and it may happen on this go around. On November 9 and 10, volume jumped near 40% from the previous days suggesting a “Buying Climax” is forming. Also a High Volume “Doji” formed on November 10, which is a short term bearish combination. Market may stall short term and we don’t know how big the potential pull back may be, so we played it safe and sold our long SPX position. With the ticks reaching extremes and Volume spike it appears short term exhaustion is forming. Sold SPX on 11/15/16 at 2180.39 = gain .74&; Long SPX on 11/11/16 at 2164.45.
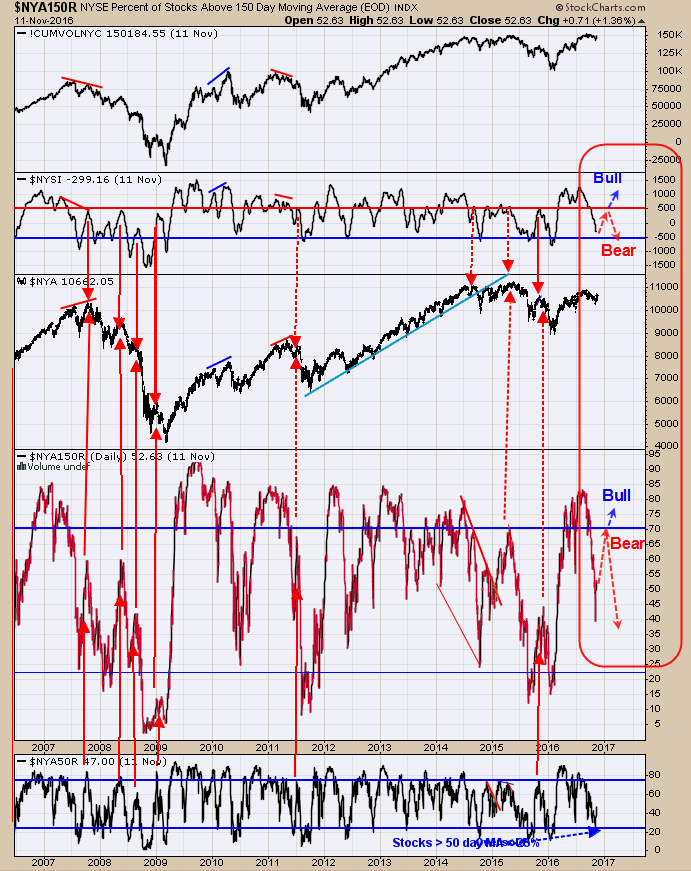
Last Thursday’s we said, “Nasty declines can occur when the McClellan Summation turns down below +500 and the stocks above 150 day moving average turn down near the 70% range. Therefore the next rally will need to push the McClellan Summation index above +500 and the stocks above 150 average above 70% to keep the bigger picture bullish. Right now the NYSE McClellan Summation index closed at -302.04 and the stocks above 150 day average stands at 52.86%. Seasonality is bullish to year end and the Summation index and the Stock above 150 day moving average may move higher into then.” Today the McClellan Oscillator closed a +90.53 and keeps the Summation index rising. With the recent Volume and TICKS readings exhaustion, the rally short term may stall and weaken the McClellan Oscillator readings which in affect weakens the McClellan Summation index. Seasonality is bullish here and it doesn’t appear a larger decline is beginning but upside at the moment also looks iffy. We are thinking if a large decline is coming, it may not start until January 2017.
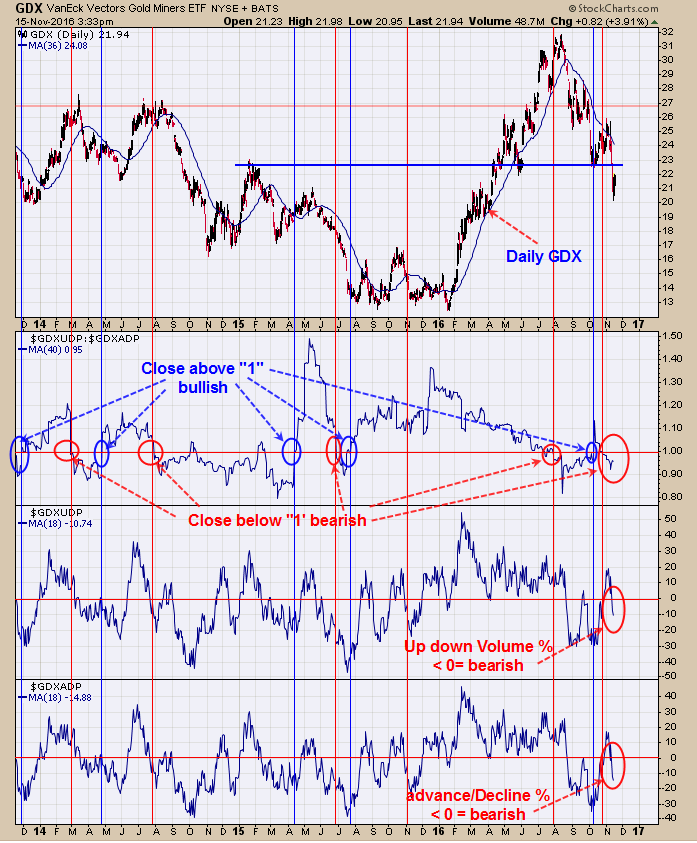
The second window down from top is the Up down Volume %/Advance/Decline % ratio. When this ratio is above “1” it’s a bullish sign for the market and when below “1” a bearish message and close came in at .95. The bottom window is the Advance/Decline % and readings below “0” are bearish and close came in at -14.38. Next window ups is the Up down Volume percent and readings below “0” are also a bearish sign and today’s reading on this indicator came in at -10.74. GDX is in the process of forming a bottom but still appears to be incomplete. Market may back and fill for several more days to complete the bottom process. We are staying neutral on GDX for now.



Comments
Log in or sign up to join the conversation.