

SPX Monitoring purposes: Sold SPX on 12/14/16 at 2253.28 = + 2.48%; Long on 11/30/16 at 2198.81.
Monitoring purposes GOLD: Long GDX on 12/28/16 at 20.25.
Long Term Trend monitor purposes: Short SPX on 1/13/16 at 1890.28
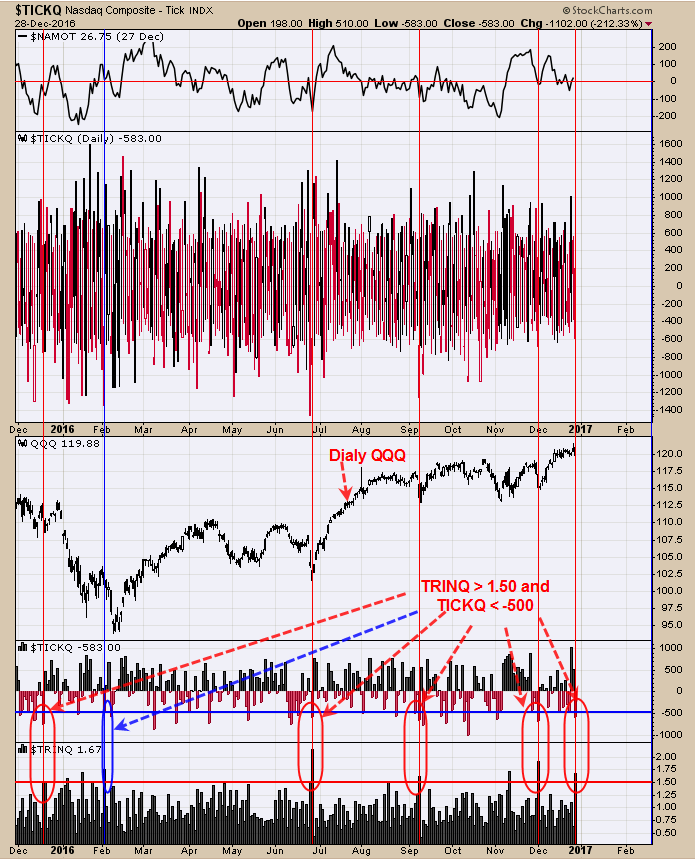
Today the TRIN closed at 1.54 and the TICKS closed at -9, not a bullish combination. Today the TRINQ closed at 1.67 and the TICKQ closed at -583 which is a bullish combination suggesting the QQQ is near a short term low, and if the QQQ bounces so will the SPX. Above is the daily QQQ chart with the TRINQ at the bottom and above that is the TICKQ. The red verticals lines show when the TRINQ closes above 1.50 and the TICKQ closes below -500. The red vertical lines show when this combination was present and the QQQ was near a low. The blue vertical line shows the failure. If the TRINQ had stayed near 1.00 and the TICKQ > -200, we would have been short the SPX today. A signal may still develop and depends how the market bounces. Neutral for now.
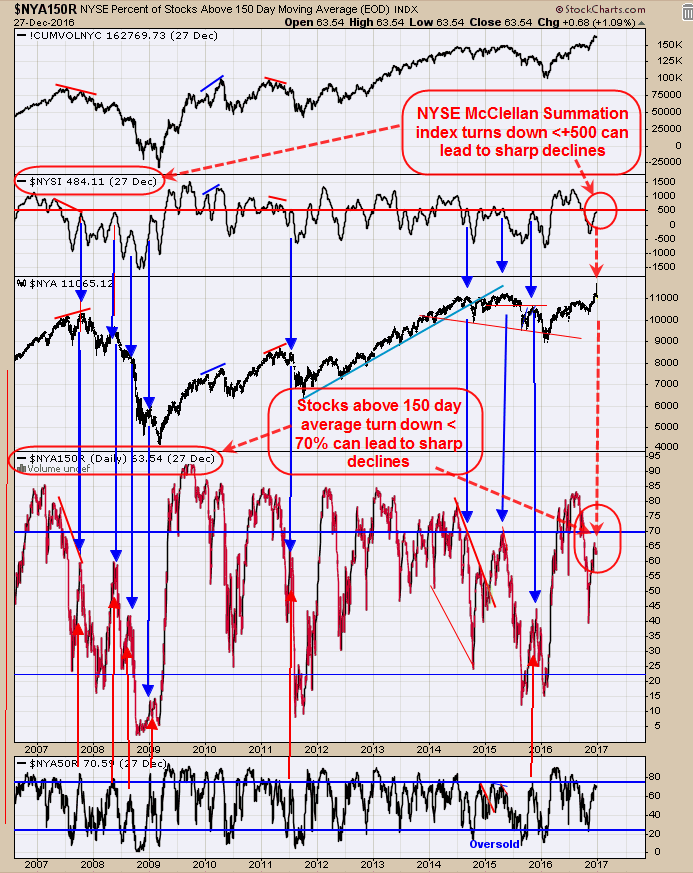
We have shown this chart before and this setup can lead to sharp declines. When the NYSE McClellan Summation index turns down before reaching +500 and NYSE stocks above 150 day average turns down before reaching +70%, it can lead to sharp declines. Today the McClellan Oscillator closed at -32.30 which in turn turned down the McClellan Summation index before reaching above +500. Yesterday the Stocks above the 150 day average stood at 63.54 and below the 70% threshold. Sold our long SPX position at 2253.28 for a gain of 2.48% on 12/15/16; Long SPX on 11/30/16 at 2198.81.
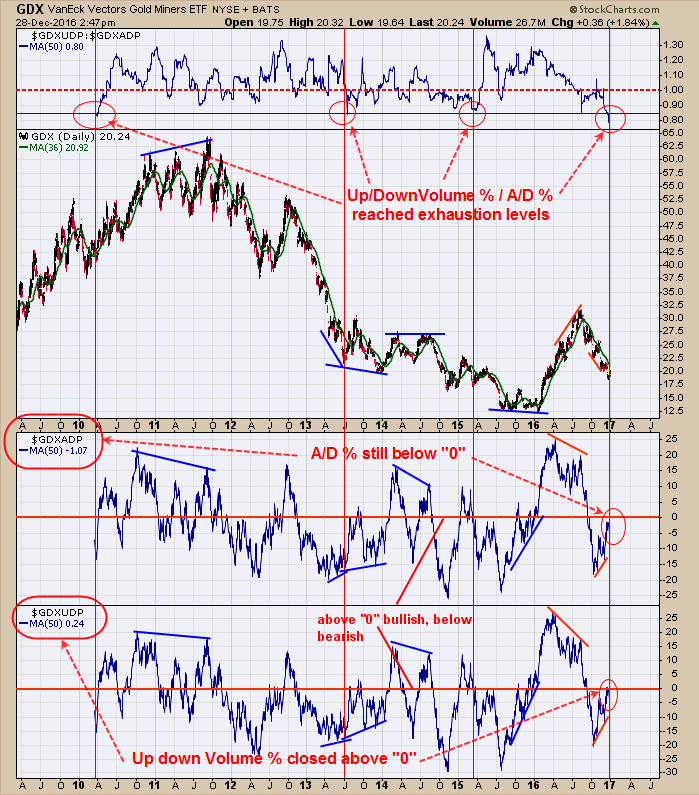
The top window is the Up Down Volume %/ Advance/Decline % ratio which has reached downside exhaustion levels and suggests down side on GDX is limited. The monthly GDX chart suggested the 20.00 range has good support (see December 1 report). The bottom window is the Up Down Volume percent. This indicator has been moving up since October while GDX was moving down and a positive divergence and yesterday this indicator closed above “0” (.24) and a bullish sign. Next window up is the Advance/Decline Percent and this indicator also has been moving up since October and a positive divergence and yesterday’s close came in at -1.07. We don’t have today’s reading until a couple hours after the close but with today’s rally in GDX it would appear a close above “0” is possible.
There could be backing and filling short but there is evidence that GDX is making a bottom in this region. Long GDX on 12/28/16 at 20.25.



Comments
Log in or sign up to join the conversation.