

SPX Monitoring purposes; Sold long SPX 8/18/20 at 3389.78=gain .49%; long 3373.43.
Monitoring purposes GOLD: Long GDX on 7/8/20 at 38.62.
Long Term Trend SPX monitor purposes; Short SPX 5/13/20 at 2820.
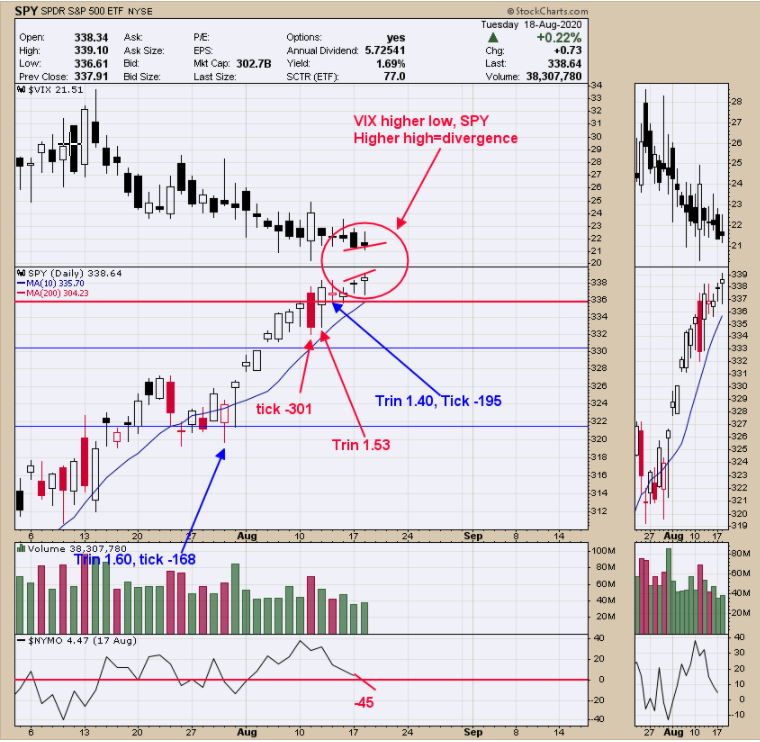
We were looking for a stronger move than what we got as we were expecting a thrust through the February high. What we got was a modest close up on reduced volume and the VIX making a higher close and added to that the NYSE McClellan Oscillator closed below “0” (-45).SPY also has been drawing narrow days with reduced volume which represent a quiet market and weak upside momentum (momentum rules all indicators). A quiet market precedes a volatile market.
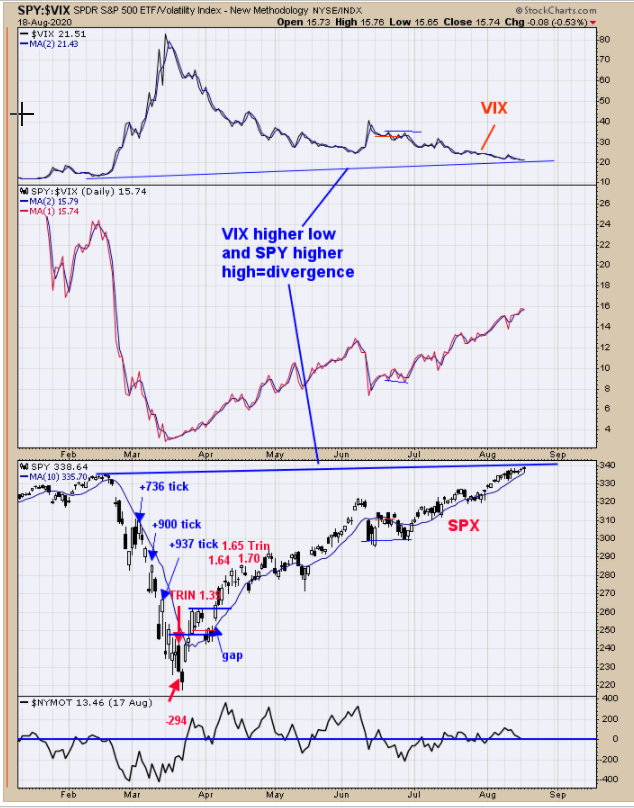
Top window is the VIX and the second window up from the bottom is the SPY. SPY (along with the SPX) has broken to a high above the February high and the VIX is making a much higher low and is a significant divergence. Since markets are testing the February high it would make sense for a reaction to form around this level. For now an intermediate term divergence is present.
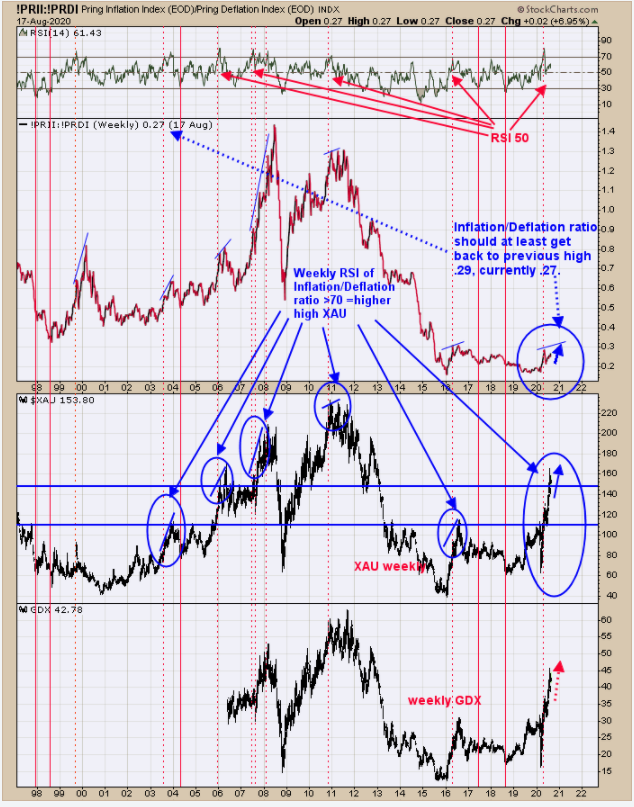
Above is one of our intermediate term indicators which are the weekly Inflation/Deflation ratio. When the weekly RSI for the Inflation/Deflation ratio reaches above 70, higher highs in XAU (GDX) is expected. The weekly RSI of this ratio reached >70 back in April. A high can be expected in XAU (GDX) when the weekly Inflation/Deflation ratio at least matches it previous high which was .29 (the time when the RSI reached >70); the current price is .27. Higher highs are expected in the coming weeks. We remain intermediate term bullish. Long GDX on 7/8/20 at 38.62.



Comments
Log in or sign up to join the conversation.