
Fortinet Inc., Elliott Wave Technical Analysis
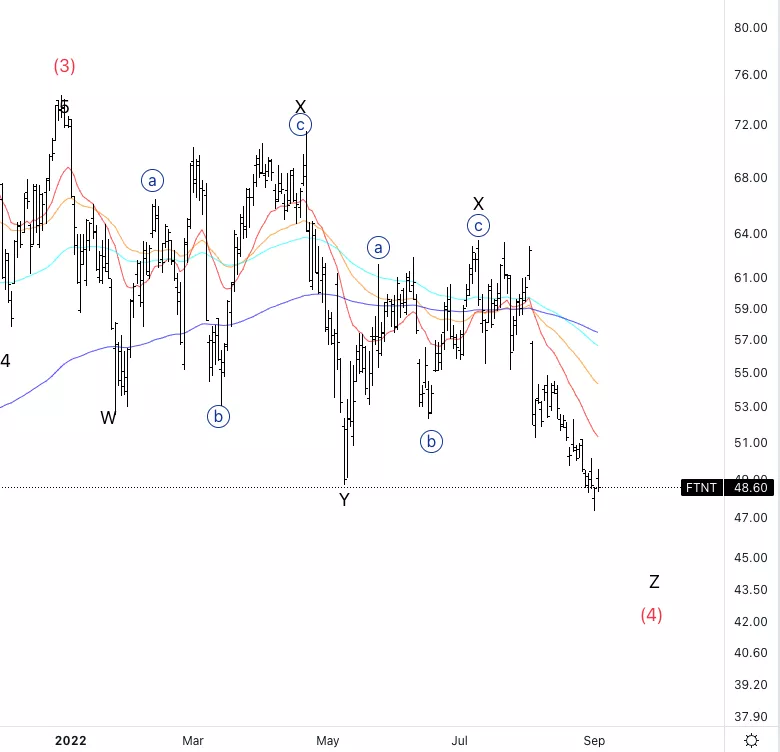
Fortinet Inc., (FTNT): Daily Chart, September 5 2022,
FTNT Stock Market Analysis: We are in a long lasting correction which appears to be a triple combo. We are looking to further downside as we are approaching support.
FTNT Elliott Wave count: Z of (4).
FTNT Trading Strategy: Waiting for a clear move up to start looking for the resumption of the overall uptrend.
FTNT Technical Indicators: We are below all EMAs and all indicators are still suggesting the trend is bearish.
TradingLounge Analyst: Alessio Barretta
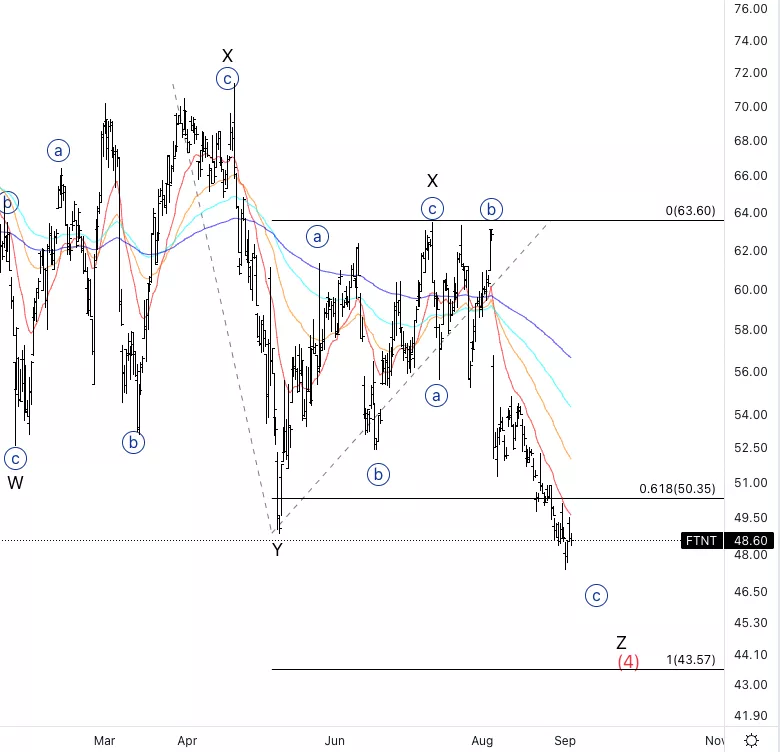
Fortinet Inc.: 4-hour Chart, September 5 2022
Fortinet Inc., Elliott Wave Technical Analysis
FTNT Stock Market Analysis: Looking for downside support to be reached. As we passed the 0.618 {a}vs{c} we are looking for equality at 43$ as next target.
FTNT Elliott Wave count: {c} of 4.
FTNT Technical Indicators: All indicators are bearish, the 20EMA could act as resistance for potential short trades.
FTNT Trading Strategy: Short term trading we could look for shorts as long as the downtrend remains intact.
More By This Author:
Elliott Wave Technical Analysis: AAVE Token
Elliott Wave Technical Analysis - PepsiCo Inc.
Elliott Wave Technical Analysis: Costco Wholesale Corp.


Comments
Log in or sign up to join the conversation.