

Image Source: Pixabay
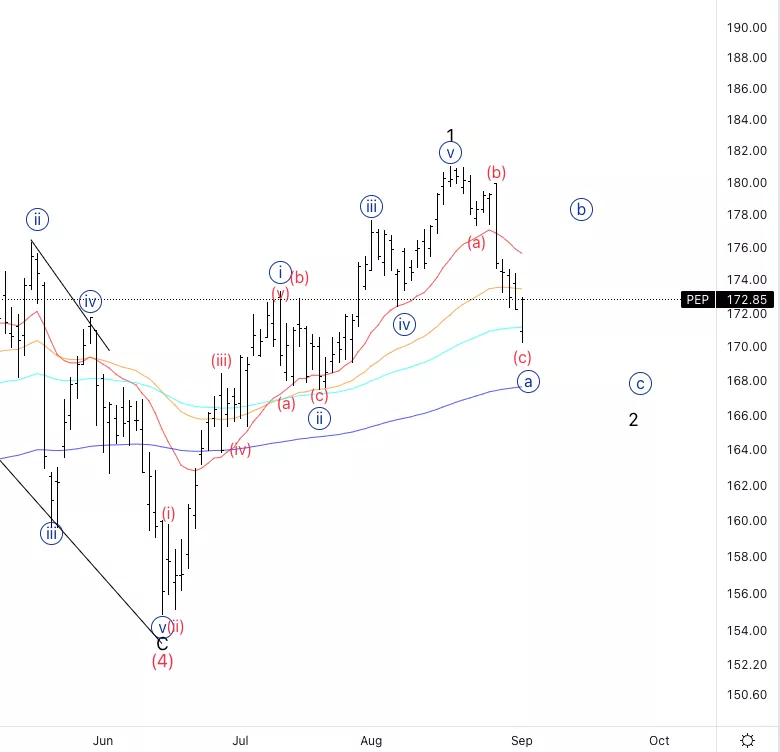
PepsiCo Inc.,(Nasdaq: PEP): Daily Chart, September 2, 2022,
PEP Stock Market Analysis: It has been moving as expected since the last forecast. At this point, we should expect a pullback into wave {b}, unless wave 2 is already finished.
PEP Elliott Wave count: c) of {a}.
PEP Trading Strategy: Waiting for confirmation of uptrend resumption, knowing that we could get more downside into wave {c} as the correction most likely isn’t over.
PEP Technical Indicators: We are still above the 200 EMA which is a sign we are still in an uptrend on the higher degree.
Analyst: Alessio Barretta
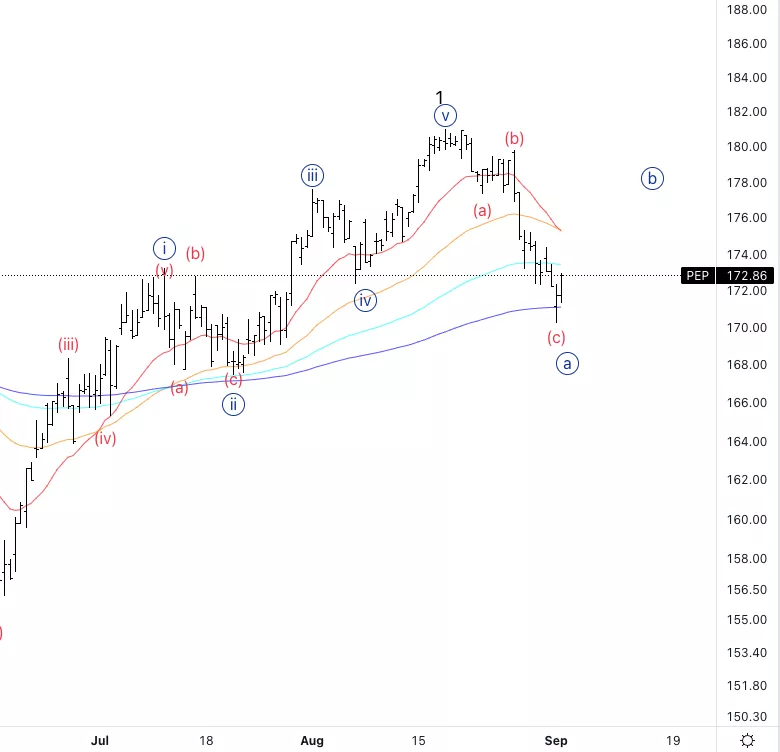
PepsiCo Inc., PEP: 4-hour Chart, September 2, 2022
PepsiCo Inc., Elliott Wave Technical Analysis
PEP Stock Market Analysis: Looking for an upside move to come soon, as wave c) seems to be finished.
PEP Elliott Wave count: (a) of {b}.
PEP Technical Indicators: We found the support for the 200 EMA and reacted well to it.
PEP Trading Strategy: Looking for the upside, in the short term we could look for longs after we get a break of the last lower high and a successful pullback from it.
More By This Author:
Elliott Wave Technical Analysis: AAVE Token
Elliott Wave Technical Analysis: Costco Wholesale Corp.
Ethereum Elliott Wave Analysis, Sept. 1, 2022


Comments
Log in or sign up to join the conversation.