

Image Source: Unsplash
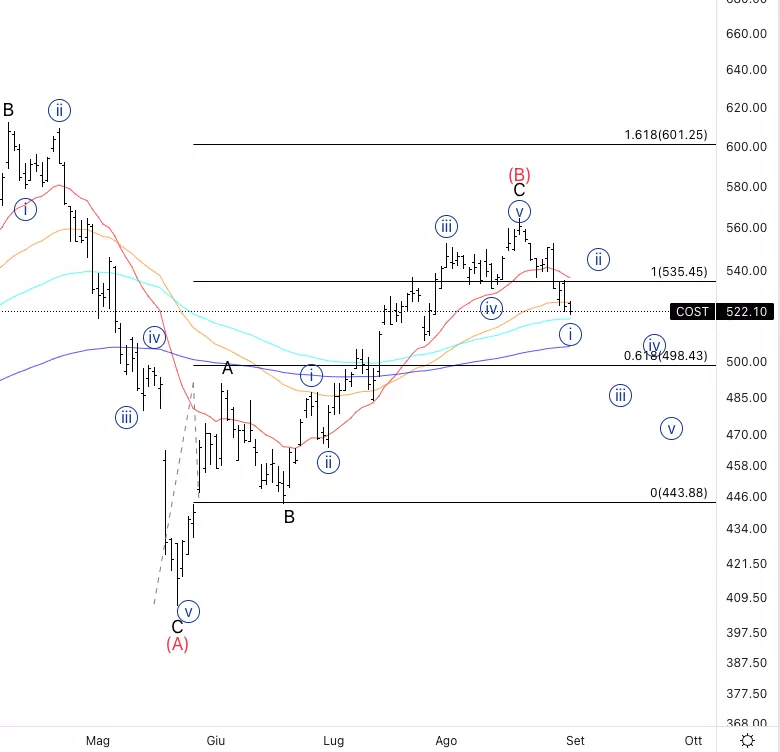
Costco Wholesale Corp (Nasdaq: COST): Daily Chart, September 1, 2022,
COST Stock Market Analysis: We could be moving lower for wave (C), as we are starting to unfold lower and we broke the previous higher low.
COST Elliott Wave count: (v) of {i}.
COST Trading Strategy: Looking for completion of wave {ii}, then look for longs.
COST Technical Indicators: We broke through the 20EMA(red line) which is a bearish sign, eventually it’ll become resistance for wave {ii}.
Analyst: Alessio Barrett
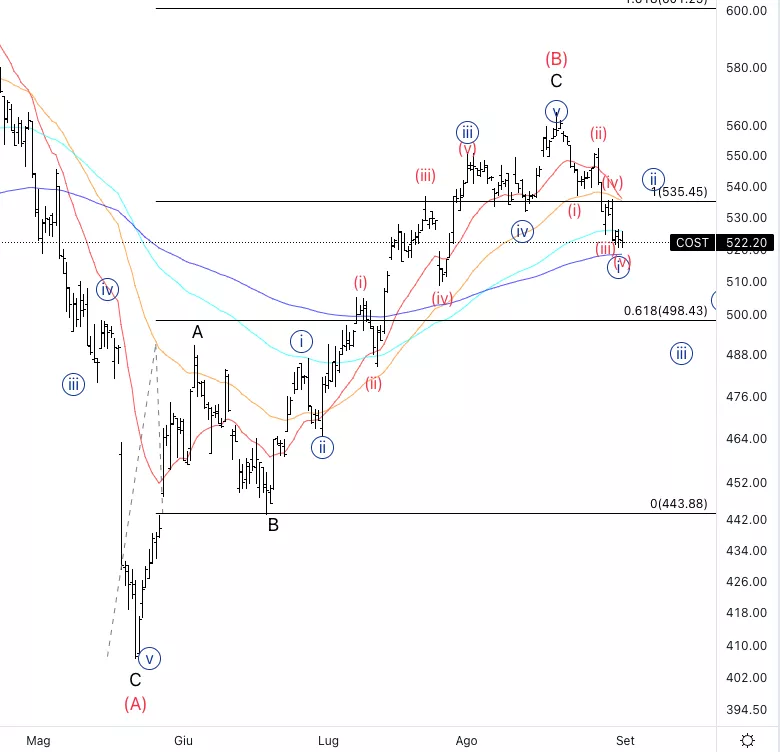
Costco Wholesale Corp., COST: 4-hour Chart, September 1, 2022
Costco Wholesale Corp., Elliott Wave Technical Analysis
COST Stock Market Analysis: Looking for a pullback to start soon as we are approaching the invalidation level(wave (iii) being the shortest). In addition to that, we can also see a potential head and shoulder.
COST Elliott Wave count: Wave (v) of {i}.
COST Technical Indicators: Getting closer to the 200EMA(purple line) which could offer support from where to start wave {ii}.
COST Trading Strategy: Looking for wave {ii} to come first before taking any action.
More By This Author:
Ethereum Elliott Wave Analysis, Sept. 1, 2022
SP500 Elliott Wave Analysis (iii) Of Iii) Of C Of (B) | Holding Short
Commodity Markets: Gold, Silver, Iron Ore, Natural Gas, Crude Oil, Copper


Comments
Log in or sign up to join the conversation.