Elliott Wave Technical Analysis: AAVE Token

Image Source: Pexels
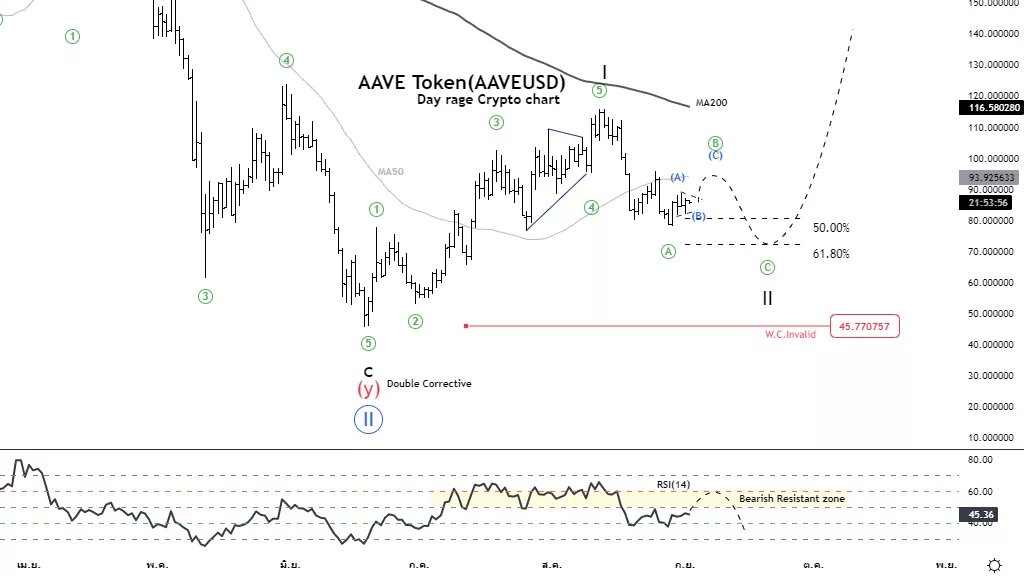
Elliott Wave Analysis TradingLounge Daily Chart, 2 September 2022, AAVE Token(AAVEUSD)
AAVEUSD Elliott Wave Technical Analysis
Function: Counter trend
Mode: Corrective
Structure: Zigzag
Position: Wave ((B))
Direction Next higher Degrees: Wave II of Motive Details: The rise of wave ((B)), upon completion, the price will fall again on wave ((C)).
Wave Cancel invalid Level: 45.770757
AAVE Token(AAVEUSD) Trading Strategy: Short term, the price tends to test the resistance at the MA50 or MA200 line to continue downwards. Looking for a longer-term opportunity, it may be necessary to wait for wave II to complete to trade again in the uptrend.
AAVE Token(AAVEUSD) Technical Indicators: RSI entering bearish resistance zone
Analyst: Kittiampon Somboonsod

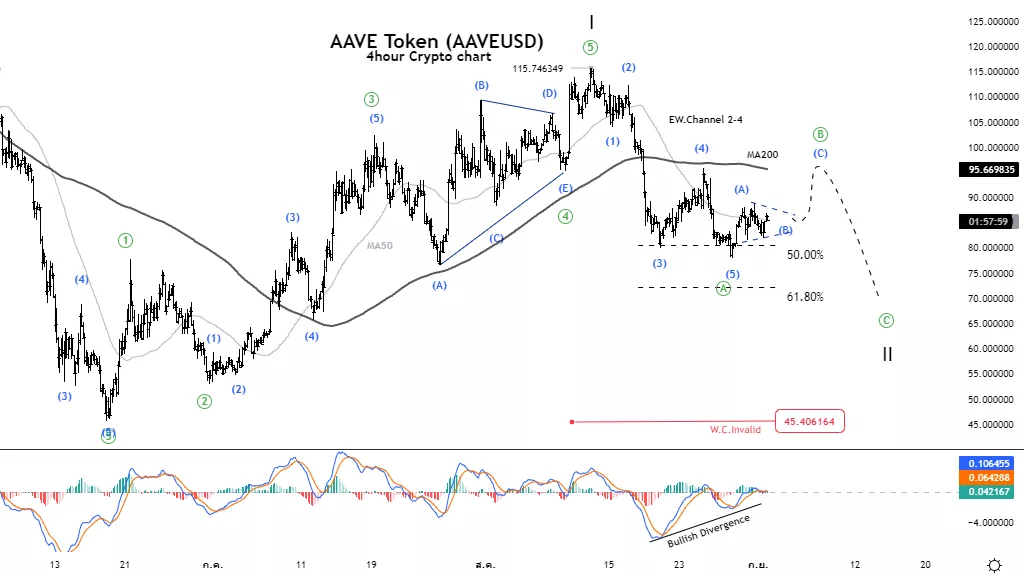
Elliott Wave Analysis TradingLounge 4H Chart, 2 September 2022, AAVE Token(AAVEUSD)
AAVEUSD Elliott Wave Technical Analysis
Function: Counter trend
Mode: Corrective
Structure: Zigzag
Position: Wave ((B))
Direction Next higher Degrees: Wave II of Motive Details: The rise of wave ((B)), upon completion, the price will fall again on the wave ((C)).
Wave Cancel invalid Level: 45.770757
AAVE Token(AAVEUSD) Trading Strategy: Short term, the price tends to test the resistance at the MA50 or MA200 line to continue downwards. Looking for a longer-term opportunity, it may be necessary to wait for wave II to complete to trade again in the uptrend.
AAVE Token(AAVEUSD) Technical Indicators: MACD bull-ish divergence signal.

More By This Author:
Elliott Wave Technical Analysis: Costco Wholesale Corp.
Ethereum Elliott Wave Analysis, Sept. 1, 2022
SP500 Elliott Wave Analysis (iii) Of Iii) Of C Of (B) | Holding Short
Disclosure: As with any trading or investment opportunity there is a risk of making losses especially in day trading or investments that Trading Lounge expresses opinions on. Note: Historical ...
more


