

Image Source: Unsplash
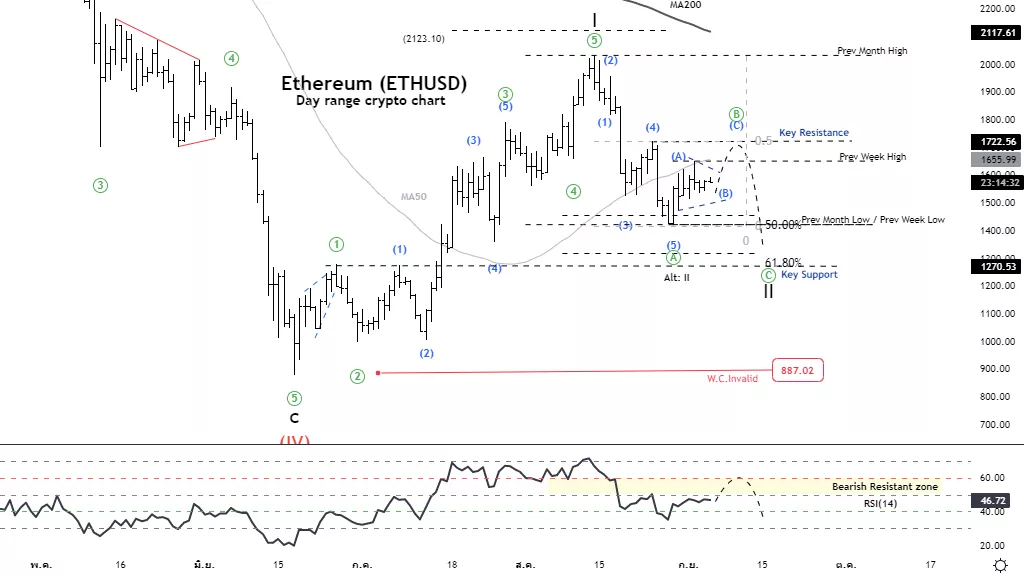
Function: Counter trend
Mode: Corrective
Structure: Zigzag
Position: Wave A
Direction Next higher Degrees: Impulse wave (II)
Details: A decrease in wave ((A)) first increases in wave ((B)) and decreases again in wave
((C)).
Wave Cancel invalid Level: 887.02
Ethereum(ETHUSD) Trading Strategy: The price range tends to test resistance at 1722 and continue downward in wave C, providing a short-term trading opportunity in the downtrend.
Ethereum(ETHUSD) Technical Indicators: RSI to test bearish resistaresistan
ETHUSD Elliott Wave Technical Analysis
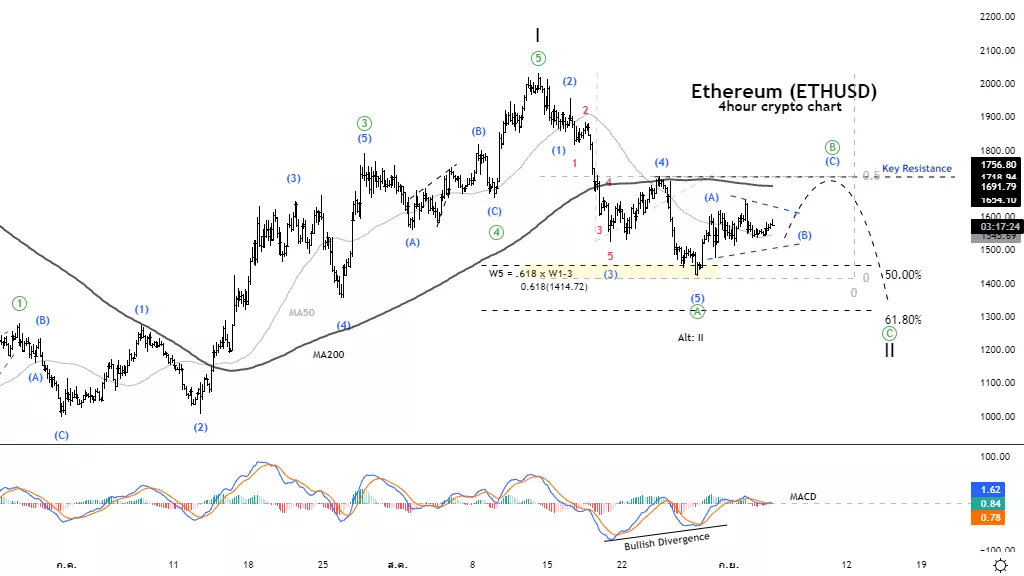
Function: Counter trend
Mode: Corrective
Structure: Flat
Position: Wave (4)
Direction Next higher Degrees: Sub-wave in wave ((A)) of Zigzag
Details: A decrease in wave ((A)) first increases in wave ((B)) and decreases again in wave ((C)).
Wave Cancel invalid Level:
Ethereum(ETHUSD)Trading Strategy: The price range tends to test resistance at 1722 and continue downward in wave C, providing a short-term trading opportunity in the downtrend.
Ethereum(ETHUSD) Technical Indicators: MACD bullish divergence signal
ETHUSD Elliott Wave Technical Analysis
Function: Counter trend
Mode: Corrective
Structure: Zigzag
Position: Wave A
Direction Next higher Degrees: Impulse wave (II)
Details: A decrease in wave ((A)) first increases in wave ((B)) and decreases again in wave ((C)).
Wave Cancel invalid Level: 887.02
Ethereum(ETHUSD) Trading Strategy: The price range tends to test resistance at 1722 and continue downward in wave C, providing a short-term trading opportunity in the downtrend.
Ethereum(ETHUSD) Technical Indicators: RSI to test bearish resistance.
ETHUSD Elliott Wave Technical Analysis
Function: Counter trend
Mode: Corrective
Structure: Flat
Position: Wave (4)
Direction Next higher Degrees: Sub-wave in wave ((A)) of Zigzag
Details: A decrease in wave ((A)) first increases in wave ((B)) and decreases again in wave ((C)).
Wave Cancel invalid Level:
Ethereum(ETHUSD)Trading Strategy: The price range tends to test resistance at 1722 and continue downward in wave C, providing a short-term trading opportunity in the downtrend.
Ethereum(ETHUSD) Technical Indicators: MACD bullish divergence signal.
More By This Author:
Elliott Wave Technical Analysis: AAVE Token
Elliott Wave Technical Analysis - PepsiCo Inc.
Elliott Wave Technical Analysis: Costco Wholesale Corp.


Comments
Log in or sign up to join the conversation.