

Image Source: Unsplash
Analog Devices Inc., Elliott Wave Technical Analysis
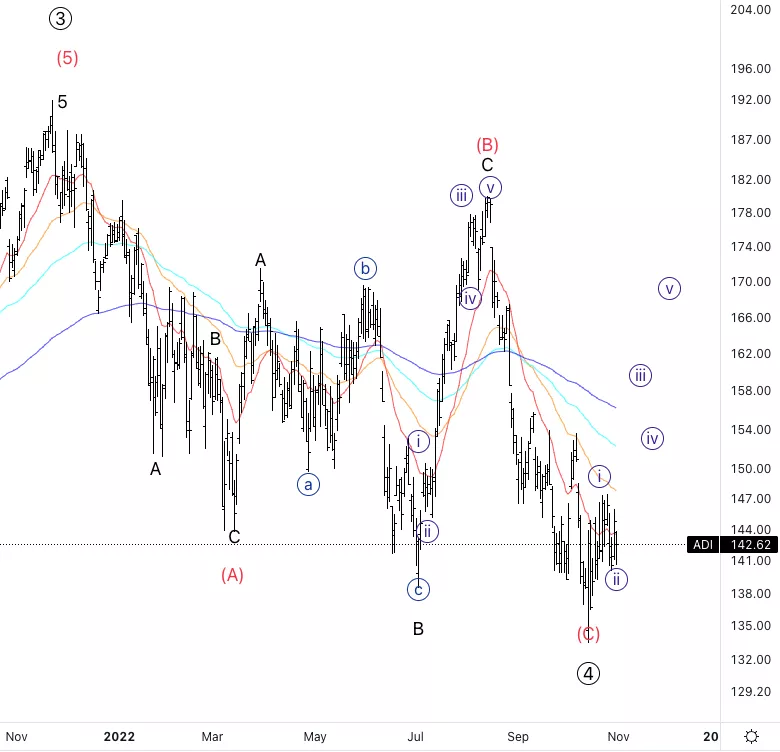
Analog Devices Inc., (Nasdaq: ADI) Daily Chart, November 1, 2022,
ADI Stock Market Analysis: We have a potential three-wave move which seems complete and we can see a potential leading diagonal in a wave 1 position forming off the lows.
ADI Elliott Wave Count: Wave {i} of 1.
ADI Technical Indicators: Below are all EMAs, moving around the 20EMA.
ADI Trading Strategy: Wait for further confirmation before considering long-term positions.
Analyst: Alessio Barretta
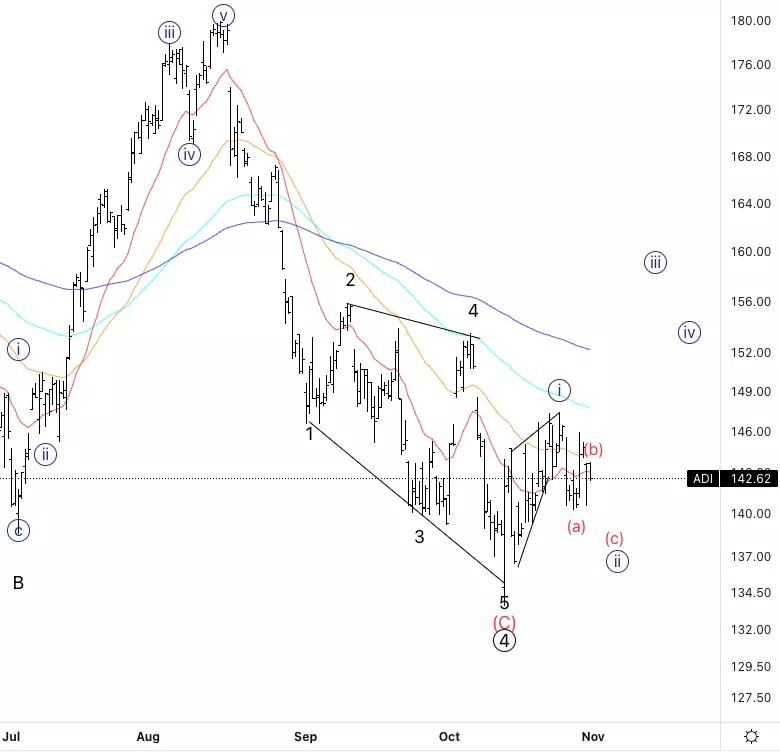
Analog Devices Inc., ADI: 4-hour Chart, November 1, 2022
Analog Devices Inc., Elliott Wave Technical Analysis
ADI Stock Market Analysis: Looking for one more move lower into wave (c) to complete potential wave {ii}.
ADI Elliott Wave count: Wave (c) of {ii}.
ADI Technical Indicators: Below all EMAS.
ADI Trading Strategy: wait for wave (c) to be completed before looking for longs, eventually you may even take a risk and take a quick short on a potential wave (c).
More By This Author:
Elliott Wave Technical Analysis: Bitcoin, Nov. 1
Elliott Wave Technical Analysis: Honeywell International Inc., Oct. 31
Theta Token Elliott Wave Technical Analysis - Oct. 31, 2022


Comments
Log in or sign up to join the conversation.