Elliott Wave Technical Analysis: Bitcoin, Nov. 1
Bitcoin

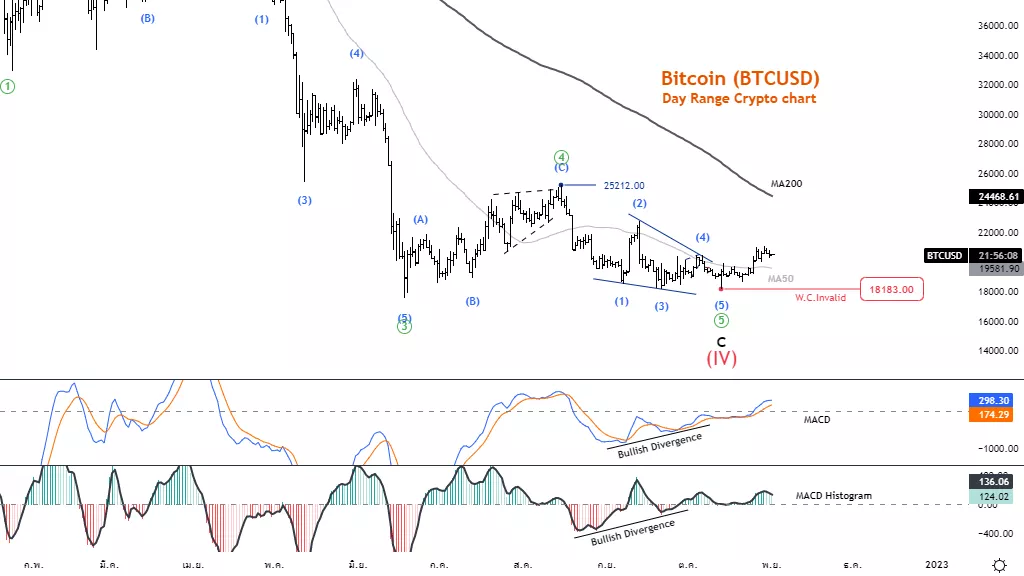
BTCUSD Elliott Wave Technical Analysis
Function: Follow trend
Mode: Motive
Structure: Impulse
Position: Wave (1)
Direction Next higher Degrees: Sub-wave of Wave ((1))
Details: Wave C is likely to end and the price is expected to trade above the 25212 level, but it
must not reverse below 18183.
Wave Cancel invalid level: 18183.
Bitcoin (BTCUSD) Trading Strategy: Wave C is likely to end and the price is expected to trade above the 25212 level but must not reverse below 18183. This could be an opportunity
to join a larger trend. But may have to wait for a shortening of the price after testing the key resistance at the MA200 line.
Bitcoin (BTCUSD) Technical Indicators: MACD and MACD Histogram has a bullish
divergence The price has a chance to turn into an Uptrend.
Tradinglounge analyst : Kittiampon Somboonsod

Bitcoin (BITCOMP)
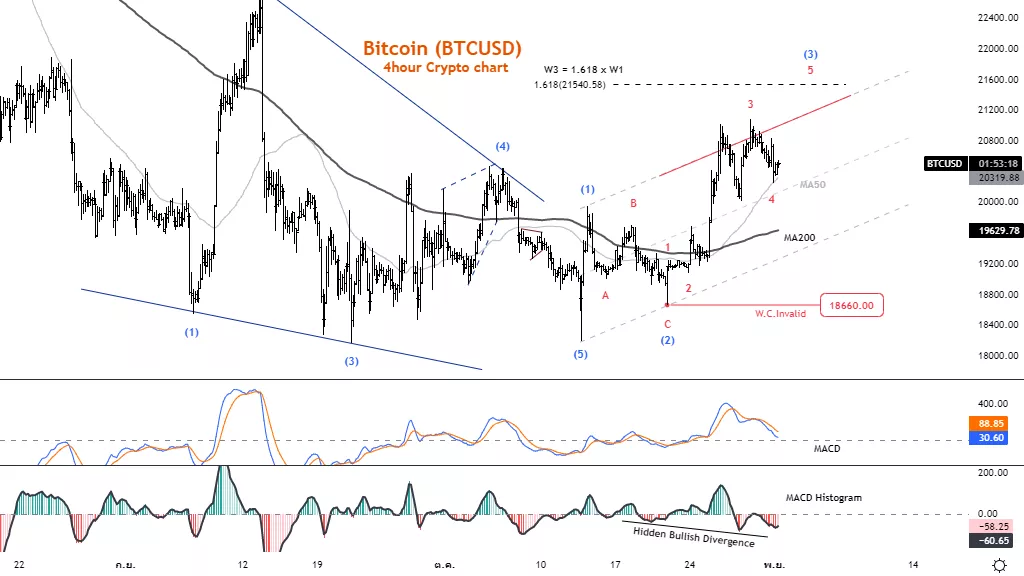
BTCUSD Elliott Wave Technical Analysis
Function: Follow trend
Mode: Motive
Structure: Impulse
Position: Wave (3)
Direction Next higher Degrees: Sub-wave of Wave ((1))
Details: Wave 3 is usually 1.618 x wave 1 at 21540. but must not reverse below 256.4
Wave Cancel invalid level: 18183.
Bitcoin (BTCUSD) Trading Strategy: The rise of wave 3 tends to be unfinished and the price has a chance to rise again in wave 5 when wave 4 ends. This could be a short-term
buying opportunity.
Bitcoin (BTCUSD) Technical Indicators: MACD Histogram has a hidden bullish divergence. The price has a chance to turn into an Uptrend.

More By This Author:
Elliott Wave Technical Analysis: Honeywell International Inc., Oct. 31
Theta Token Elliott Wave Technical Analysis - Oct. 31, 2022
SP500 NASDAQ RUSSELL 200 DJI Elliott Wave Analysis
Disclosure: As with any trading or investment opportunity there is a risk of making losses especially in day trading or investments that Trading Lounge expresses opinions on. Note: Historical ...
more


