Theta Token Elliott Wave Technical Analysis - Oct. 31, 2022
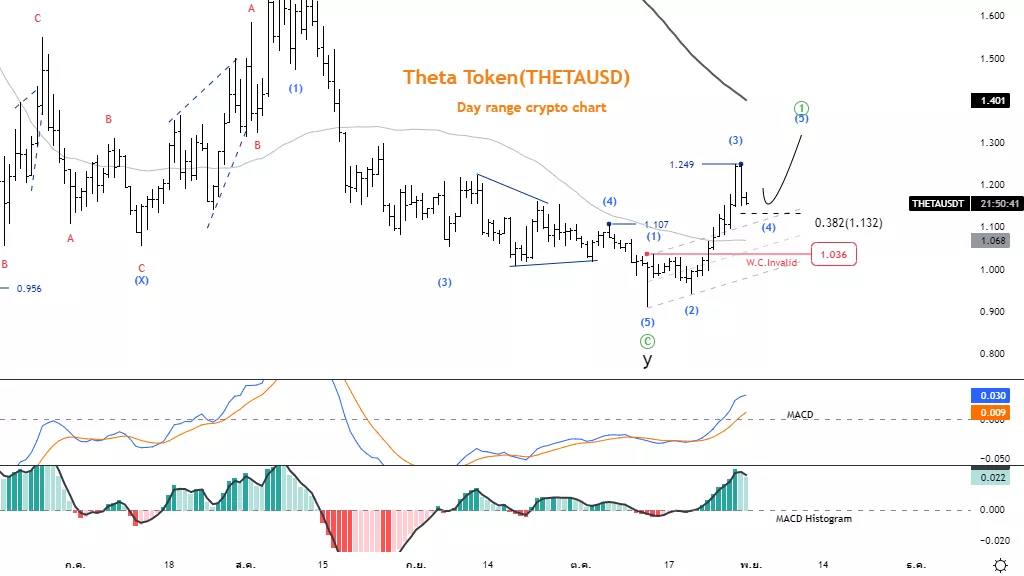
Elliott Wave Analysis TradingLounge Daily Chart, 31 October 2022,
Theta Token(THETAUSD)
THETAUSD Elliott Wave Technical Analysis
Function: Counter trend
Mode: Corrective
Structure:?
Position: A
Direction Next higher Degrees: wave (4) of Motive
Details: Pull back in wave 4, But must not be below 1.036
Wave Cancel invalid Level: 1.036
Theta Token(THETAUSD) Trading Strategy: The decline of wave 4 is usually .382 x the length of wave 3, allowing us to consolidate the trend again in wave 5, opening up short-term speculation opportunities. The target price has a chance to test the MA200 line at 1.40 level.
Theta Token(THETAUSD) Technical Indicators: MACD and MACD Histogram above Zero-LIneé Momentum is Bullish.
(Click on image to enlarge)

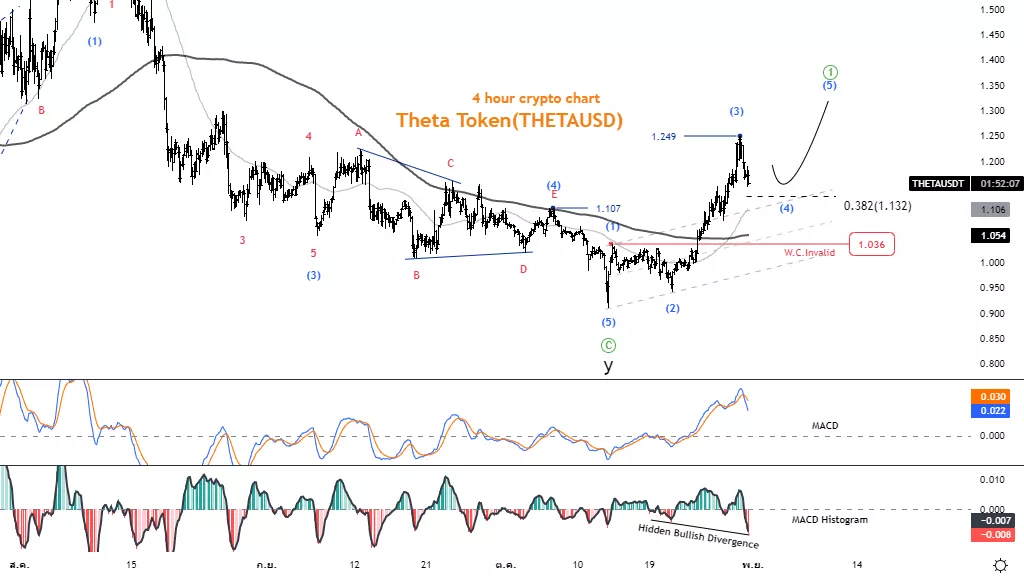
Theta Token(THETAUSD)
THETAUSD Elliott Wave Technical Analysis
Function: Counter trend
Mode: Corrective
Structure:?
Position: A
Direction Next higher Degrees: wave (4) of Motive
Details: Pull back in wave 4, But must not be below 1.036
Wave Cancel invalid Level: 1.036
Theta Token(THETAUSD) Trading Strategy: The decline of wave 4 is usually .382 x the length of wave 3, allowing us to consolidate the trend again in wave 5, opening up short-term speculation opportunities. The target price has a chance to test the MA200 line at 1.40 level.
Theta Token(THETAUSD) Technical Indicators: MACD Histogram has a hidden bullish divergence The price has a chance to turn into an Uptrend.
(Click on image to enlarge)

More By This Author:
SP500 NASDAQ RUSSELL 200 DJI Elliott Wave Analysis
Elliott Wave Technical Analysis: Intel Corp.
Elliott Wave Technical Analysis: Chainlink - Friday, Oct. 28
Disclosure: As with any trading or investment opportunity there is a risk of making losses especially in day trading or investments that Trading Lounge expresses opinions on. Note: Historical ...
more


