

Image Source: Unsplash
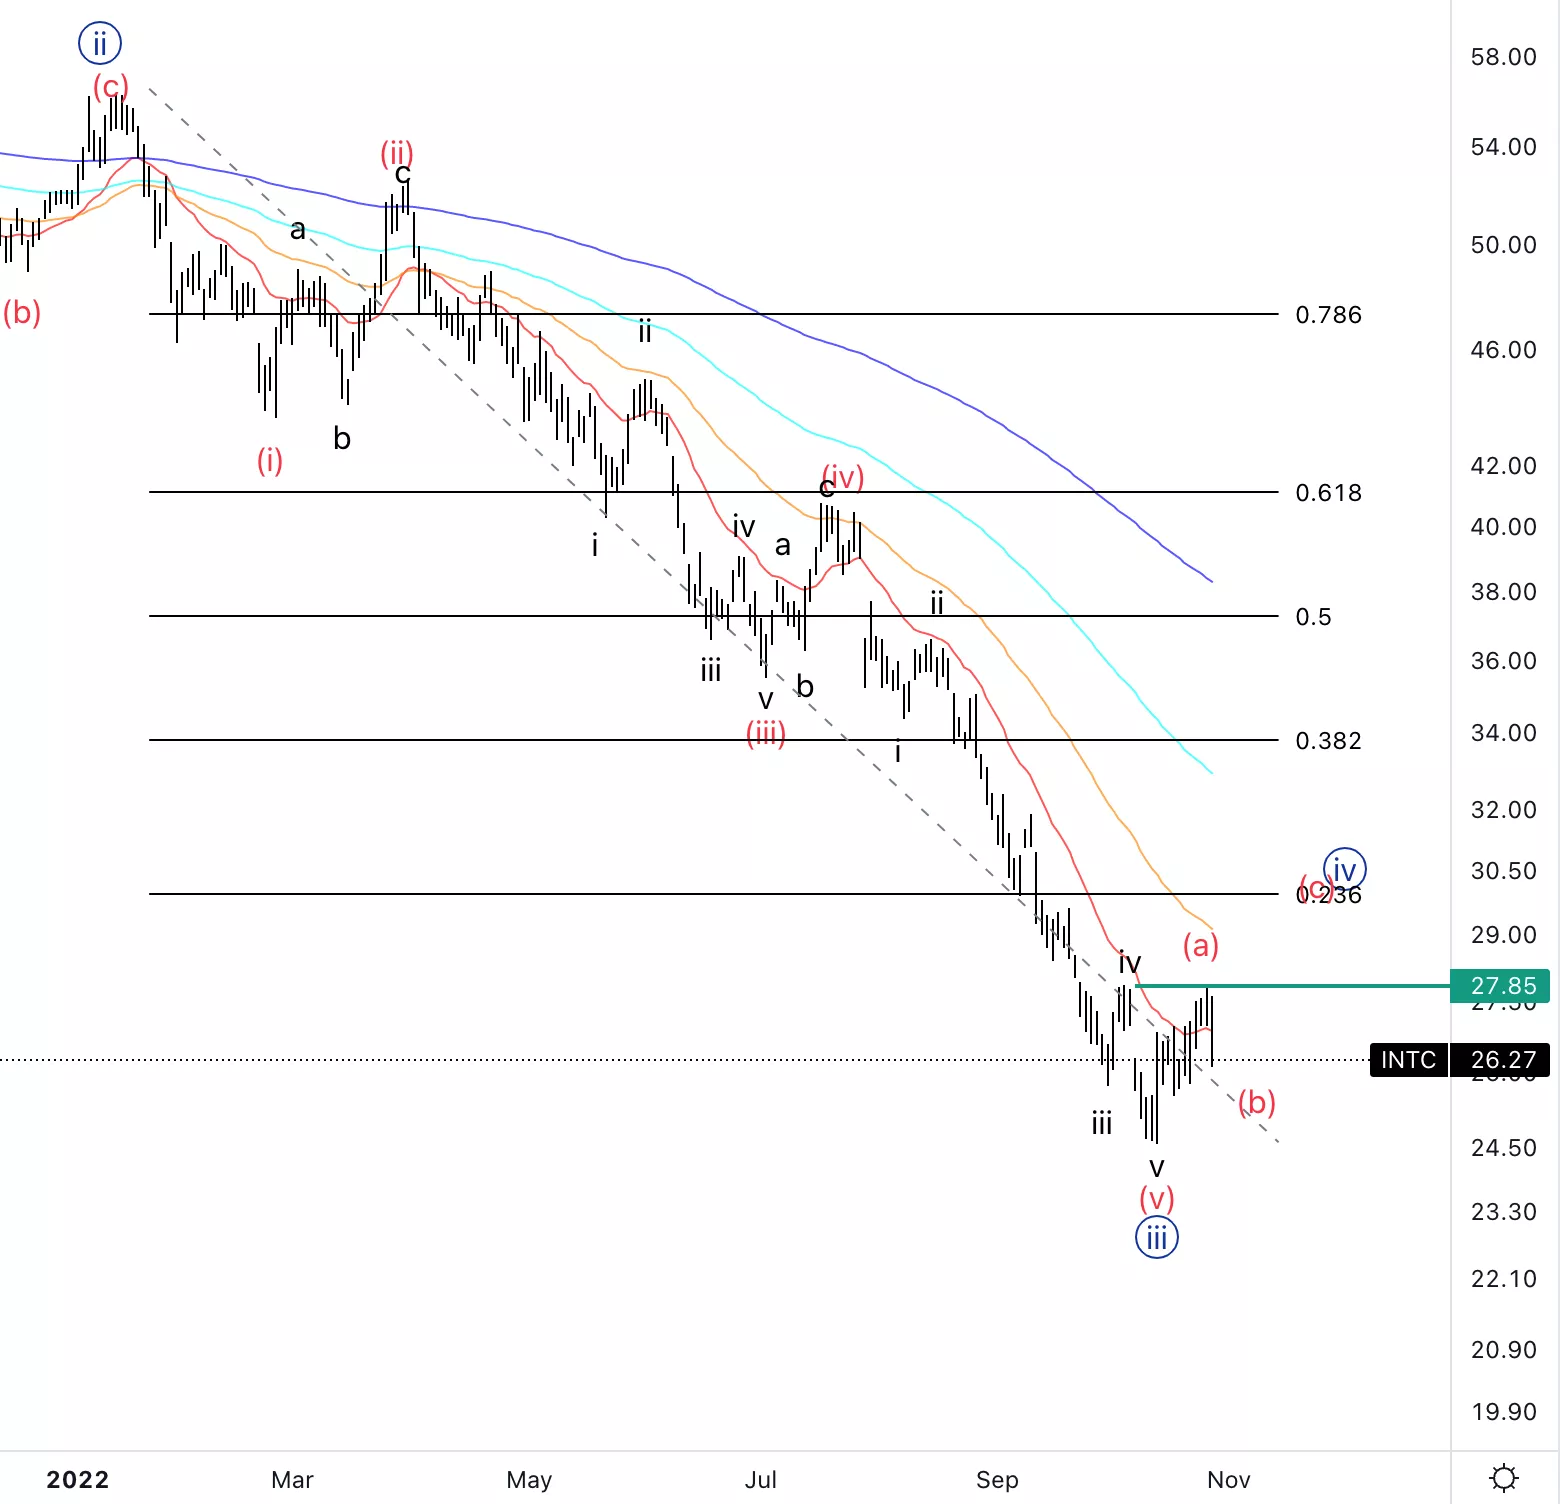
Intel Corp., Elliott Wave Technical Analysis
Intel Corp., (Nasdaq: INTC): Daily Chart, October 28, 2022,
INTC Stock Market Analysis: Pulling back as predicted in the last forecast. I would attribute a higher probability to the scenario where we just finished wave (a) of {iv}. Alternatively, we had some sort of wave four to a lesser degree.
INTC Elliott Wave count: Wave (a) of {iv}.
INTC Technical Indicators: Rejecting the 20EMA.
INTC Trading Strategy: Waiting for confirmation before placing shorts.
Analyst: Alessio Barretta
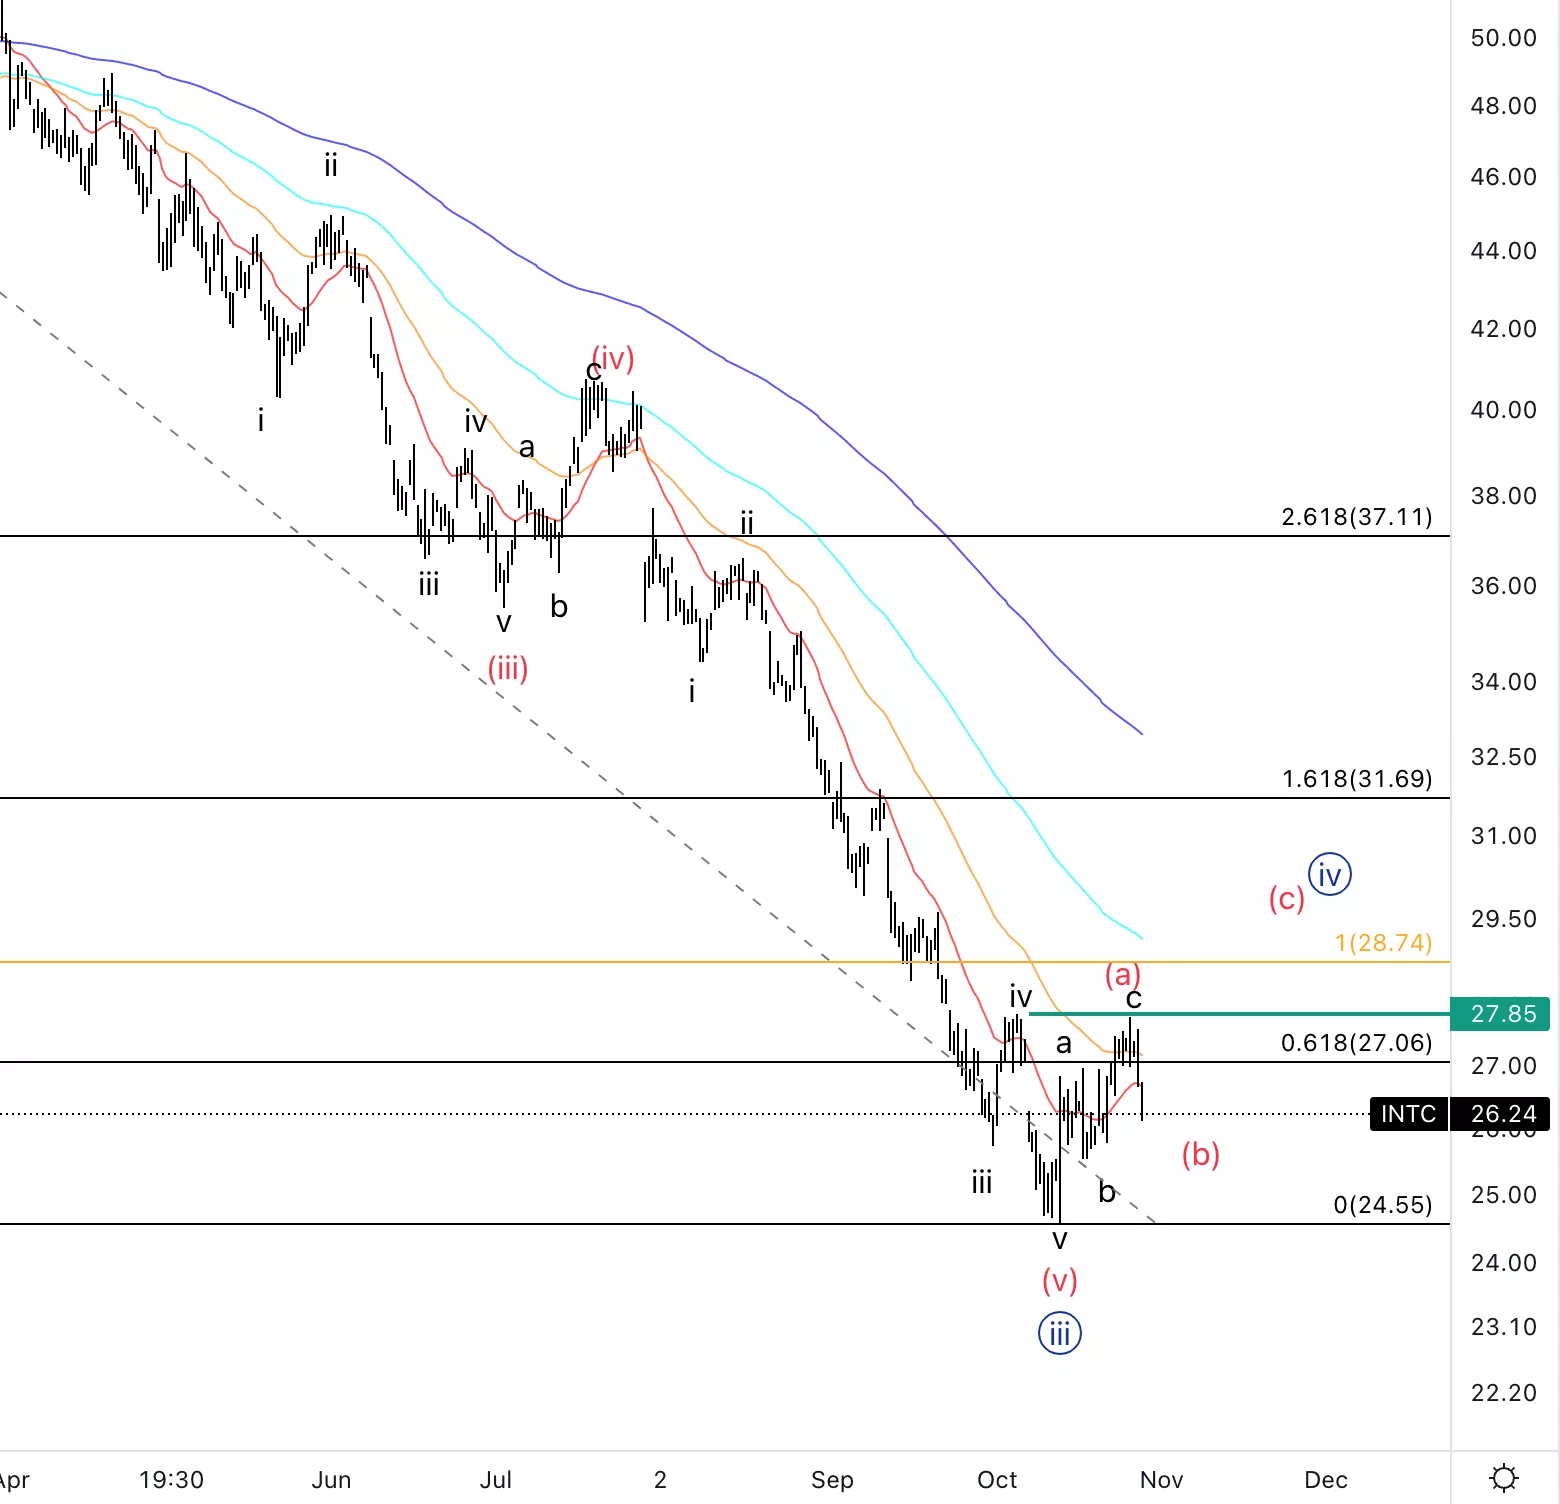
Intel Corp., INTC: 4-hour Chart, October 28, 2022
Intel Corp., Elliott Wave Technical Analysis
INTC Stock Market Analysis: Potentially wave (a) finished, we have equality of {ii} and {iv} at28.7$(orange line) as I expect to find some support as we approach the area of wave b of (a).
INTC Elliott Wave count: Wave a of (b).
INTC Technical Indicators: Below all EMAs
FTNT Trading Strategy: Looking for support in the area of wave b to place short-term longs into wave (c). This setup requires confirmation as it is a counter-trend approach.
More By This Author:
Elliott Wave: DAX 40 Index Chart And Forecasts
Stock Market Elliott Wave Analysis Possible Top In Place | Short Trades
Elliott Wave Technical Analysis: Fortinet Inc.


Comments
Log in or sign up to join the conversation.