

Honeywell International Inc., Elliott Wave Technical Analysis

Image via Honeywell
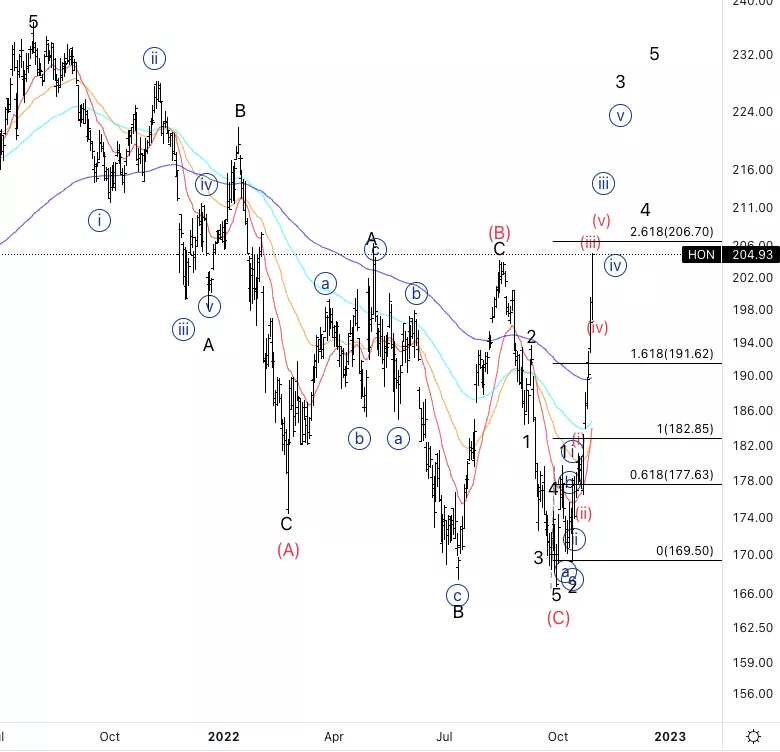
Honeywell International Inc., (HON): Daily Chart, October 31 2022,
HON Stock Market Analysis: Moving exactly as predicted form the previous update. We mentioned how to have confirmation we were expecting a sharp move to the upside to confirm the nest scenario and it eventually came.
HON Elliott Wave count: Wave {iii} of 3.
HON Technical Indicators: Above all EMAs.
HON Trading Strategy: Build long positions on the next significant pullback, most likely in wave(iv)
TradingLounge Analyst: Alessio Barretta
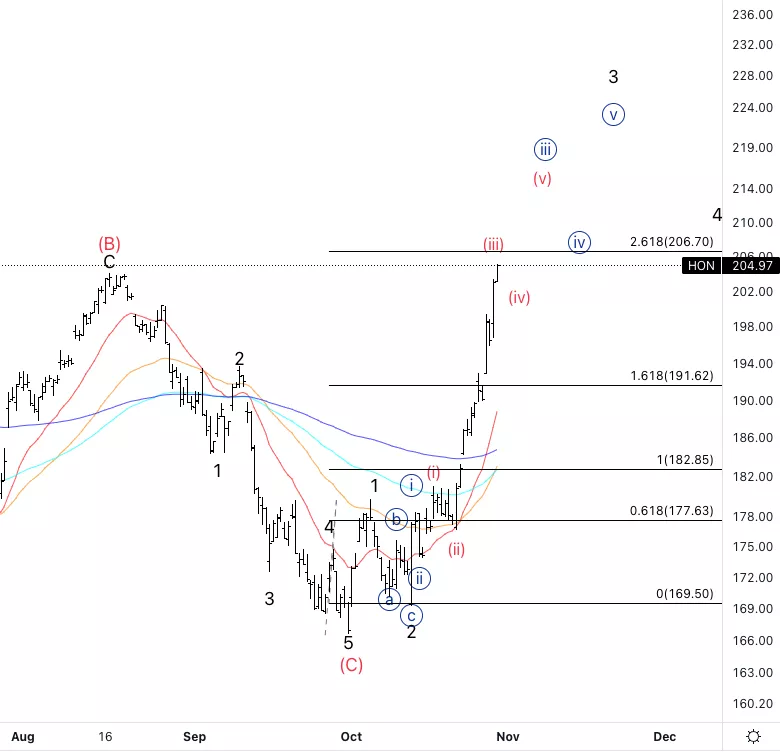
Honeywell International Inc., HON: 4-hour Chart, October 31 2022
Honeywell International Inc., Elliott Wave Technical Analysis
HON Stock Market Analysis: Looking for a series of threes and fours to keep taking us higher.
HON Elliott Wave count: Wave (iii) of {iii}.
HON Technical Indicators: Above all EMAS.
HON Trading Strategy: Build long positions on the next significant pullback, most likely in wave(iv).
More By This Author:
Theta Token Elliott Wave Technical Analysis - Oct. 31, 2022
SP500 NASDAQ RUSSELL 200 DJI Elliott Wave Analysis
Elliott Wave Technical Analysis: Intel Corp.



Comments
Log in or sign up to join the conversation.