


While the S&P 500 and Nasdaq 100 continue to draw support from a narrow group of large technology and AI stocks, market breadth is deteriorating sharply. The weakness is becoming more evident in the Dow and the small-cap Russell 2000, raising questions about how long the broader market can remain insulated from mounting economic and financial pressures. Are we about to see a correction?
Bond markets signal growing economic strain
As mentioned, the Dow Jones index has become the first of the major US index to show clear signs of a breakdown, exposing the growing weakness beneath the surface. Meanwhile the bond market is adding to those concerns. With Treasury yields surging, mortgage rates climbing and expectations shifting towards further interest rate hikes, the prospect of a deeper equity market correction is becoming increasingly difficult to dismiss.
The recent surge in bond yields is beginning to feed through to the real economy. The average interest rate on a 30-year US mortgage has climbed to 7.60%, its highest level since November 2023, as the 10-year Treasury yield broke above 5.30%, reaching its highest level since April 2002.
The shift in interest rate expectations has been dramatic. Bond markets are now pricing in four further 25-basis-point rate hikes by June 2027, a stark reversal from the outlook at the start of the year, before the US-Iran war, when investors were anticipating at least 100 basis points of rate cuts over the same period.
Persistently elevated oil prices are adding to inflationary pressures, complicating the outlook for central banks and making it harder for policymakers to ease monetary conditions. The Bloomberg Commodity Index has risen 37.3% year on year, putting it on course for one of its largest 12-month gains since the 2022 energy crisis.
This renewed surge in commodity prices is reinforcing concerns that inflation could prove more persistent than previously expected, just as borrowing costs are rising. For equity markets, the combination of higher yields, tighter financial conditions and mounting inflation risks presents an increasingly challenging backdrop.
Market breadth deteriorates sharply
The weakness beneath the surface of the US stock market is becoming harder to ignore. Just 25% of S&P 500 constituents are now trading above their 50-day moving averages, down sharply from around 70% in mid-August. This is the lowest proportion since 2 April and the second-lowest reading since the April 2025 Liberation Day sell-off.
The deterioration is not limited to shorter-term price trends. Only 47% of S&P 500 stocks are trading above their 200-day moving averages, also the lowest proportion since 2 April, suggesting that the weakness is increasingly extending into the market's longer-term structure.
Meanwhile, new 52-week lows on the New York Stock Exchange outnumbered new highs for a 10th consecutive session on Monday, and in 14 of the past 15 trading sessions.
Taken together, these indicators point to a significant deterioration in market breadth. The headline indices may still appear relatively resilient, but the underlying picture is considerably weaker, with gains increasingly concentrated in a narrow group of mega-cap technology and AI stocks. Such a divergence raises questions about the sustainability of the broader rally, particularly as financial conditions tighten.
Dow Technical analysis
The Dow Jones chart is looking particularly weak compared with its major US peers. The index staged a strong rally towards the end of July, but much of that advance has since been unwound. More recently, it has broken below the low that marked the beginning of that rally, around the 51,500 level, raising the risk of further losses and potentially putting pressure on other major indices.
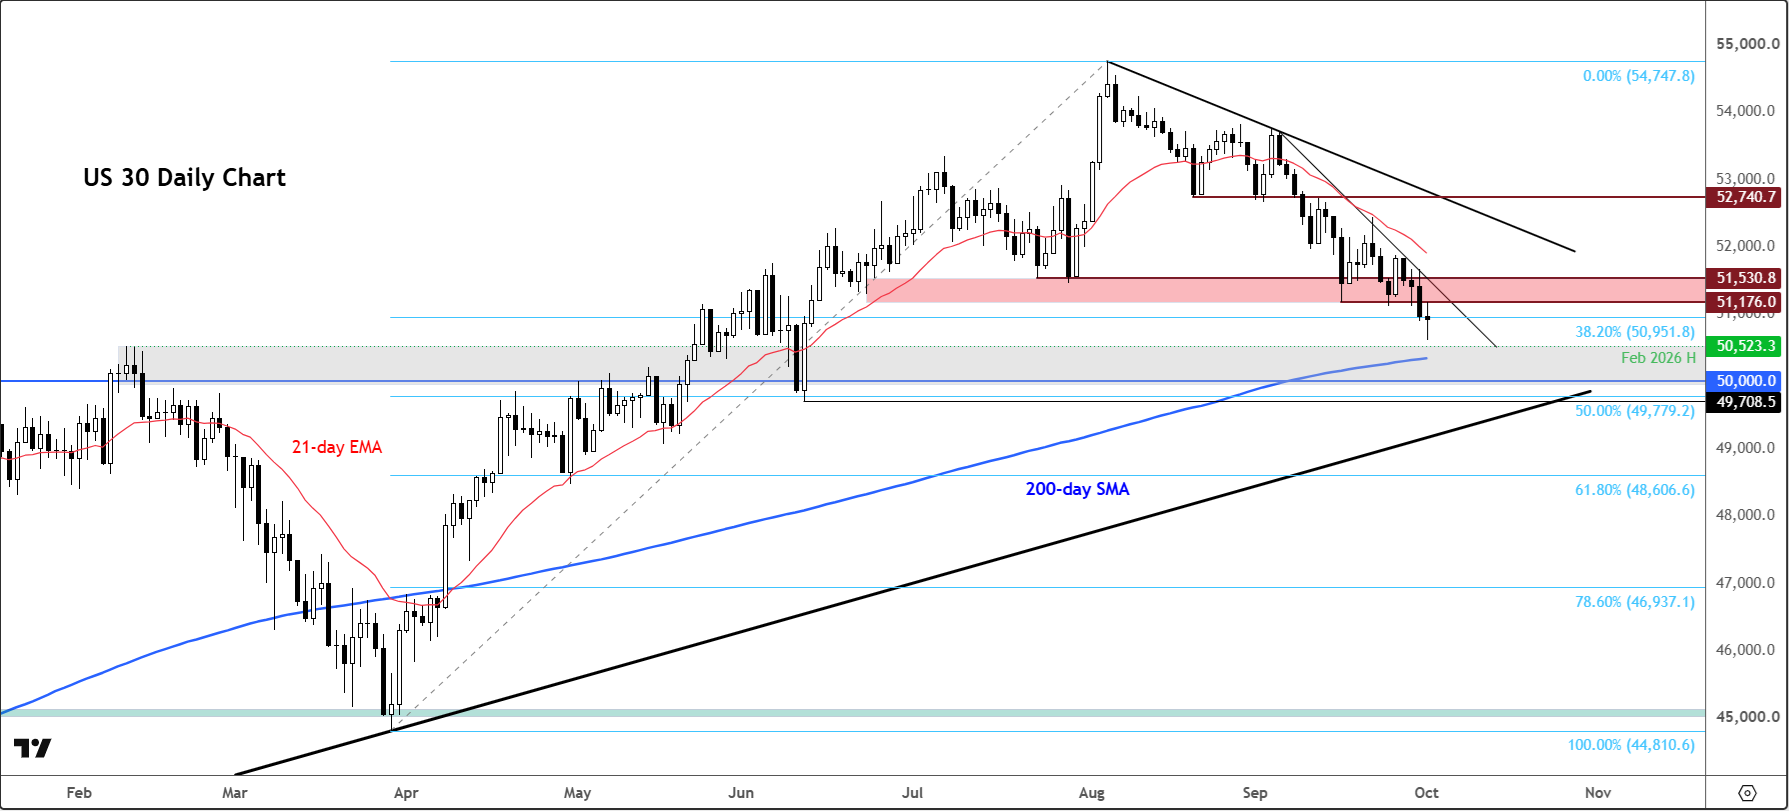
The 51,175–51,530 area is now a key level to watch. If the Dow establishes a sustained move below this former support zone, the next significant downside target could be around 50,000. There are, however, some intermediate levels to consider, including the February high at 50,523 and the 200-day moving average, currently near 50,300.
The short-term trend remains bearish. Since peaking on 5 August, the Dow has consistently formed lower highs and lower lows, while slipping below its 21-day exponential moving average. The price action points to persistent selling pressure, with buyers yet to demonstrate that they can regain control.
For the technical outlook to improve, the index would need to break above its short-term descending trendline. A move back above the 21-day exponential moving average would provide further evidence that the recent downtrend may be losing momentum and that the broader recovery could be resuming.
For now, however, the Dow continues to look vulnerable. The risks appear tilted towards further downside, particularly given the deterioration in market breadth and the increasingly challenging backdrop created by rising Treasury yields, elevated oil prices and shifting expectations for US interest rates.
The key question is whether the Dow’s breakdown is an isolated development or an early indication of broader weakness across US equities. With bond markets signalling tighter financial conditions and fewer stocks participating in the rally, the coming sessions could prove important in determining whether the weakness spreads to the S&P 500 and Nasdaq 100.



Comments
Log in or sign up to join the conversation.