


US index futures declined with global indices, extending their falls from Wednesday. We have also seen fresh gains for the dollar and bond yields, while gold, silver and bitcoin (BTC.X) have all eased lower along with stocks and foreign currencies. With fewer stocks supporting the recent rally, and now bond yields breaking amid increasing worries about the fiscal health of the US and expectations of further Federal Reserve tightening, the risks of a larger correction have increased for the US stock markets.
Risk appetite has been hit in the last few days after last week’s post-FOMC pop faded amid rising interest rate expectations, higher oil prices and a strengthening US dollar. The S&P 500 index has fallen sharply for the second day. As before, I wasn’t convinced the markets would remain supported in the current macro backdrop. Yesterday saw the risk-off tone gather pace due largely to the slump in the bond markets as yields broke out across the curve. Yields were also helped in part by some forecast-beating US macro data and hawkish Fed commentary.
Trump-Xi meeting is important but not as important as bond market implosion
Risk appetite is likely to stay low while crude oil stays elevated, supporting the dollar and bond yields. But today, the focus will be on the summit between Donald Trump and Xi Jinping. It remains to be seen how the markets may react to this. Any agreements to further extend the trade truce should be mildly risk-positive, but this is already priced in. Agreements on AI will be welcomed by the markets.
Still, the bigger story is the breakout in yields. This is one of the main reasons why growth stocks and other low- and zero-yielding assets have come under pressure. We have seen the US 10-year yields soar above 5.0% and 30-year yields are testing the 2007 highs. The further yields rise, the more pressure they will likely exert on the markets.
Fewer stocks carrying the market than at any time since the dot-com peak
Yesterday’s sharp drop and the follow-up selling in futures so far today should not have come as a surprise. Fewer stocks have been carrying the market than at any time since the dot-com peak.
The S&P 500’s recent rally back to near-record territory, before Wednesday’s drop, has been powered by a small number of stocks.
As of Tuesday’s close, 52% of individual member stocks in the S&P were trading below their long-term 200-day moving averages, according to MarketWatch. This is a reflection of the fact that a handful of stocks, chiefly hyperscalers and semiconductor stocks, have been doing much of the heavy lifting lately. Check out the latest stock heatmap to see which names and sectors are moving today.
The last time there were that many S&P 500 components below their 200-day moving averages with the index within 1% of its record high was indeed March 2000 — right around the dot-com bubble peak.
Additionally, MarketWatch has highlighted that as of Monday, about 60% of the stocks in the S&P 500 were down more than 20% from their all-time highs.
So, there is the threat of weak stock-market breadth, rising credit spreads, and rising nominal Treasury yields.
S&P 500 Technical analysis
From a technical analysis point of view, the S&P 500 is still in a bullish trend, and most of the key support levels remain intact. That means, for now at least, there is still no confirmation that the market has peaked.
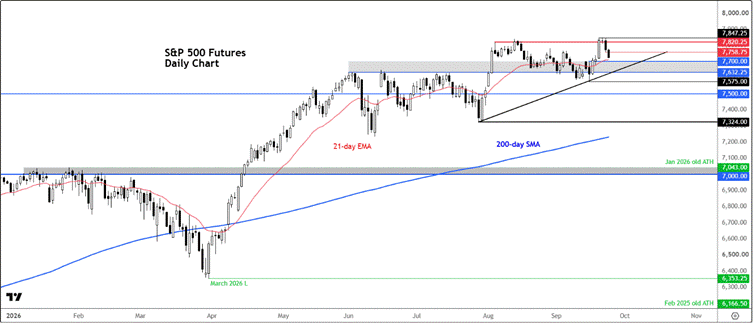
However, the fact that we have tested the 7,820 level on a few occasions and failed to break through it cleanly does raise the risk that we may have seen at least a near-term peak.
Similar price action has been observed in the past, though, before the market eventually rallied above such levels. So that remains another scenario.
The macro backdrop may be suggesting otherwise, but from a purely technical analysis point of view, further confirmation is needed before we can say that the bullish trend is over.
The market is now approaching a few important levels, starting with 7,700, which is an important short-term support level. The 21-day exponential moving average is also coming in just above that level.
Below 7,700, we have the 7,632 area, which was previously resistance and is now turning into support. We also have a trend line converging around that zone.
The most recent low comes in at 7,575. That level is the real line in the sand for me - it needs to break for me to turn tactically bearish.
If that breaks, then in all likelihood the index may not only test the 7,500 level, but potentially break below it and head towards the lows seen over the summer, around 7,324.
And potentially even lower over time.
But we will cross that bridge when we get there. For now, let’s see whether the index can hold above these short-term support levels or whether it eventually breaks below them.



Comments
Log in or sign up to join the conversation.