


So every other dollar of the federal debt outstanding was sold to somebody, on a date, at a price, at an auction. Yet $387.6 of it was not.
That is the accumulated inflation compensation sitting on the TIPS book. The Treasury publishes it security by security, in a column of the monthly statement of the Public Debt called "Amount Adjusted for Inflation." Add it up across the 53 securities outstanding on 31 August, and you get $387.6 billion against $1,778.1 billion of par. That is 21.8%. Treasury's own total row says the same thing. It ties to Table 1's TIPS figure of $2,151.96 billion.
Now, nobody was ambushed here. Investors bid for these bonds knowing full well they would accrete. What is odd is the channel. That is the only debt stock that grows with no issuance event, no bid-to-cover, and no decision by anyone at Treasury.
Accretion stock from the Monthly Statement of the Public Debt Table 3, 31 August 2026, cross-checked against the30 June and 31 July reports.
I rate the iShares TIPS Bond ETF (TIP) a Hold at $105.27. It's a call about the mechanism of how the government finances itself, and about a trade I hunted for yet did not find.
Why This Is Not Just Accrued Interest
The obvious objection first. Interest accrues on every Treasury security between coupon dates, so what even makes TIPS special?
There is just one thing specifically. On a nominal note, accrued interest is not capitalised into principal and does not count in debt outstanding. It sits outside the stock until it gets paid. On TIPS, the inflation adjustment goes into the principal itself. Reported as outstanding, counted in the debt to the penny, repaid as principal at maturity.
It is the only category of federal interest that becomes debt before it becomes cash.
Britain Is Four Times Further Down This Road
Let's talk about the scale first. You have to know whether this is a problem or a curiosity.
On 31 December 2025, the UK held £433.4 billion of index-linked gilts at nominal, carrying £260.2 billion of accumulated inflation uplift. That is 60.0% of par. Ours is 21.8%. Index-linked gilts are 25.2% of the UK debt portfolio. TIPS are 6.76% of US marketable debt and falling down, from 7.02% a year ago.
The oldest UK linker carries an index ratio of 2.97705. Its principal has nearly tripled. Our worst is about 1.22.
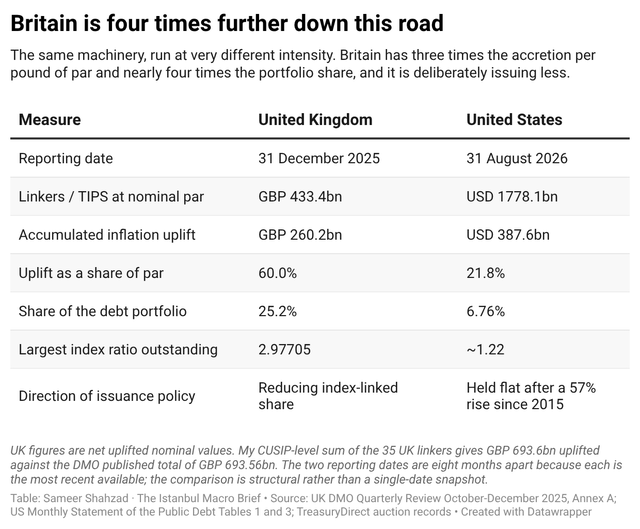
The policy part needs to be discussed. The UK has said it will reduce the proportion of index-linked issuance annually over the medium term, specifically to cut its inflation exposure. The United States took gross TIPS issuance from $155 billion in 2015 to $243 billion in 2025. That is up 57%, and on 4 August the Treasury Borrowing Advisory Committee recommended holding auction sizes where they are.
That is the same machinery. We are running it at a third the intensity and a quarter the share, and walking the opposite way from the country that already got burned.
How It Got Here
At the end of 2020, the accretion stock was $159.2 billion. 11.2% of par. By August 2022, it was $335.4 billion, 22.5%, and par had barely moved, from $1,420 billion to $1,490 billion.
$176 billion of principal was added to the national debt in twenty months by the Consumer Price Index. There was no issuance attached to any of it.
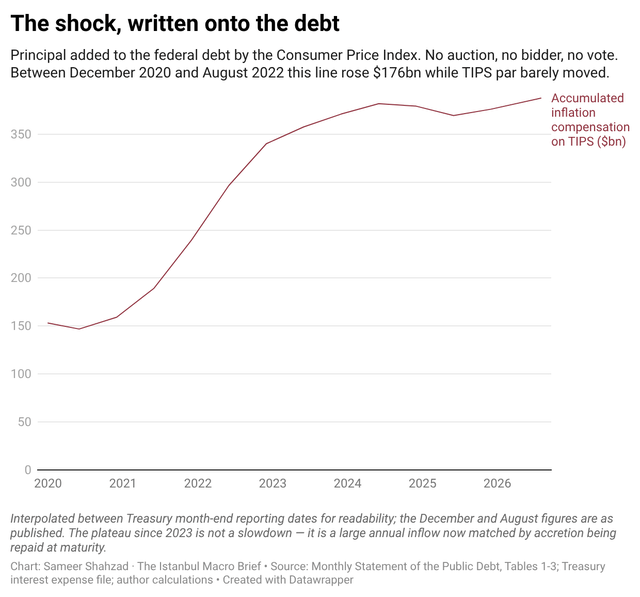
Since then, it looks flat. $379 billion, now $387.6 billion. That flatness is misleading. It did not stop growing; rather, it started paying out.
Two Legs, Doing Different Things
Treasury books the inflation adjustment as an interest outlay in the year it accrues, then pays no cash for it until maturity.
Eleven months of fiscal 2026: $70.13 billion accrued. Over the same twelve months, the stock rose $13.80 billion. The difference, which is about $56.3 billion, walked out as a cash maturity on obligations expensed years earlier.
The legs also react to inflation differently. Accrual runs on the whole par book. Repayment only picks up the inflation still left to accrue before specific bonds mature. Against 2028 maturities, the net is minus $15.3 billion at 3.4% inflation, minus $34.1 billion at 2.0%.
I first modelled the repayment legs as inflation-independent, which overstated the swing by about a third. Corrected here.
Three Reports, And You Can Watch It Happen
A claim like that needs checking against something other than itself, so I rebuilt the whole book from the last three MSPD releases and followed one bucket.
The securities maturing in 2026 looked like this. At 30 June, two of them: $75.10 billion of par carrying $22.70 billion of accretion. At 31 July, one: $38.30 billion of par carrying $8.65 billion. At 31 August, still one: $38.30 billion of par carrying $8.50 billion.
A TIPS matured on 15 July. It took $36.80 billion of par and $14.05 billion of accumulated inflation compensation off the balance sheet, in cash.
Then look at what happened to the survivor. Between the July and August reports, its accretion fell from $8.65 billion to $8.50 billion, down 1.7%. That is not a rounding artifact. August's reference CPI ran off the May and June prints, 335.123 to 333.952, which is minus 0.35%. So the month actually accrued backwards, with the published stock showing it.
Both legs, three reports, and the model agree with Treasury on a month when accretion went into reverse.
What Comes Due Is Not What Was Sold
On 15 October, CUSIP 91282CDC2 matures. Treasury sold $38.3 billion of it in late 2021 at real yields of minus 1.685% and minus 1.508%, the two most negative in the history of the programme. It pays out $46.8 billion.
Across the twelve months to 30 September 2027, five securities mature carrying $169.6 billion of par and $222.8 billion of cash due. Treasury refinances 31.4% more than the par it sold. Every published maturity wall plots par, so the requirement is understated by roughly a third.
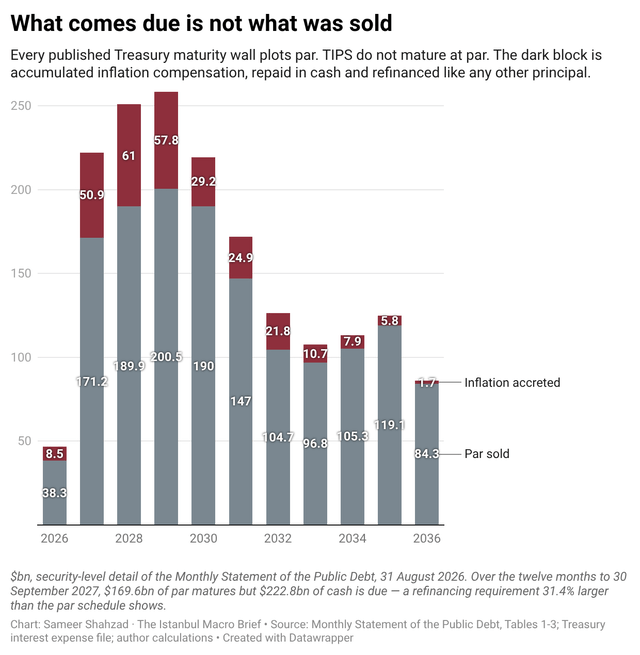
Then you have to size it honestly. That $54.3 billion of extra cash sits against $2,421.2 billion of growth in marketable debt over the past twelve months. It is 2.2% of the financing need.
So this fixes a line in a supply model. It does not move the aggregate. Honestly, anyone telling you a fifty-billion-dollar timing wedge reprices the Treasury market is selling you something.
Where The Size Stops Being The Point
The debt ceiling is where it bites.
The statutory limit is written on face amount. Treasury's own reconciliation starts at total public debt of $40,175.6 billion, subtracts $181.6 billion of unamortized discount, $3.6 billion of Federal Financing Bank paper, and $0.5 billion of other debt, and lands at $39,989.9 billion subject to the limit against a ceiling of $41,104.0 billion. Headroom: $1,114.1 billion.
Accretion is NOT on the subtraction list. All $387.6 billion of it counts.
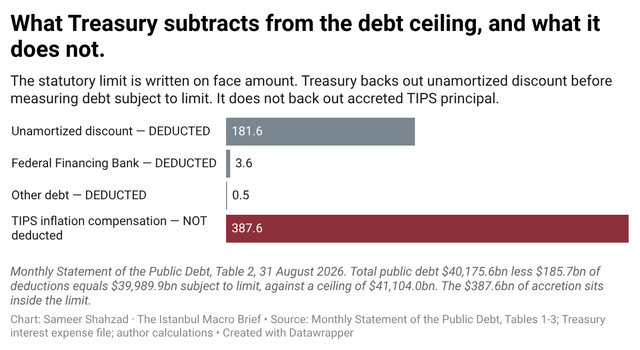
During a binding limit, debt subject to the limit is pinned at the cap, and the accretion carries on regardless. It is the single component Treasury cannot switch off, defer, or negotiate.
This has happened twice already. Headroom sat at exactly zero from August through November 2021. Again from January to May 2023. Run the monthly accretion line through those windows, and you get $31.3 billion and $24.4 billion of ceiling eaten by the CPI while Treasury was already burning extraordinary measures.
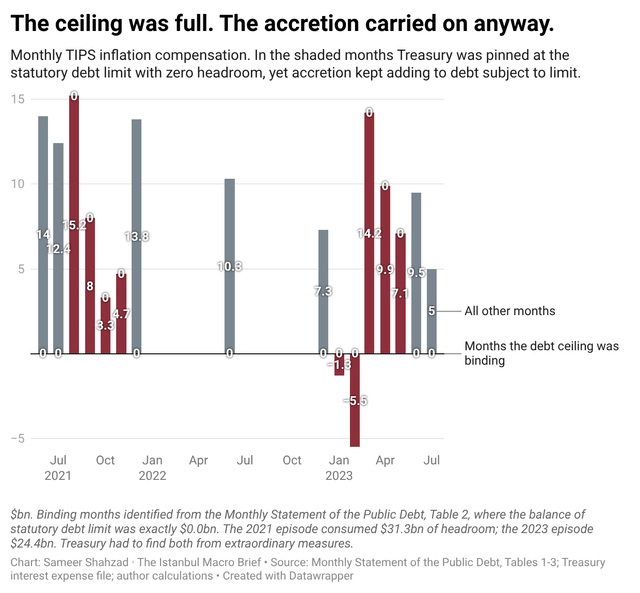
At current par, every percentage point of annual CPI occupies about $17.8 billion of ceiling. On the last twelve months of debt growth, roughly $216 billion a month, current headroom is around 5 months. That puts the next binding episode somewhere in Q1 of 2027. Crude run-rate arithmetic, not a Treasury projection, and April tax season moves it. Close enough, and the accretion drag belongs in X-date work, where I have not seen it turn up.
The Fed Is On The Other Side Of Some Of It
One holder publishes weekly, so you can follow it all the way through.
At the end of 2021, the Fed held $383.2 billion par of inflation-indexed notes and bonds carrying $72.2 billion of accumulated compensation. As of 16 September 2026, par is $277.1 billion, and compensation is $106.0 billion. The book shrank 27.7% while the compensation on it rose 46.8%. Only one thing does that.
Accretion on those holdings is Reserve Bank Interest income. Reserve Bank income gets remitted to the Treasury, except it has not been since 7 September 2022. The deferred asset peaked at $245.9 billion on 28 January and sits at $232.8 billion, working off roughly $20.8 billion a year.
The limit on that. The deferred asset is overwhelmingly about interest on reserves running above portfolio income, not about TIPS. What is narrower and true is that a slice of what Treasury paid out during the shock went to its own central bank through a pipe that is currently shut.
What The Book Cost To Build
I scored all 269 TIPS auctions since 1997, matching 118 matured cohorts against the nominal auctions run alongside them, both legs on auction stop-out yields. Five 20-year cohorts got thrown out because the US issued no nominal 20-year bonds between 1986 and 2020, so there is no honest counterfactual for them.
On $1,412 billion of face value, the programme cost Treasury $56.45 billion. Everything maturing before 2022 nets to minus $6.10 billion, so Treasury made money on TIPS for twenty-five years. Everything since nets to plus $62.55 billion.
Sort the cohorts by the breakeven rate at which each was sold, and it gets stark. Below 1.5%, the holder won 17 times out of 17; between 1.5% and 1.8%, 20 of 21. Above 1.8%, it goes to a coin flip.
One thing I will NOT claim, because I checked it and it was false. I assumed the cheap 2015 to 2020 paper was what matures in 2027 to 2029. It is not. Those buckets span 12 auction years, and the three biggest contributors are 2024 at $90.7 billion, 2023 at $82.0 billion, and 2022 at $79.4 billion. Recent five-year issuance at healthy real yields. The tidy story was wrong.
The Trade That Is Not There
I went looking for a position, and the negative result is worth knowing more than what I was hoping to find.
TIPS index to CPI on a three-month lag, so near-term carry is knowable in advance. October's accrual was set by the July and August prints, +0.3180%, against a ten-year breakeven costing 0.194% a month. That is 12.4 basis points of locked carry. Sort 282 months since 2003 by carry known before the month began, and total returns line up monotonically, with the spot breakeven never moving to offset. Looked like free money to me.
It is not. Run the same test on 5y5y forward, and the carry response vanishes, beta +0.020, t of 0.55. Then regress the level of the spot minus forward spread on known carry, and you get beta +0.606, t of 7.66. The market puts roughly 61% of the coming carry into the spot entry level. Residual unpriced carry is about 5 basis points against 13.3 of one-month spread volatility and two to six of execution cost.
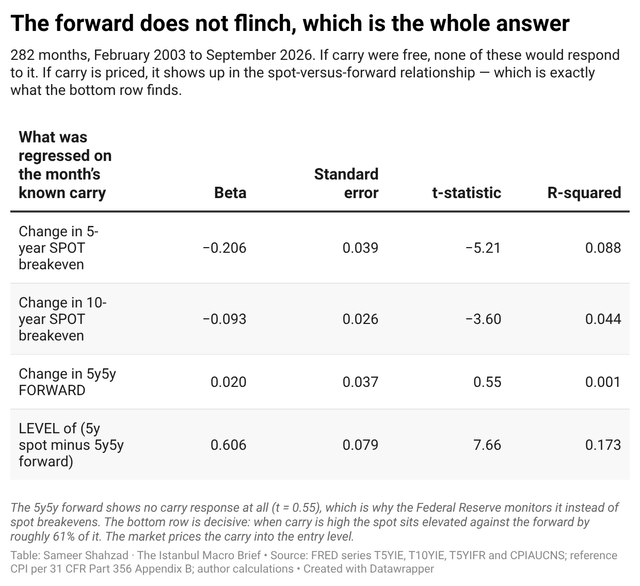
None of this should have surprised me. TIPS pricing has said for years that the quoted breakeven is not a clean read on expectations. D'Amico, Kim and Wei put it plainly: the spread "reflects the poorer liquidity of TIPS predominantly," with "other factors, including the indexation lag and the embedded deflation protection" playing a smaller part, and "ignoring this spread also significantly distorts the informational content of TIPS breakeven inflation." The technical junk in the spot number is documented. I went looking for an anomaly inside something the Fed had already labelled as noisy.
Where I Could Be Wrong
Only the 2026 and early 2027 maturity buckets are effectively fixed. The rest keeps accruing on the same three-month lag.
The debt ceiling point rests on Treasury's operative published accounting. Section 3101 is written on face amount and carries express rules for discount obligations, which is why unamortized discount gets backed out, but the text says nothing about inflation-indexed principal.
The UK and US figures sit three months apart, December 2025 against August 2026, because those are the most recent for each. The comparison is structural.
And accretion is genuine interest. Holders took real inflation risk and got paid for it. Every figure here comes from a government publication. My claim is about which line it lands in and which constraint it binds, nothing more.
Where This Leaves It
$387.6 billion of federal debt arrived without an auction, $176 billion of it created in twenty months while the inflation shock got capitalised. It is 2.2% of the financing need, which is small, and it occupies debt ceiling headroom dollar for dollar, which in the first quarter of 2027 will not be.
Britain runs 60% uplift on a quarter of its portfolio and is deliberately issuing less. We ran 22% on under 7% and raised issuance 57% across the decade that produced our only loss on the programme.
There is no trade in it. I checked, and the one candidate is priced into the spot before you get there.
Hold. $105.27.



Comments
Log in or sign up to join the conversation.