


Back on July 7, we discussed a bullish triangle pattern in Berkshire Hathaway, which appeared to be nearing completion and suggested that a new five-wave advance could follow. Click here for the previous article.
As anticipated, the stock eventually completed its consolidation around the $485 area and has now staged a strong reversal over the past two weeks, bringing it back to its all-time highs.
From an Elliott Wave perspective, Berkshire Hathaway could now be developing a five-wave advance within a higher-degree wave five. Given the strong extension to the upside, the current rally may already be in wave 3, meaning a near-term wave 4 pullback could offer a better opportunity for those looking for new entries.
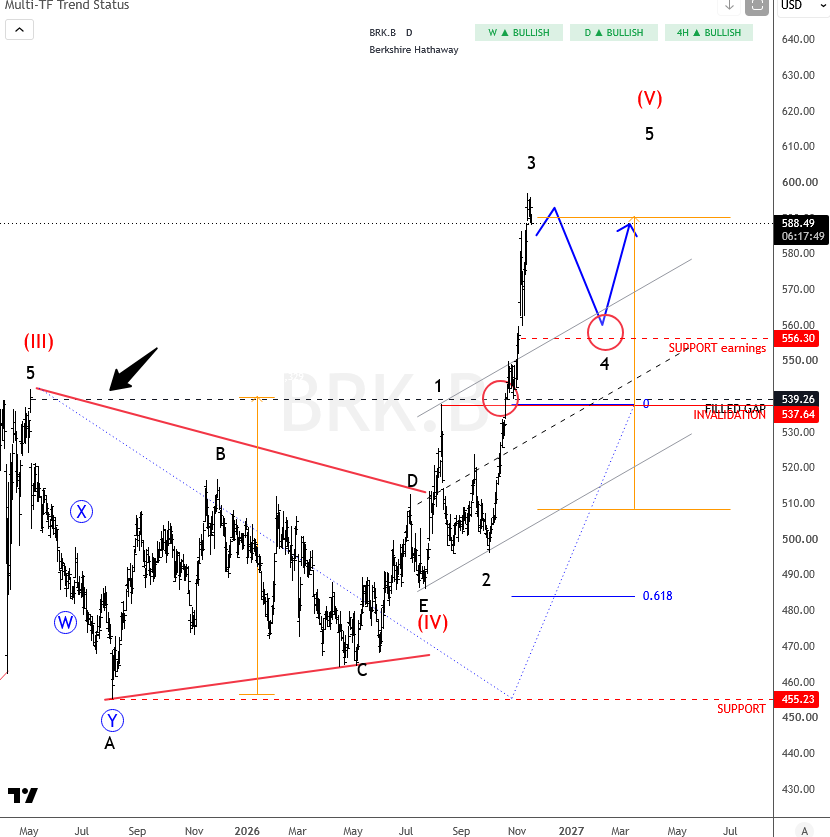
As for upside targets, the initial projection comes in near $600, based on the triangle measurement from the breakout point. However, with the five-wave impulse potentially still unfolding, an extension above $600 cannot be ruled out.
Overall, the bullish outlook remains in play as long as the stock holds above the $537 invalidation level.
Highlights:
Back in July, we identified a bullish triangle pattern that suggested further upside.
The previously discussed triangle correction appears complete around $485.
Berkshire Hathaway may be developing a five-wave advance within a higher-degree wave five.
The previous 2025 highs could act as near-term resistance and trigger consolidation.
The current rally may be in wave 3, with a potential wave 4 pullback offering a better entry opportunity.
Initial upside target near $600, based on the triangle measurement, with potential extension above $600.
The bullish outlook remains valid above the $537 invalidation level.



Comments
Log in or sign up to join the conversation.