


The crypto market is extending sharply lower following a significant rise in Fed rate-hike expectations. The decline appears impulsive, suggesting that we are most likely still in a bear market, with further weakness possible toward the end of the year. This risk increases if stocks face a deeper correction or an extended period of sideways consolidation. The current USD recovery could put even more pressure on risk-on assets, although potential reversals may not be too far away. A stronger recovery in stocks and a return to bullish conditions could once again provide much-needed support for the crypto market.
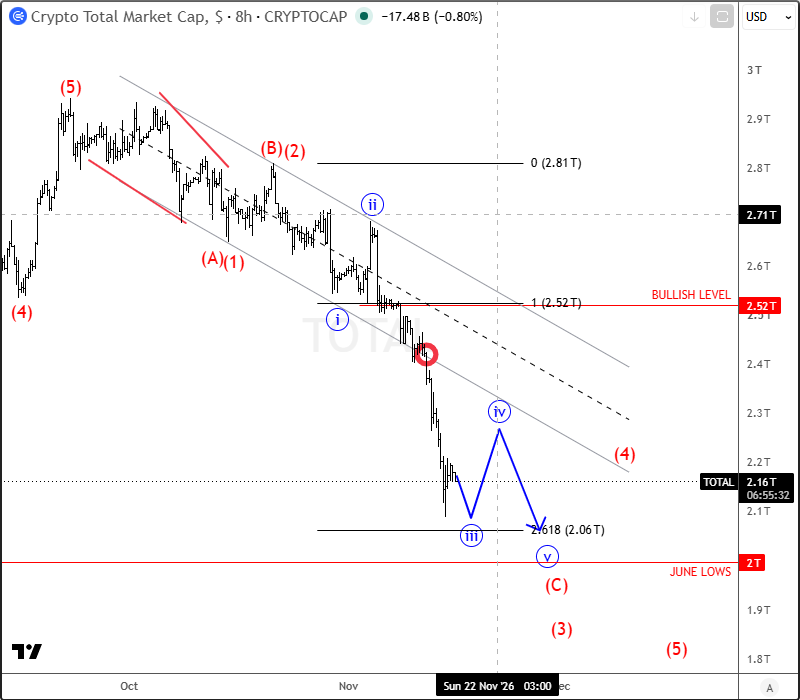
However, for now, the Crypto TOTAL market cap chart points to further downside, potentially toward the June lows near the psychological $2.0T level within wave (C) of (3). A lower-degree five-wave bearish impulse still appears unfinished. Therefore, after the upcoming recovery in subwave "iv", we should be prepared for another leg lower in subwave "v" to complete the current decline.
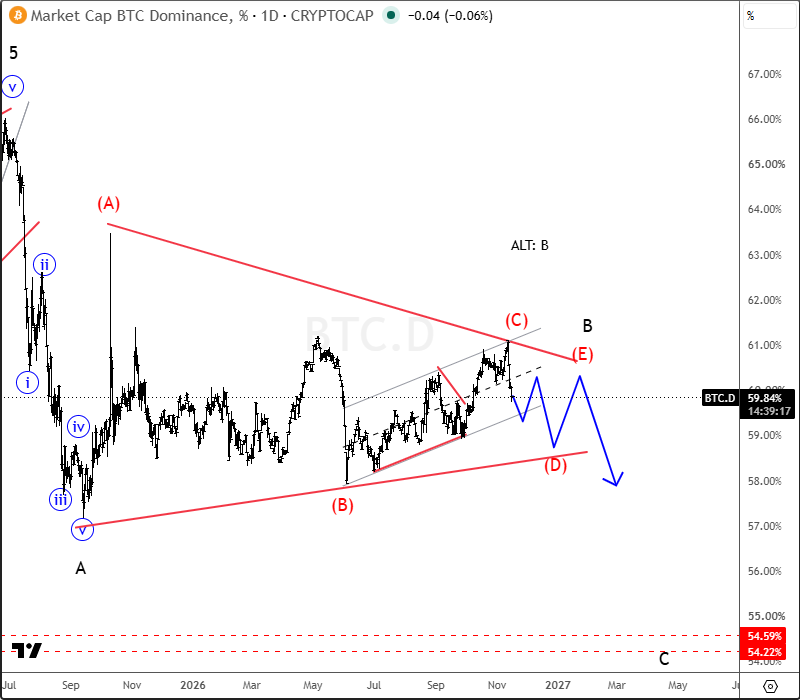
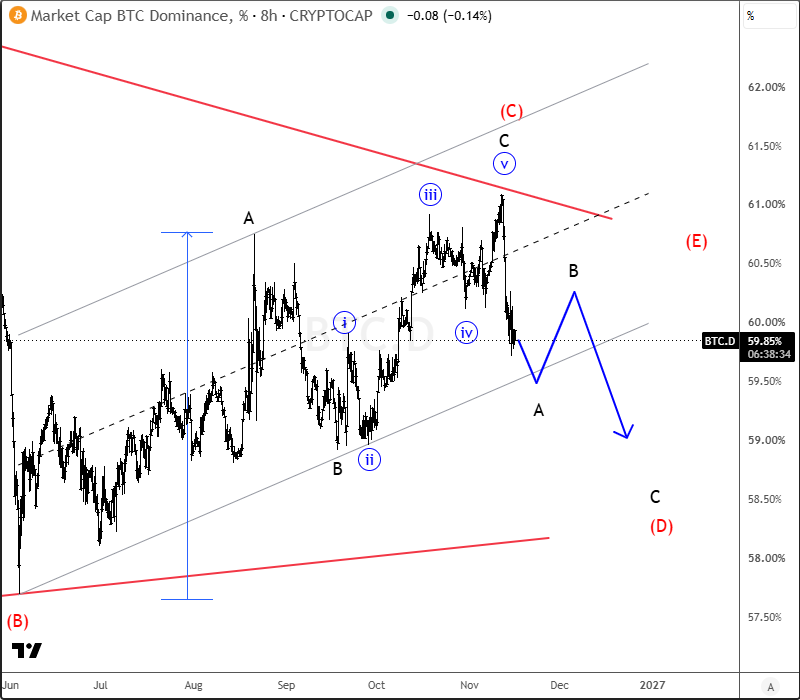
Regarding crypto market dominance, Bitcoin continues to underperform ALTcoins, as the BTC.D chart appears to be entering wave (D), which could unfold in three legs (ABC). This suggests that Bitcoin may remain relatively weaker than ALTcoins in the near term. However, we could still see temporary pullbacks, during which ALTcoins may extend lower while Bitcoin looks for a bearish continuation.
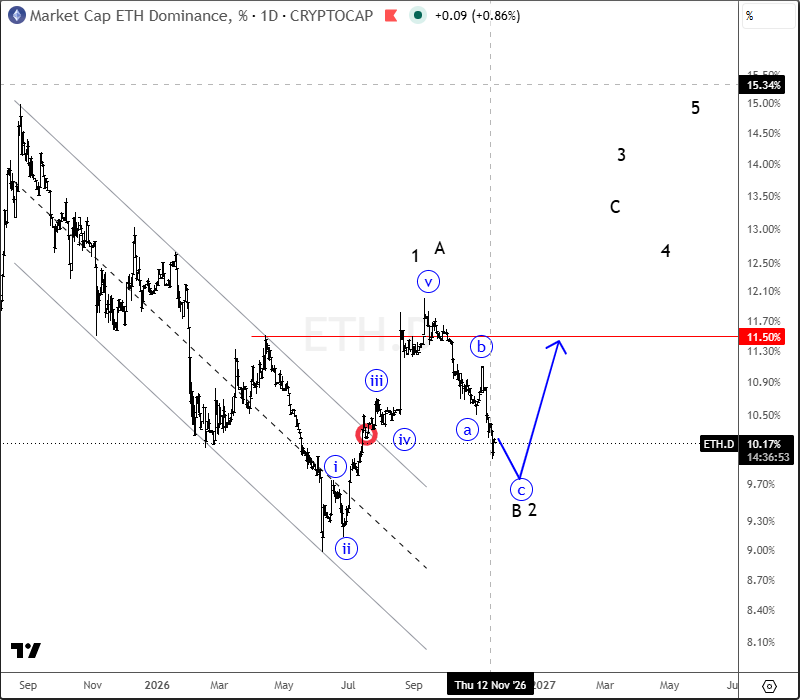
The ETH/BTC pair also suggests that Ethereum could soon start outperforming Bitcoin. ETH/BTC may still be completing wave "c" of an abc correction within wave B/2, potentially setting the stage for a larger recovery in wave C or wave 3. If Bitcoin and the broader crypto market remain under bearish pressure, Bitcoin may loose more than Ethereum. However, if the crypto market suddenly stabilizes and starts a larger recovery, ALTcoins, particularly Ethereum, could outperform Bitcoin significantly.
Despite the ongoing bear market, it is worth noting that the higher-time-frame weekly charts for Tether (USDT) and Stablecoins (STABLE.C) could be approaching the end of wave C of an ABC correction. This suggests that a potential bottom may not be far away. However, Bitcoin and the broader crypto market could still revisit the June lows before finding stability and starting a recovery, potentially setting the stage for a larger bullish reversal.
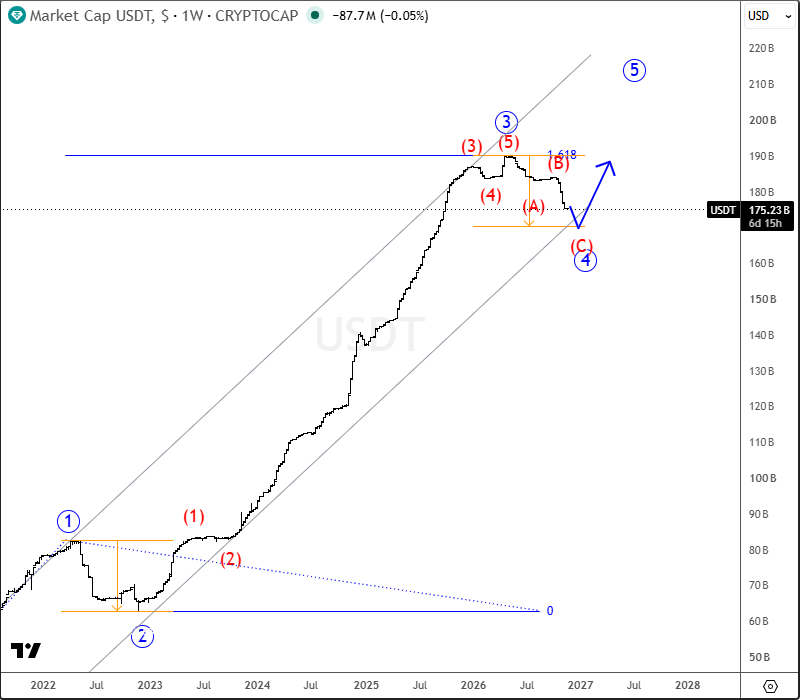
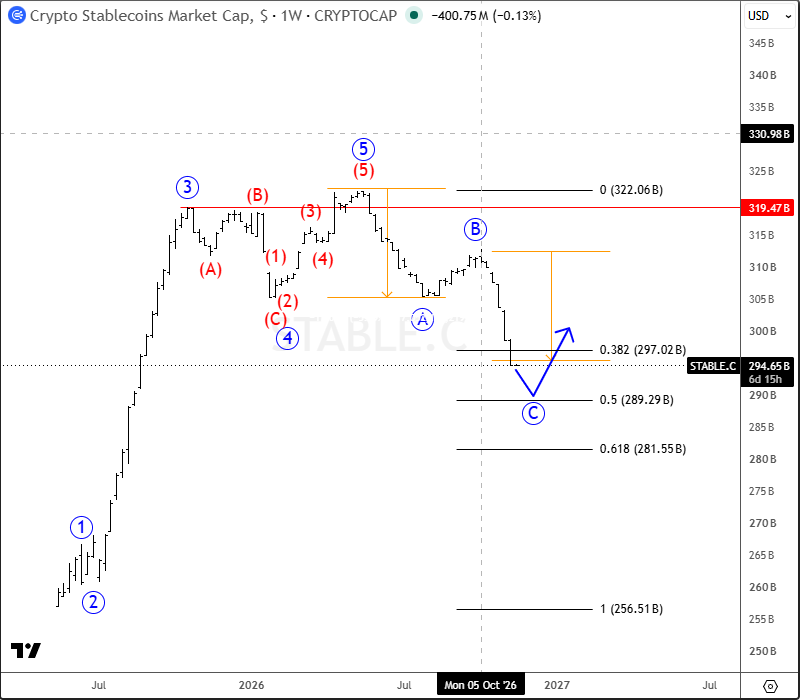
Overall, the crypto market remains vulnerable to further downside, but several higher-time-frame charts are approaching potentially important support zones. The key is to remain patient and wait for clear signs of a completed bearish structure before looking for a more sustainable recovery.
For a detailed view and more analysis like this, you may want to join our live webinar today on Monday, November 16 @ 15.00CET: DIRECT LINK



Comments
Log in or sign up to join the conversation.