


Back on March 05, we discussed how Berkshire Hathaway was consolidating inside a larger projected ABCDE bullish triangle pattern within wave (IV), with a potential breakout setting the stage for a move toward new all-time highs. That scenario is now playing out, as the stock has finally broken out of the triangle structure and appears to have entered the next bullish phase. CHECK IT HERE
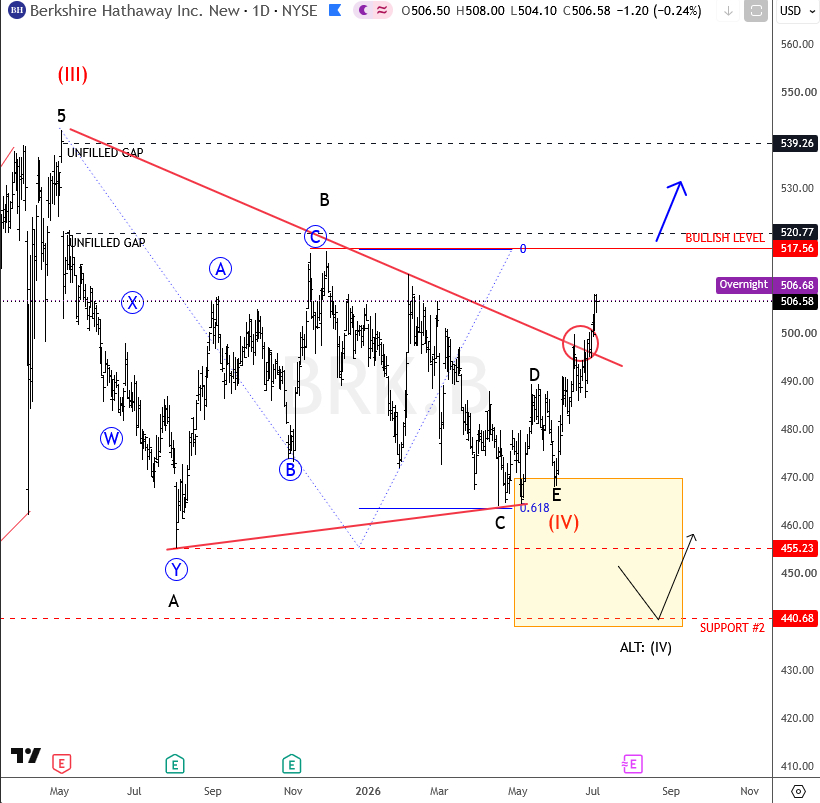
Berkshire Hathaway is now advancing within wave (V), with the next major confirmation coming from a move back above the 517 bullish confirmation level. A sustained breakout above this area would further strengthen the bullish case and suggest that the stock is on track toward new all-time highs.
However, traders should remain aware of possible short-term pullbacks after the breakout, as the market may retest previous resistance levels before continuing higher.
There is also an alternate bearish scenario to consider. If the breakout fails and Berkshire Hathaway turns lower again, wave (IV) may not be fully complete, leaving room for another decline toward the 440 support area. This level represents the next key zone where buyers could potentially step in.
Highlights
Bullish ABCDE triangle pattern in wave (IV) appears completed
Bullish structure remains valid while above the 470 invalidation level
Alternate downside support remains at 440 if the breakout fails
Wave (V) advance is now in progress
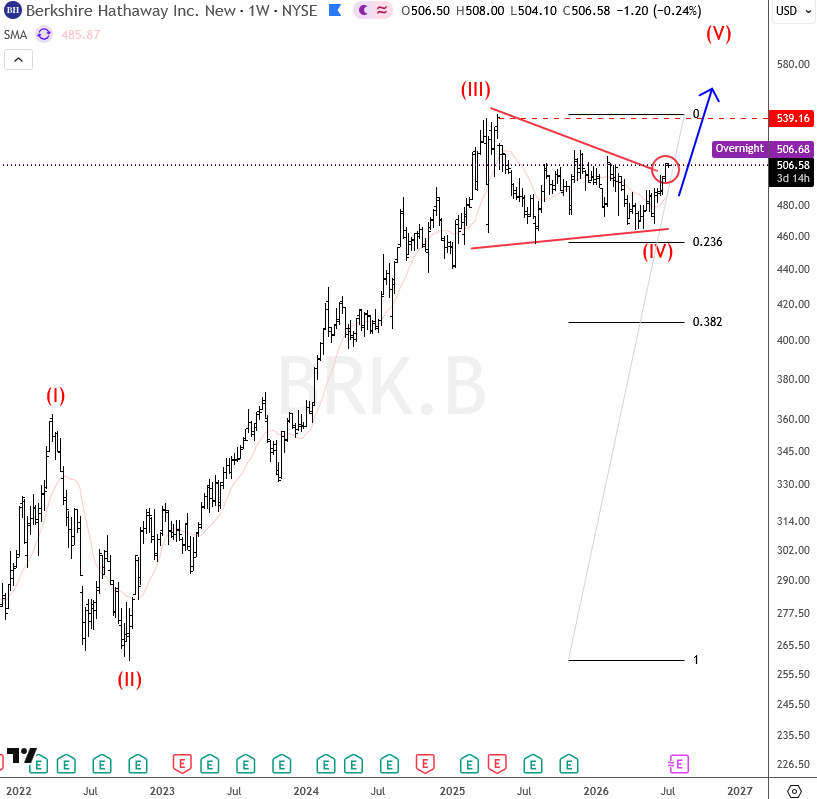
BRK.B Weekly Chart



Comments
Log in or sign up to join the conversation.