

SPX Monitoring purposes; Sold Long 3/3/22 at 4363.49 =3.27% gain; Long SPX on 2/23/22 at 4225.50.
Monitoring purposes GOLD: Long GDX on 10/9/20 at 40.78.
Long Term SPX monitor purposes; Neutral
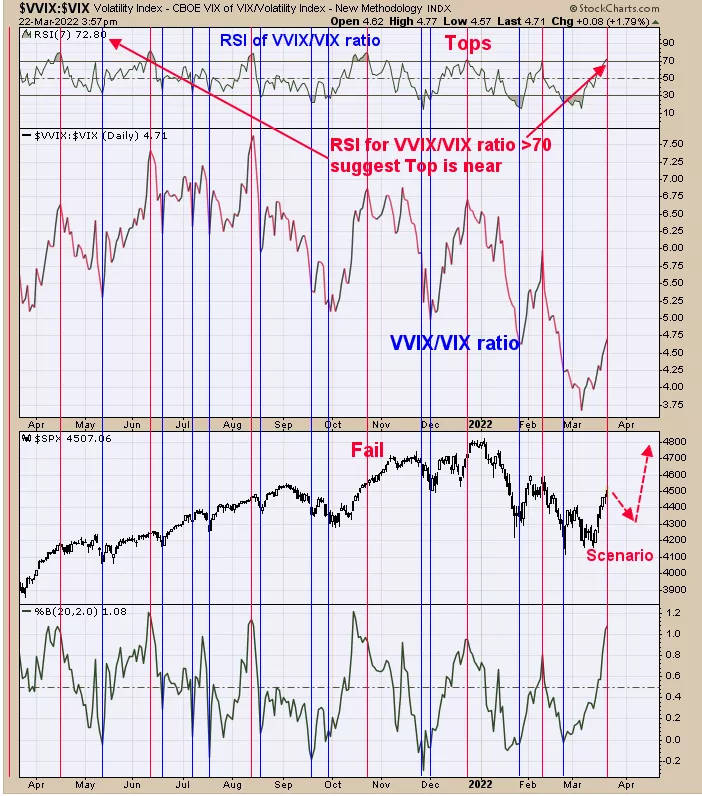
SPY was been up to five of the last six days and the one down day was minimal, which is a Bullish sign. For the very short term, the market is extended. The second window down from the top is the VVIX/VIX ratio and the top window is the RSI for this ratio. When the RSI of this ratio reaches >70 (current reading is 72.80) the market is usually doing for a rest. The red vertical lines show the times when the RSI reached above +70. Ideally would like to see the trin and tick reach panic levels to set up the next bullish signal.
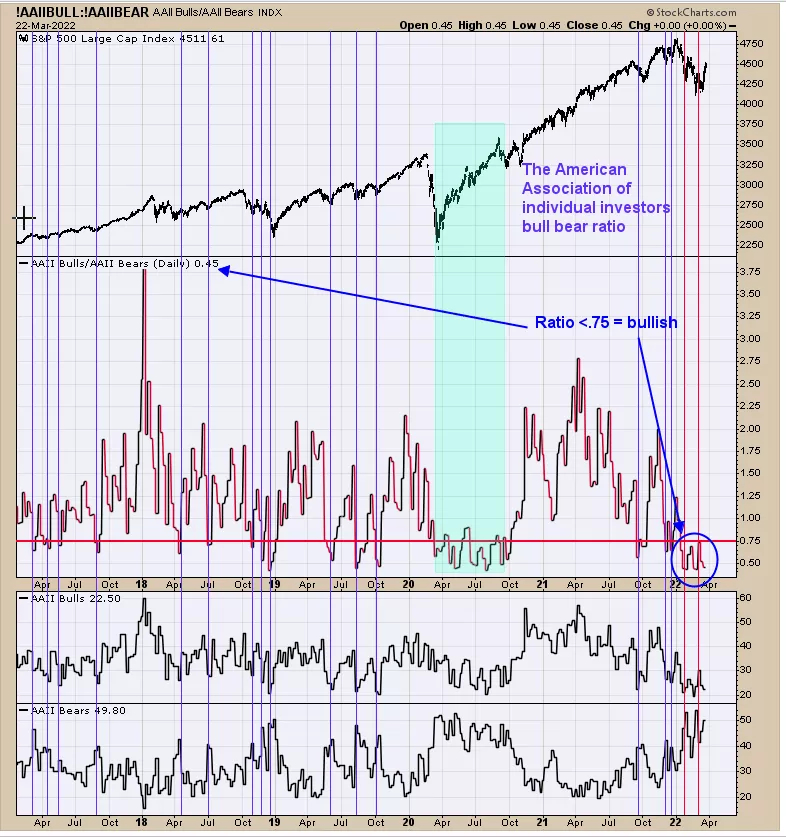
Above is The American Association of Individual Investors bull-bear Ratio. Intermediate-term lows have formed when this ratio closed below .75 (current reading is .45). Though the market has rallied over a week from the low the ratio remains rock bottom, suggesting investors do not believe the rally; which in turn is a bullish sign.
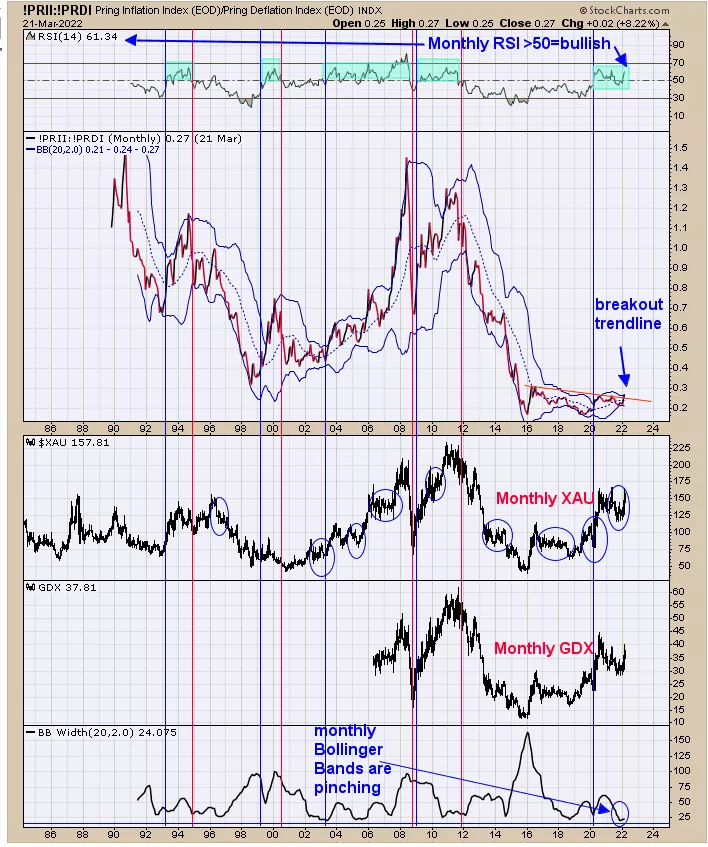
Yesterday we posted a long term view of the monthly XAU/Gold ratio (which was bullish). Today we are showing another long-term view of the Gold market which is the monthly Inflation/Deflation ratio. A bullish uptrend occurs in the XAU when the monthly Inflation/Deflation ratio RSI is above 50. The top window is the RSI for this ratio and the blue part shows the times when RSI is above 50. The blue vertical lines show when the RSI crossed above 50 the red vertical lines show when RSI fell below 50. The current bullish signal came when RSI crossed above 50 in early 2020. We also have the Bollinger Band on the Inflation/Deflation ratio and the bottom window shows that the Bollinger Bands on this ratio is very narrow suggesting there could be an acceleration in the Inflation/Deflation ratio coming soon. It's hard to see on the chart, but the ratio has closed above its trend line drawn on the chart which adds to the bullish picture.



Comments
Log in or sign up to join the conversation.