
It’s time for the weekly precious metals and miners technical update. The week began on a quiet note across the financial markets as investors awaited updates on a possible U.S.-Iran peace deal, as well as Friday’s U.S. jobs report for May.
The jobs report blew past expectations, with 172,000 jobs added versus just 88,000 expected. April’s figures were also revised higher, from 115,000 to 179,000, while March’s payroll growth was updated to 214,000, marking the first monthly gain above 200,000 since early 2024.
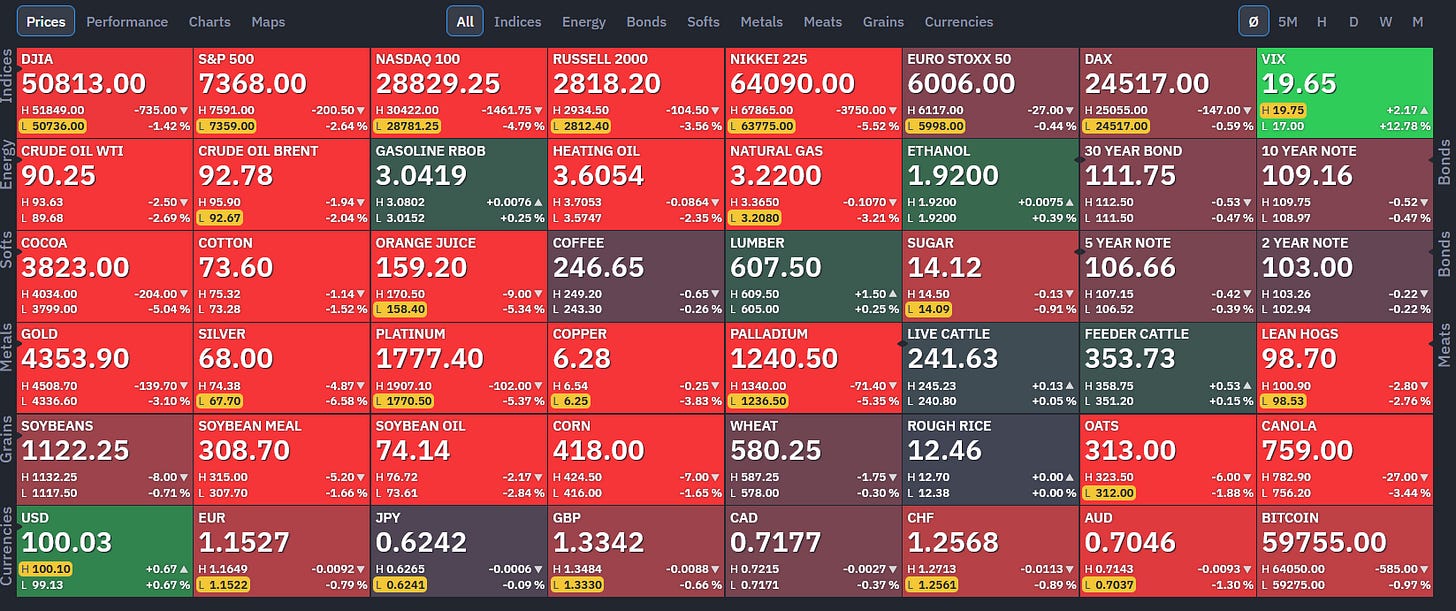
Unfortunately, in the distorted economic environment we’ve been in since the 2008 Global Financial Crisis, where good news is bad news and bad news is good news (at least for the financial markets), this much stronger-than-expected jobs report triggered a sharp selloff across nearly every asset class, including stocks, bonds, crypto, commodities, precious metals, and non-U.S. currencies while the U.S. dollar and the Volatility Index (VIX) were among the few to rise.
The Finviz heatmap below highlights Friday’s broad-based market selloff:
So I want to explain why a strong jobs report would cause asset prices, including stocks, to fall across the board instead of rise, as most people would expect. The reason is that, particularly since the 2008 financial crisis, global markets have become heavily reliant on—addicted to, really—low interest rates.
Rates can stay low when economic data and inflation are weak, but when both run hot, it raises the odds that the Fed and other central banks will pursue more hawkish policies, including hiking interest rates. Asset prices across the board tend to thrive in low-rate environments, but when the tide turns and the odds of rate hikes increase, assets from stocks to commodities tend to take it on the chin.
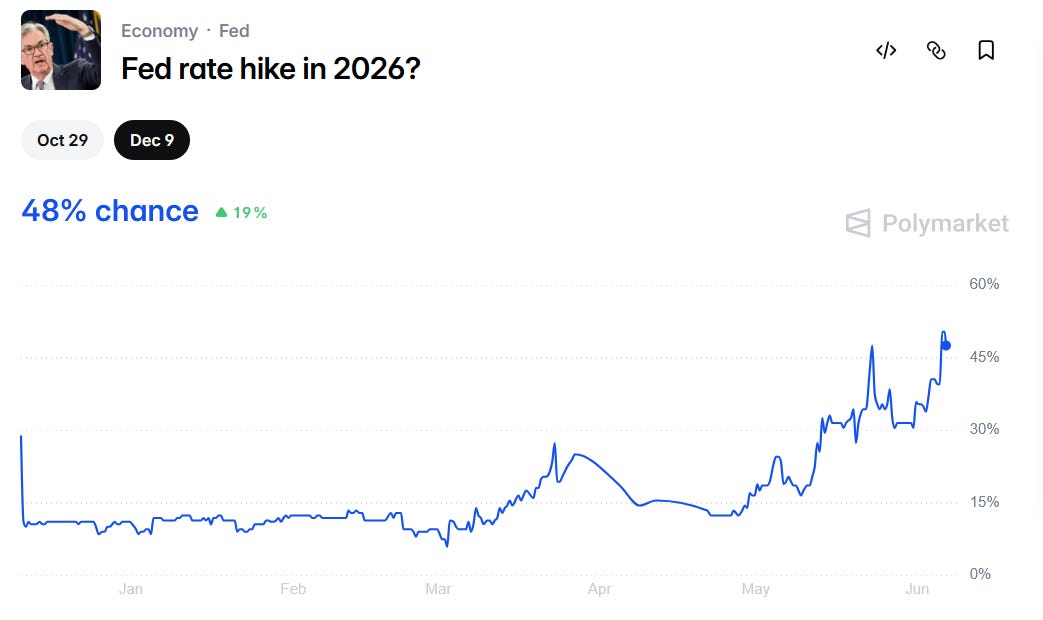
As the chart from the prediction market Polymarket shows, the odds of a U.S. rate hike in 2026 have risen significantly over the past month due to rising inflation expectations driven by higher energy costs stemming from the Iran war, and now the one-two punch of Friday’s much stronger-than-expected U.S. jobs report. A stronger economy and hotter inflation increase the likelihood of a more hawkish Federal Reserve, which is why markets reacted so negatively to the jobs data.
As I said earlier, the U.S. dollar was one of the few beneficiaries of Friday’s developments, as the prospect of higher domestic interest rates relative to the rest of the world, along with the broader selloff in asset prices, led to a stronger dollar. In turn, a stronger dollar puts additional pressure on commodities and precious metals, since they are globally priced in dollars.
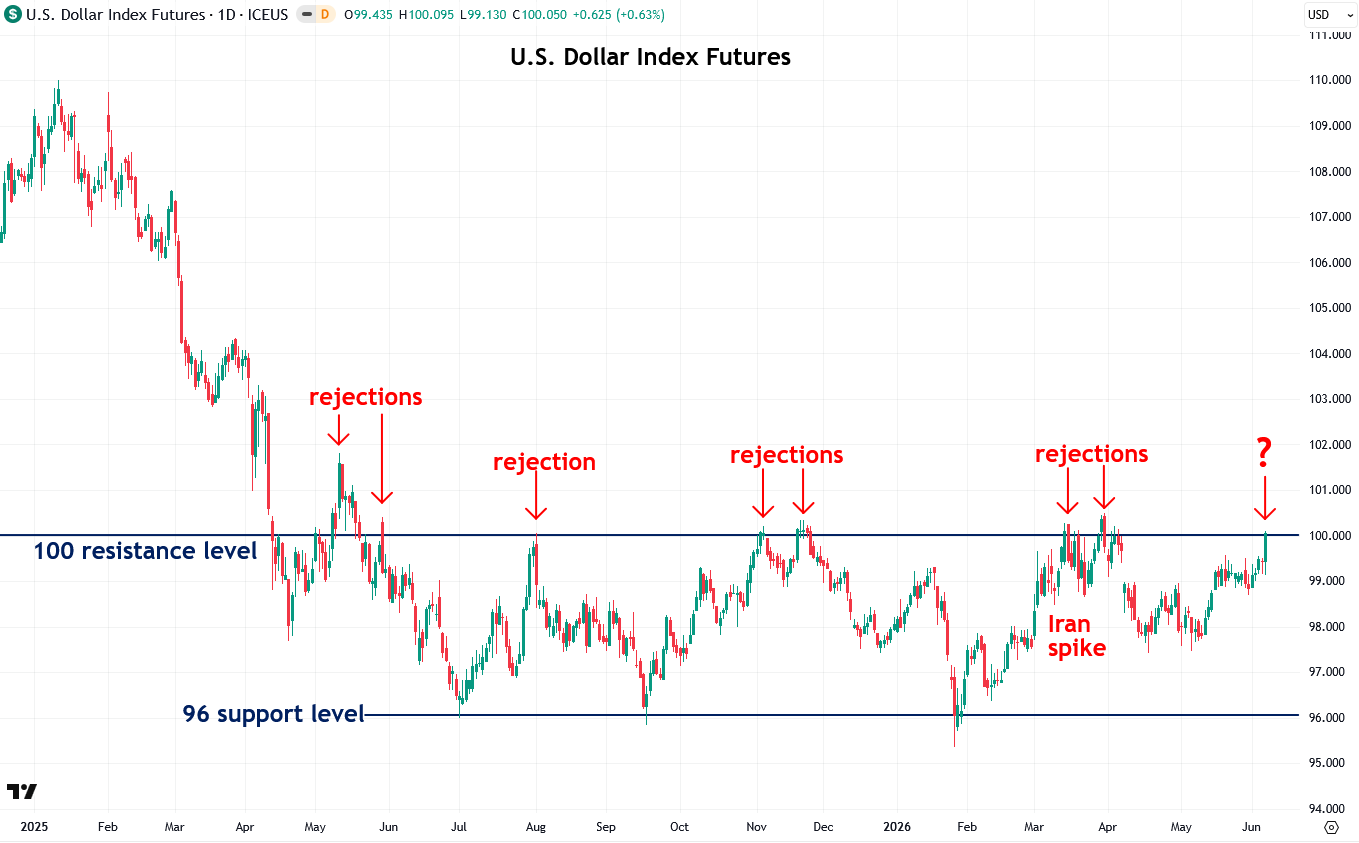
The chart below shows the U.S. Dollar Index, which as I frequently explain has been trading in a range over the past year between support at 96 and resistance at 100. Friday’s jobs report sent the index back up to test that 100 resistance level, which it has now tested seven times over the past year, failing to break above it each time before pulling back.
I am now watching closely to see whether the Dollar Index will once again fail at the critical 100 resistance level or finally break through it. If it fails and turns lower, that should provide a boost to commodities and precious metals, but if it breaks through decisively, it would likely put further downward pressure on them, at least in the short term. For that reason, the Dollar Index remains a key focus.
If you’d like to track the Dollar Index yourself, you can follow it using this free chart from Finviz.
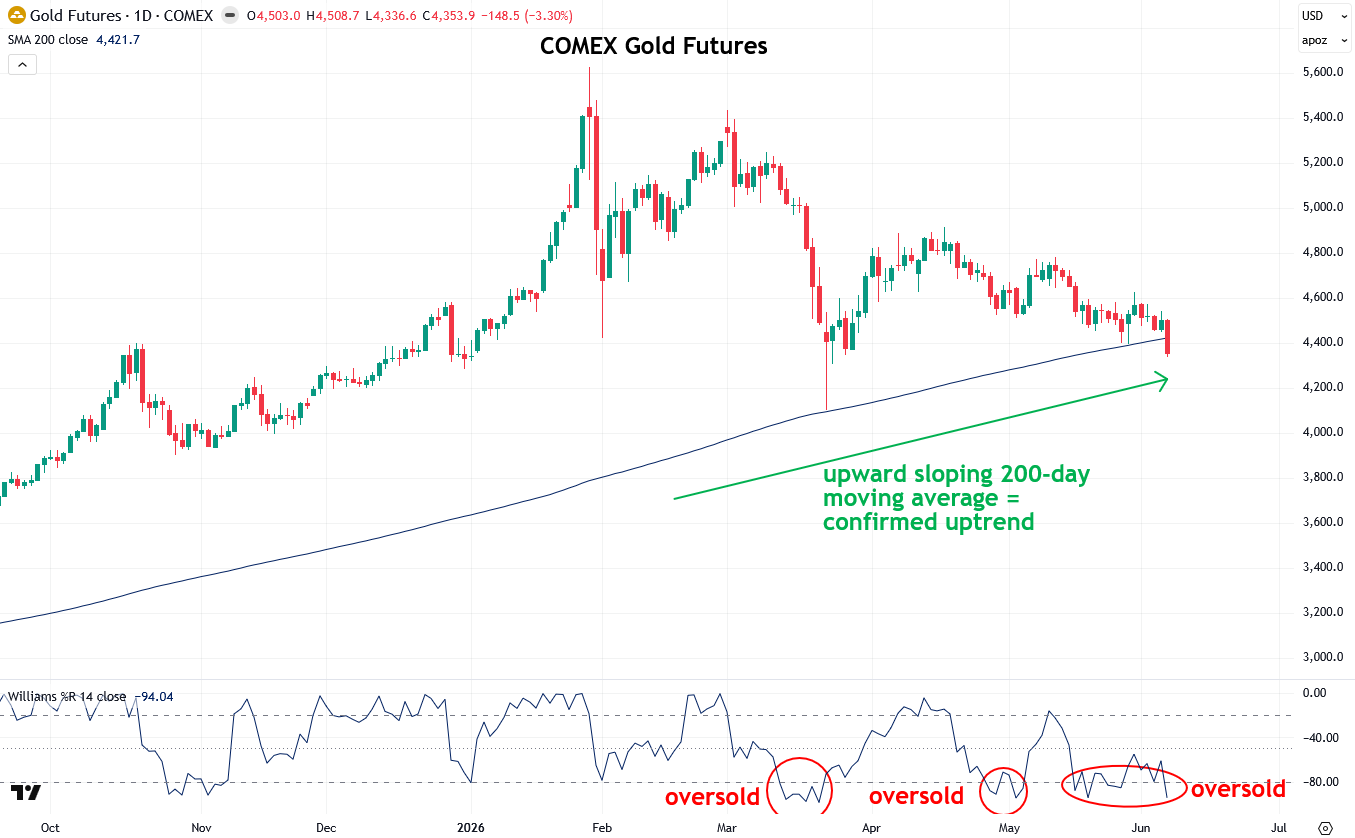
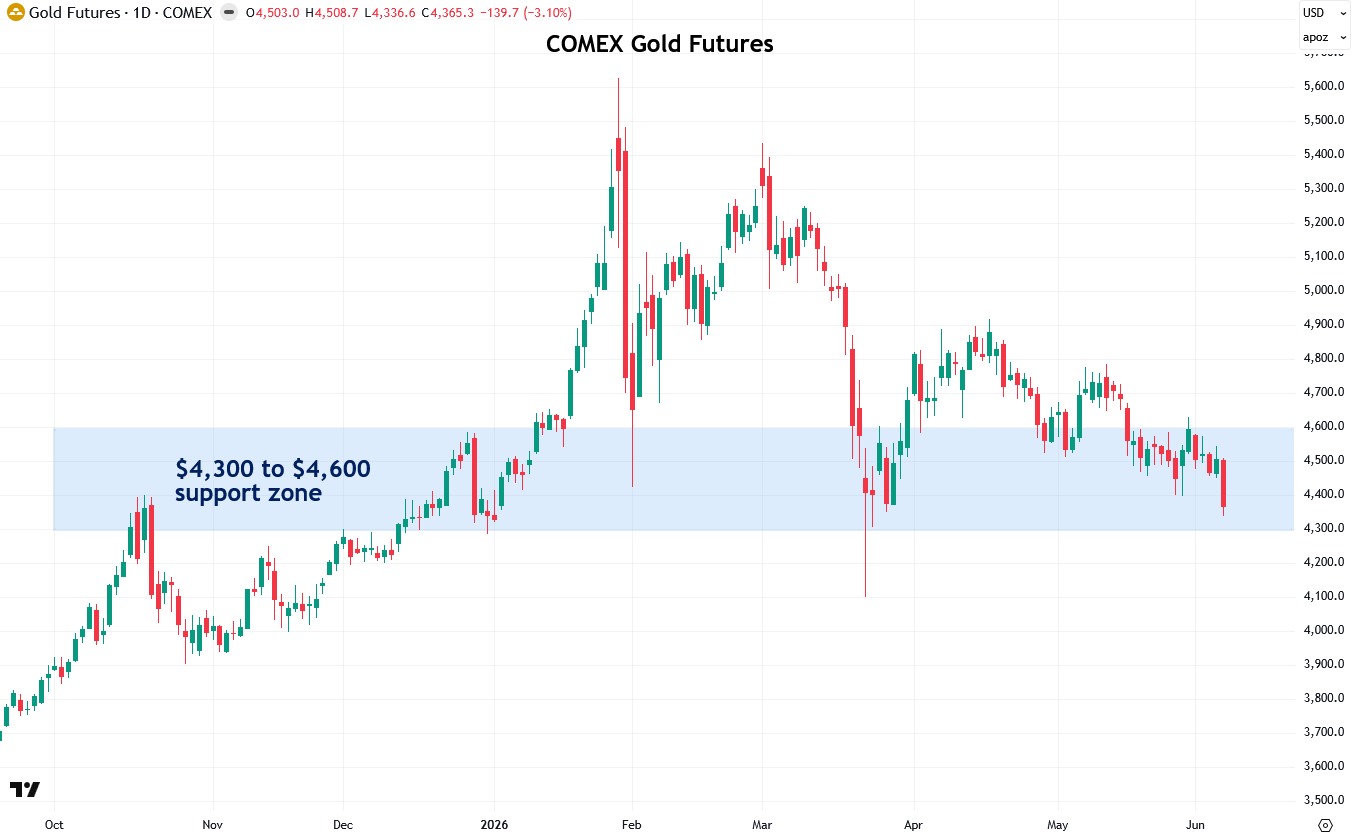
Now let’s take a look at where precious metals and the mining sector stand, starting with gold, which leads the overall complex. In line with the broader financial markets, gold fell 3.3% on Friday after several quiet weeks of moving sideways.
Gold’s latest decline pushed it below the 200-day moving average, but I don’t put much weight on that alone, as I’ve often seen similar moves quickly reverse with the price climbing back above it. I place far more importance on the slope of the 200-day moving average when assessing the trend, and in gold’s case, it is still sloping upward, which is an encouraging sign.
What is more concerning is when an asset is trading below a downward-sloping 200-day moving average, as that signals a bearish bias—but that is not the case for gold at this time.
Gold has now spent roughly three weeks at oversold levels according to the Williams %R indicator, which often creates the conditions for a rebound when it occurs within an uptrend, as indicated by the upward-sloping 200-day moving average. That said, I would not try to catch a falling knife until it is clear that the selloff has exhausted itself and that gold has found solid support, which I’ll discuss next.
To better understand this analysis, I recommend reviewing my two tutorials. The first explains how to identify and trade with the trend, and the second covers when to buy dips and sell rips.
As for the key support I’m watching in gold, it is the $4,300 to $4,600 zone, which formed at important peaks and lows over the past eight months. Friday’s decline pushed gold to the lower end of that zone, though it’s worth noting that several rebounds have occurred from this same area. Ideally, I would like to see that happen again.
If gold were to close decisively below $4,300, thereby breaking down through this support zone, I would adopt a more cautious stance for those engaged in short-term trading. That said, I firmly believe gold is still in the early stages of a long-term secular bull market, and that the correction which began in late January is simply a routine pullback of the kind that occurs in every powerful bull market.
To learn more about support and resistance zones, I recommend reading my two-part tutorial (Part 1 and Part 2).
Moving on to silver, it fell 8.27% on Friday but managed to close just above its 200-day moving average, which is still sloping upward. Silver has also been oversold for roughly three weeks, a condition that often sets the stage for a rebound when it occurs within an uptrend.
That said, as with gold, I would avoid trying to catch a falling knife until it is clear the selloff has exhausted itself and that silver has found solid support, which I’ll explain next.

Comments
Log in or sign up to join the conversation.