
Right now, we are seeing a major change in the commodity space. From the boardroom to the drill rig, a broader narrative is shifting. The focus of Wall Street, investors and everyday market watchers is no longer purely locked in on interest rate pivots or speculative fervor. Instead, we’ve entered an era in which structural scarcity is rewriting the rules of the global economy.
Whether it’s securing domestic energy or the critical metals essential for defense and future tech systems, we’ve arrived at a place where the supply-demand realities simply aren’t adding up. It is also where strategic investors are seeing new opportunities emerge.
Below, we are exploring the critical charts that are defining the commodity landscape as we move further into 2026. These visuals highlight the pressure points in gold, silver, uranium, platinum, and rare earths. They are the hard assets that are becoming the ultimate leverage in a world of growing geopolitical and monetary uncertainty.
I. Silver: The Re-accumulation Phase
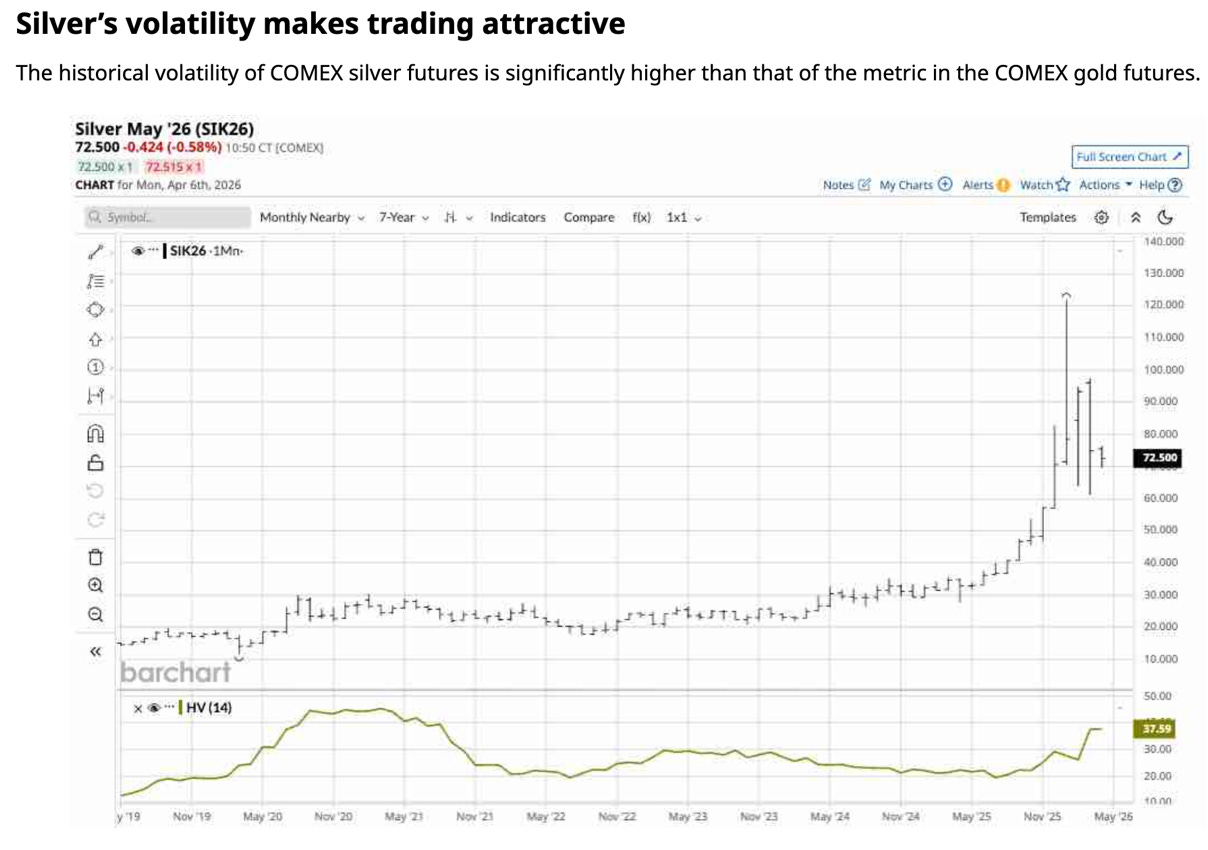
Why it Matters: Silver has recently entered a vital consolidation phase after finding firm support near the $70 range, signaling a transition from “liquidation” to “accumulation.”
This position could serve as the springboard for what many analysts believe will be a rotation back to the $110+ levels as industrial demand for solar and semiconductor materials continues to outpace mine supply. For Prinsights readers, this chart represents a step closer toward the “catch-up” potential that silver holds relative to gold’s run.
Watching the $66 floor is essential because as long as it holds, the structural case for silver remains in play – with the most traction in precious metals.
II. Uranium: The Deficit Widens
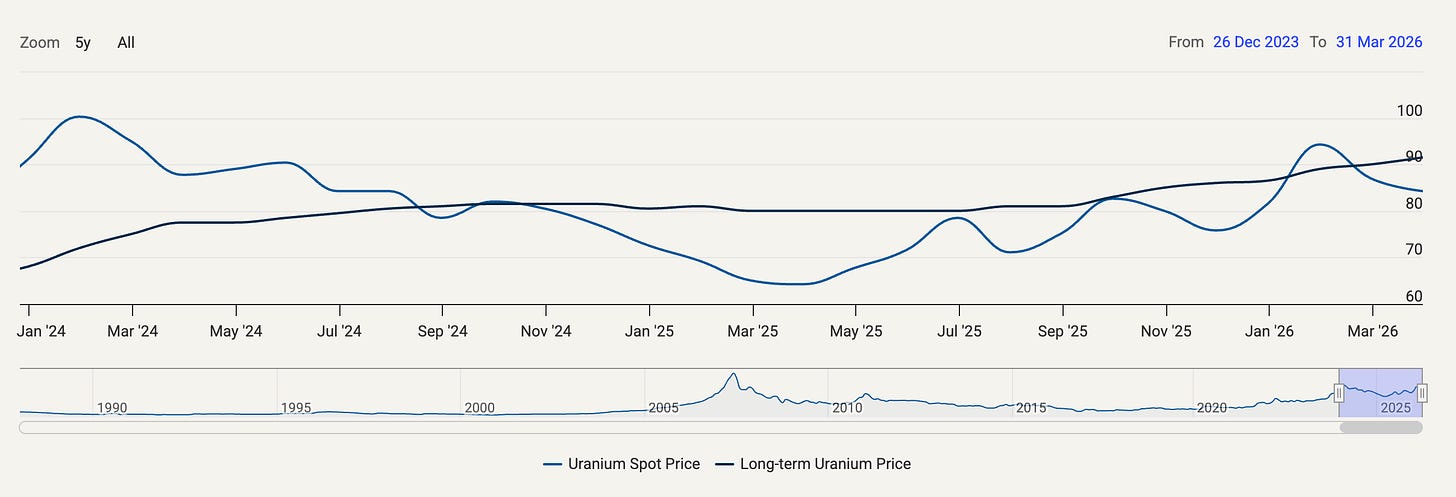
Why it Matters: The gap between primary uranium production and global demand has officially shifted from a theoretical concern to a market-clearing reality. With roughly 70 to 75 new nuclear reactors currently under construction and the Sprott Physical Uranium Trust (SPUT) aggressively returning to the market in early 2026, the “clear and obvious” supply has been exhausted. Yes, geopolitical disruptions in the Strait of Hormuz have recently increased the level of complexity and added an energy security premium to spot prices, which are now around the $85 mark.
This chart highlights a structural shift that might not be able to be fixed by current mining restarts alone.
III. Platinum: Depleting the Above-Ground Stocks
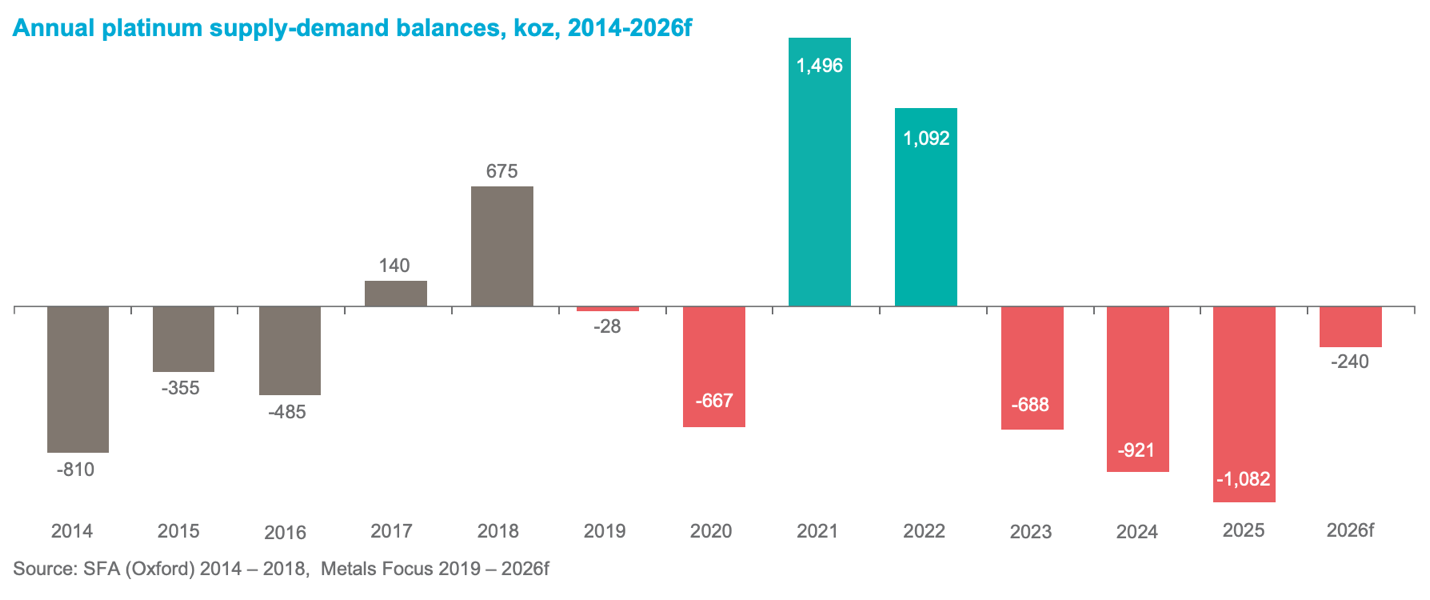
World Platinum Investment Council
Why it Matters: Following three straight years of deficits, platinum’s above-ground stocks have been depleted by over 40%, leaving less than five months of demand cover. While 2026 is projected to see a potential balancing because of ETF profit-taking at higher prices, the underlying industrial and automotive demand for platinum remains in place. For strategic investors keeping an eye on the long-term, the chart confirms that any short-term price dips in 2026 are likely blips in the vast platinum story.
IV. Gold: The $6,000 Frontier Remains in Play
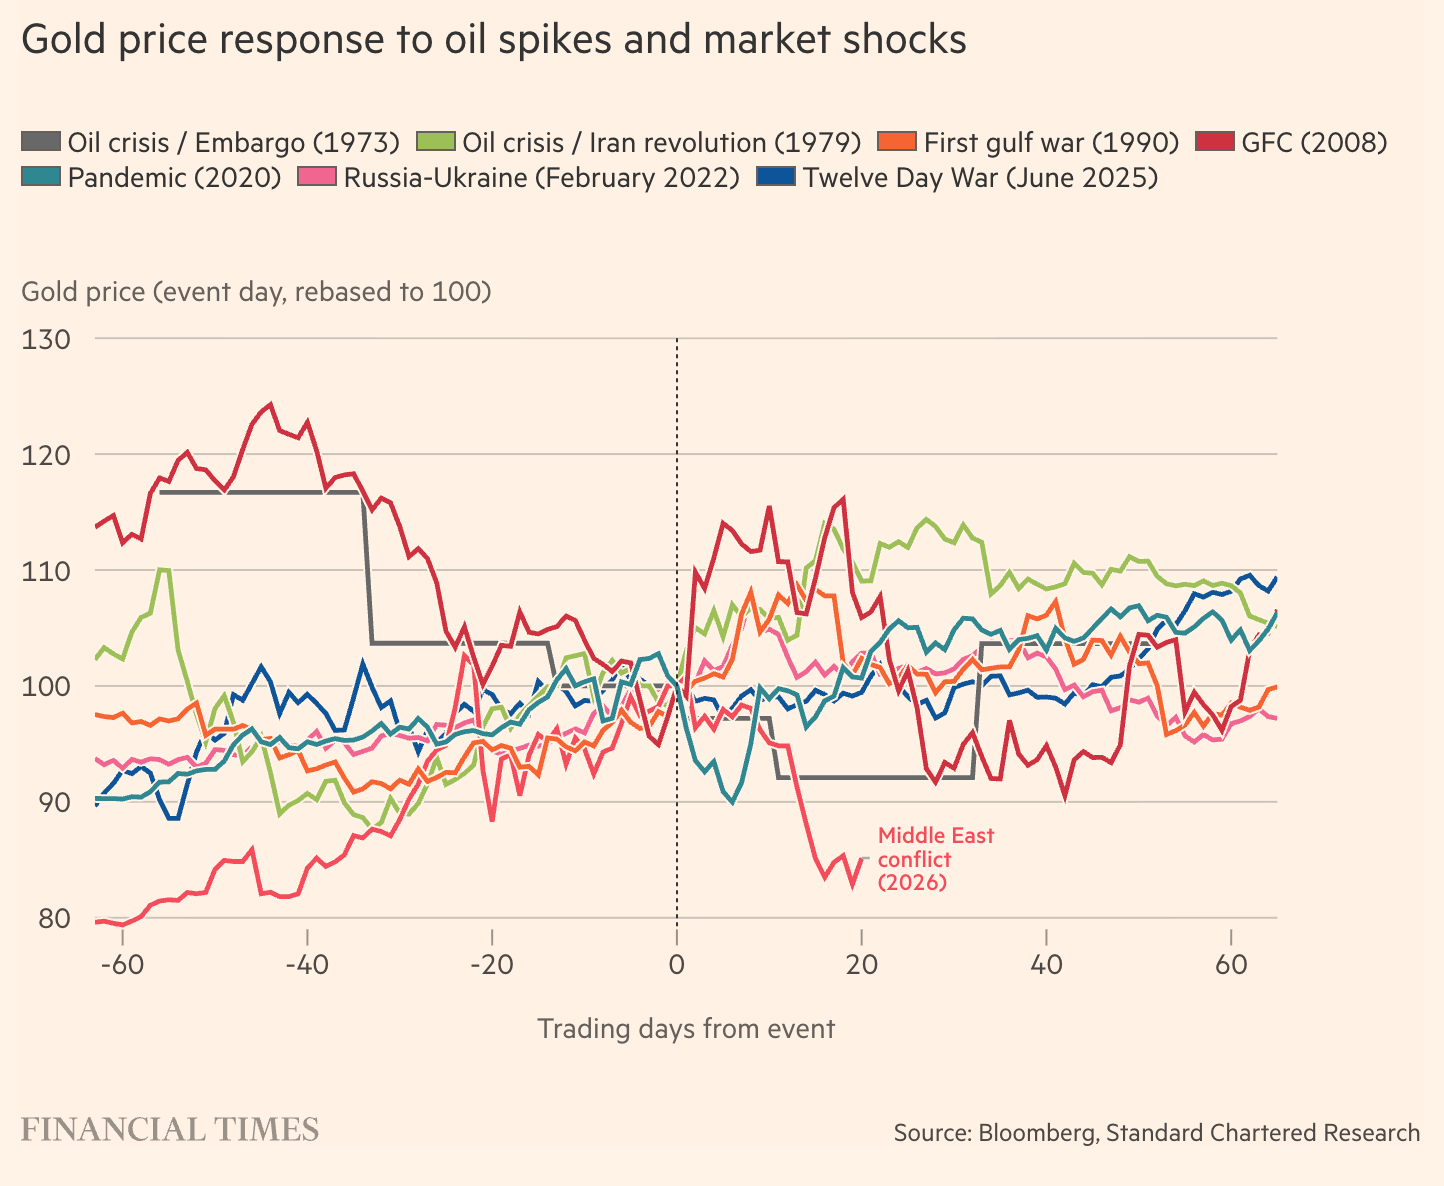
Why it Matters: Gold’s surge past $5,000 in early 2026 was more than just a headline flash or a round number milestone. The move represented a fundamental question over fiat currency values in a high-inflation, high-conflict world that’s largely driven by the U.S. dollar. And while interest rates seem to be remaining “sticky,” the broader market will continue to prioritize safe-haven opportunities over speculative, short-term plays.
Based on our analysis, what’s taken place is that gold switched from being “overbought” at the start of the year to now being “oversold” since the start of the conflict. Yet, the fundamentals and the drivers that triggered momentum in gold have not materially changed. Geopolitical risks, global debt and trade wars and tariffs have not gone away.
This chart is the ultimate historical barometer of global tensions, and with price targets now shifting upward, the yellow metal remains the anchor of the commodity super-cycle.
V. Rare Earths: The Concentration Crisis
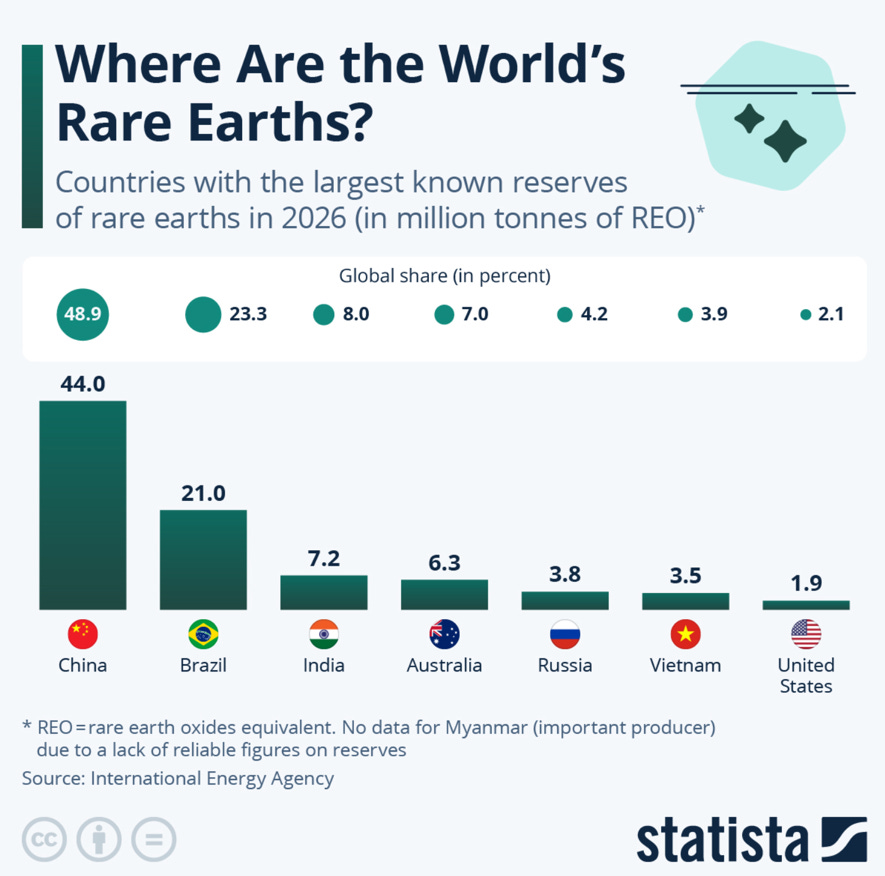
Why it Matters: Despite years of talk about “de-risking” the rare earths supply chain, the latest 2026 data highlights that China still controls more than 40% of global rare earth reserves. Ultimately, China’s dominance in the sector accounts for roughly 70% of rare earth mining, more than 90% of separation and processing, and 93% of magnet manufacturing. As demand for high-strength permanent magnets for EVs and defense technology surges, the West’s demand for rare earths has increased. Recent export controls on heavy rare earths like Europium and Holmium served as a reminder that these elements are dynamic geopolitical levers, not just commodities.
This chart underscores why domestic mid-stream processing is the most critical (and undervalued) link in a world seeking both energy security and innovative tech dominance.
Why These Charts Matter
While these five charts offer data points for evaluation, they also provide a visual blueprint for the next phase of the global commodity supercycle. As we look ahead, the intersection of supply deficits and a fundamental shift toward hard assets suggests that the “price pressures” we forecast in our Commodity Outlook 2026 are only just beginning emerge.

Comments
Log in or sign up to join the conversation.