


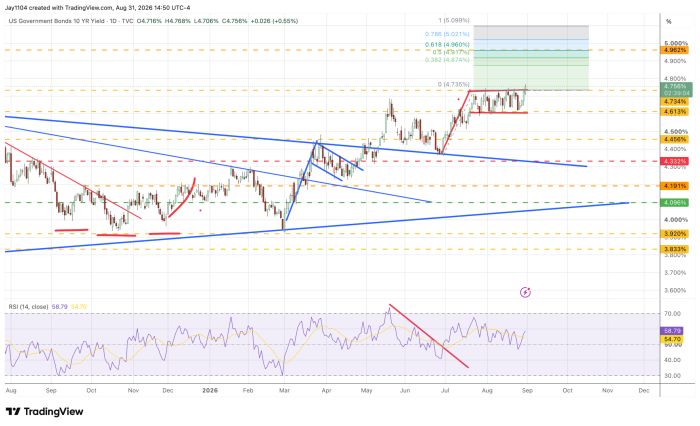
Stocks finished the day mostly lower, while rates finished the day mostly higher. The 10-year Treasury yield traded around 4.75%, moving us just that much closer to a potential push toward 5%. This week’s data could help bring the 10-year closer to that 5% level, but then again, a surge in oil could too.
JOLTS and ISM Manufacturing come tomorrow, followed by ADP private payrolls on Wednesday, ISM Services on Thursday, and the jobs report on Friday. The totality of the data this week could potentially spark another move higher in the 10-year, especially given how low the bar is for job creation.
The 10-year looks like a bull flag, and a pretty easily identifiable one, with a projection signaling a move to about 5.1%.
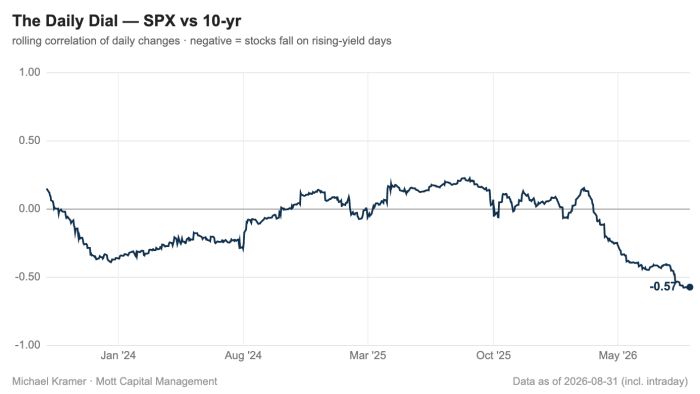
The reason we should care about bond yields is that we are in a regime of negative correlation, meaning that a rise in bond yields tends to lead to a decline in stock prices. The correlation is measured using the daily changes in both rates and stocks. More importantly, the 120-day correlation shows that this relationship has been strengthening.
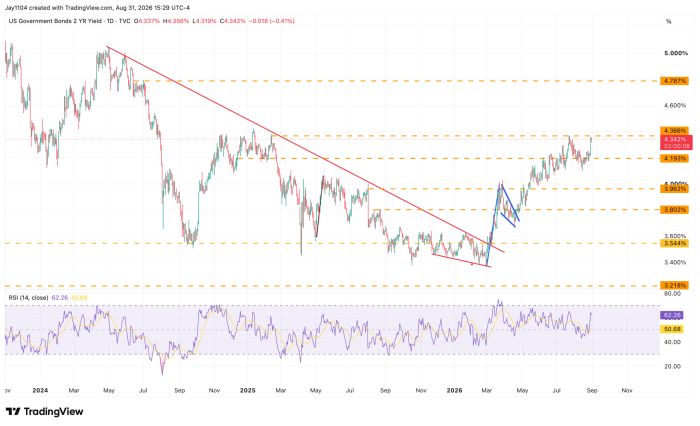
The 2-year looks particularly vulnerable at this point, as it sits just below resistance near 4.4%. I think a breakout in the 2-year could set it on a path toward around 4.75%.
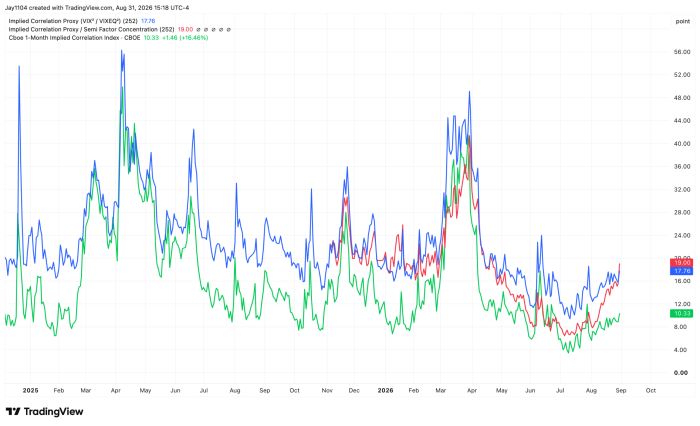
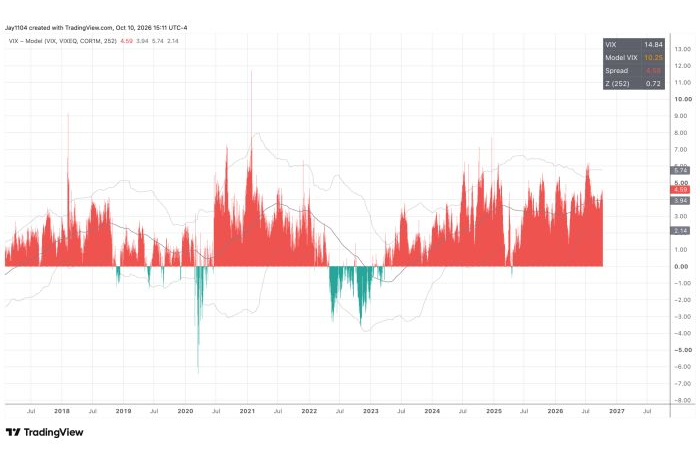
Semiconductor implied volatility continued to get smashed and probably has further to fall after Broadcom reports results. We have been watching the correlation between semiconductor ETF implied volatility and the VIX move higher in recent days. This has served as a proxy and leading indicator for the implied correlation index, working fairly well. It would seem to suggest that implied correlations have further to climb.
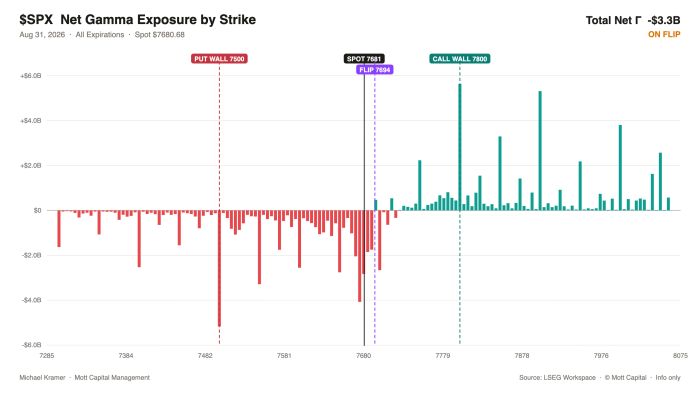
Ultimately, with this week being data-heavy, there is downside risk in the S&P 500, given that the put wall resides around 7,500, implied volatility is likely to rise heading into the jobs report, Treasury yields are rising, and the semiconductor sector continues to look weak. It certainly wouldn’t be a big deal if the index fell to 7,500; it would just push us back to where the index stood on July 31.

Comments
Log in or sign up to join the conversation.