


For today's edition of our upgrade list, we used our website's advanced screening functions to search for UPGRADES to BUY or STRONG BUY with complete forecast and valuation data. They are presented by one-month forecast return. Superconductor Technologies, Cree, and Myriad Gentics are rated STRONG BUY. AudioCodes and Green Bancorp are rated rated BUY..
|
Ticker |
Company Name |
Market Price |
Valuation |
Last 12-M Return |
1-M Forecast Return |
1-Yr Forecast Return |
P/E Ratio |
Sector Name |
|
SCON |
SUPERCOND TECH |
7.15 |
160.26% |
407.09% |
1.31% |
15.71% |
N/A |
Computer and Technology |
|
CREE |
CREE INC |
47.35 |
36.77% |
81.07% |
1.09% |
13.14% |
N/A |
Computer and Technology |
|
MYGN |
MYRIAD GENETICS |
43.85 |
48.76% |
81.50% |
1.09% |
13.04% |
36.24 |
Medical |
|
AUDC |
AudioCodes LTD |
9 |
15.26% |
35.95% |
0.71% |
8.55% |
24.32 |
Computer and Technology |
|
GNBC |
GREEN BANCORP |
24.65 |
17.58% |
22.03% |
0.60% |
7.14% |
17.99 |
Finance |
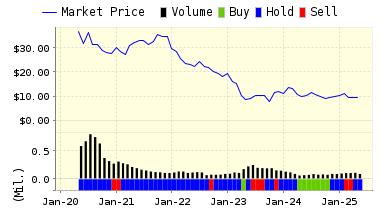
For today's bulletin, we look at AudioCodes (AUDC). AudioCodes Ltd. is a vendor of advanced voice networking and media processing solutions for the digital workplace. AudioCodes enables enterprises and service providers to build and operate all-IP voice networks for unified communications, contact centers, and hosted business services.
AudioCodes reported decent results yesterday, and the shares jumped as a result. For the second quarter ended June 30, 2018, revenues were $43.5 million compared to $42.4 million for the first quarter of 2018 and $38.7 million for the second quarter of 2017. Net income was $2.4 million, or $0.08 per diluted share, for the second quarter of 2018 compared to $1.0 million, or $0.03 per diluted share, for the comparable period last year.
President and Chief Executive Officer of AudioCodes, Shabtai Adlersberg, had the following to say about the results:
Continuing the strong trend of previous quarters, our Enterprise Voice business continued to evolve as we enhanced our leadership position in the UC and the contact center market segments. Revenues in the first half of 2018 grew 12.9% compared to the first half of 2017. We now project revenue growth of about 10% for the full 2018 year, compared to growth of 7.7% in 2017 and 4.2% in 2016. At the core of this growth is the UC-SIP business which performed well across all business lines and achieved growth of over 30% from the year ago quarter.
On the financial front, we achieved substantial improvement in our operating margins which reached 10% in the second quarter of 2018. Taking into account our investment in the new initiative of Voice.AI, which we expect to amount to more than $3 million this year, we now project operating margins of approximately 12% in 2018 for the mainstream networking business, now comprising about 99% of the Company revenues.
Cash flow from operations in the first half 2018 continued to be strong, following similar performance in the past three years. We remain confident for the second half of 2018 and beyond as we continue to enjoy good business momentum in winning enterprise voice deployments and service provider network transformation projects. We also experienced continued evolution of new opportunities in our Voice.AI business.
ValuEngine updated its recommendation from HOLD to BUY for AudioCodes LTD on 2018-07-24. Based on the information we have gathered and our resulting research, we feel that AudioCodes LTD has the probability to OUTPERFORM average market performance for the next year. The company exhibits ATTRACTIVE Momentum and Sharpe Ratio.
|
ValuEngine Forecast |
||
|
Target |
Expected |
|
|---|---|---|
|
1-Month |
9.06 | 0.71% |
|
3-Month |
9.13 | 1.39% |
|
6-Month |
9.36 | 3.97% |
|
1-Year |
9.77 | 8.55% |
|
2-Year |
10.10 | 12.28% |
|
3-Year |
10.24 | 13.78% |
|
Valuation & Rankings |
|||
|
Valuation |
15.26% overvalued |
Valuation Rank(?) |
|
|
1-M Forecast Return |
0.71% |
1-M Forecast Return Rank |
|
|
12-M Return |
35.95% |
Momentum Rank(?) |
|
|
Sharpe Ratio |
0.28 |
Sharpe Ratio Rank(?) |
|
|
5-Y Avg Annual Return |
11.26% |
5-Y Avg Annual Rtn Rank |
|
|
Volatility |
40.31% |
Volatility Rank(?) |
|
|
Expected EPS Growth |
-16.22% |
EPS Growth Rank(?) |
|
|
Market Cap (billions) |
0.39 |
Size Rank |
|
|
Trailing P/E Ratio |
24.32 |
Trailing P/E Rank(?) |
|
|
Forward P/E Ratio |
29.03 |
Forward P/E Ratio Rank |
|
|
PEG Ratio |
n/a |
PEG Ratio Rank |
|
|
Price/Sales |
2.38 |
Price/Sales Rank(?) |
|
|
Market/Book |
7.42 |
Market/Book Rank(?) |
|
|
Beta |
0.42 |
Beta Rank |
|
|
Alpha |
0.21 |
Alpha Rank |
|
